
Exploring the Influence of Country, Industry, and Gender Features
in Machine Learning-Based Rich List Prediction
Juming Zhang
Faculty of Engineering, The University of Queensland, Brisbane, Queensland, 4072, Australia
Keywords: Machine Learning, Rich List Prediction, Linear Regression.
Abstract: In the context of economic globalization, the global rich list is also undergoing subtle changes year by year.
From a macro perspective, the impact of countries, industries, and gender on personal assets cannot be ignored.
This study will use learning models to predict the 2025 rich list, and use information visualization to draw
images and machine learning to explore the impact of different features on the list, so as to understand the
global wealth distribution, analyze market and industry trends, and infer whether gender has an impact on the
rich industry. The study found that when using a linear model for prediction, the best prediction effect is to
build a separate model for each rich person. At present, the concentration of wealth in the United States is
relatively high, far exceeding other countries among the rich, but China, Russia, India, Germany, the United
Kingdom and other countries also have certain advantages on the rich list, showing their importance in their
respective fields. Technology, finance and fashion have a significant impact on the wealth accumulation of
the rich. Gender currently has little impact, reflecting gender equality among the rich.
1 INTRODUCTION
Most people will be very curious when they hear
about the rich list, and the media and public attention
to these lists also makes them a hot topic. Some
people will seek opportunities to learn from the rich
list, study the investment strategies, business models
and management experience of these rich people, and
apply them to their own business or investment. The
rich people on the list often represent the top level of
certain industries, and their experience may be of
reference value to many people who hope to succeed
in related fields (Davies, 2017). Therefore, the study
of the rich list is also very meaningful.
The significance of studying the rich list (such as
the Forbes Billionaire List) is broad and far-reaching,
involving multiple levels such as economy, society,
politics, and culture (Neumayer, 2004). Firstly,
through the rich list, it could be clearly understood the
distribution of global wealth and identify which
countries or regions have more wealth accumulation.
Studying the rankings helps analyze the extent to
which wealth is concentrated in a few people, as well
as the changing trends in the gap between the rich and
the poor, thereby providing a basis for the formulation
of economic policies (Krcmaric, 2024).
Secondly, analyzing the industry background of
the rich can help identify which industries are on the
rise. For example, in recent years, a large number of
new rich people have emerged in the technology
industry, reflecting the rapid growth of the
technology industry. The growth in the number of
wealthy people and their wealth is an important
indicator of economic vitality and national economic
strength, and can reflect the health of the economy.
Thirdly, studying the rich list can help investors
identify market hot spots and potential investment
opportunities. For example, by analyzing the wealth
growth of the rich in a certain industry, investors can
adjust their investment strategies. For entrepreneurs,
knowing which industries have created the wealthiest
people can guide them in choosing promising
entrepreneurial directions.
This study mainly used machine learning and
information visualization methods (Mahesh, 2020).
The machine learning models include linear
regression models and decision tree models, and the
information visualization method is to draw charts
related to different features. In the past, researchers
mainly used macroeconomic analysis and stock
market valuation to predict. However, this study used
modern machine learning algorithms can process
large amounts of data and make full use of many years
66
Zhang, J.
Exploring the Influence of Country, Industry, and Gender Features in Machine Learning-Based Rich List Prediction.
DOI: 10.5220/0013231500004558
In Proceedings of the 1st International Conference on Modern Logistics and Supply Chain Management (MLSCM 2024), pages 66-72
ISBN: 978-989-758-738-2
Copyright © 2025 by Paper published under CC license (CC BY-NC-ND 4.0)

of historical data for training, thereby improving the
accuracy of predictions. In addition, machine learning
models, especially complex models like random
forests, decision trees, and neural networks, are able
to capture nonlinear relationships and complex
patterns in data, which gives them an advantage over
traditional statistical methods in predicting trends and
changes in the growth of wealth among the rich
(Dhall, 2020). And machine learning can also be used
to extract important information from a large number
of features, such as country, industry, age, etc., to help
identify key factors that affect wealth growth. This
study used machine learning to explore the
relationship between the rich list and country,
industry, and gender, and then inferred the
relationship between personal wealth and the three.
The advantage of visualization is that it can present
complex data results in a simple and intuitive form,
so that non-technical personnel can understand it.
This study uses pie charts, bar charts, trend lines and
other charts to clearly reveal the distribution and
changes of wealth.
2 METHOD
2.1 Data Acquisition and Processing
The dataset used in this study is the annual rich list
from 1997 to 2024. The data for each year is a two-
dimensional table, where the attributes include
ranking, name, net worth, country, industry, age,
gender, position, whether it is self-made, and ranking
change. For the initial data processing, since the data
from 1997 to 2014 is relatively old, and the data from
1997 to 2006 is incomplete, and the rankings are
updated very quickly, the impact of 1997 to 2014 on
the prediction is relatively low, so it is ignored.
Finally, the data set from 2015 to 2024 is used for
prediction. The attributes used are: ranking, name, net
worth, country, industry, gender, year (Guillem,
2024).
2.2 Machine Learning Models
This study used three machine learning models: linear
regression model, polynomial regression model, and
random forest model. The linear regression model
prediction is to build a model for each rich person,
and regress and fit the net assets of each rich person
in previous years (Su, 2012). Finally, the year is
substituted into the model to predict the net assets of
each rich person in 2025, and finally the prediction
results are obtained by sorting. Polynomial regression
prediction is divided into two methods in this
experiment (Heiberger, 2009). The first is to build a
polynomial model for the entire data set, and the
second is to build a polynomial model for each rich
person. Both methods use ranking, country, industry,
gender, and year as features, and assets as output
results, and then sort them for prediction. At the same
time, polynomial regression also tries to use only
assets as features to make polynomial fitting
predictions in the second method. The purpose is to
compare with the prediction results of adding more
factors, use linear regression models to analyze the
factors that predict the changes in the net worth of the
rich, and use coefficients to judge the degree of
influence of different features on the changes in net
assets. The random forest model first measures the
importance of the features of country, industry,
gender, ranking, and year, and then combines the
characteristic factors of each feature to predict each
rich person (Rigatti, 2017).
2.3 Evaluation Indicators
This study mainly used two evaluation indicators:
Mean Square Error (MSE) and Coefficient of
Determination (R²) (Ozer, 1985).
MSE calculates the prediction error of the model.
MSE is the average of the sum of squares of the errors
between the predicted value and the true value. The
smaller the MSE, the lower the prediction error of the
model.
R² measures the explanatory power of the model.
R² represents the correlation between the predicted
value and the true value, and the value range is [0, 1].
The closer R² is to 1, the stronger the explanatory
power of the model.
The model testing method is K-fold cross-
validation: K-fold cross validation is a commonly
used model evaluation technique to evaluate the
performance and generalization ability of machine
learning models. It achieves more reliable model
evaluation by dividing the dataset into multiple
subsets.
This validation method is to first divide the dataset
into K subsets (folds). Each subset is called a fold. In
each iteration, one of the folds is used as the
validation set, and the remaining K-1 folds are used
as training sets. In K iterations, a different fold is used
as the validation set each time to evaluate the model
performance. The average of the K evaluation results
is calculated as the final performance indicator of the
model. In this test, the dataset is divided into 5 or 10
folds to increase the reliability of the validation
results. The advantage of K-fold cross validation is
Exploring the Influence of Country, Industry, and Gender Features in Machine Learning-Based Rich List Prediction
67
that by training and validating the model on different
data subsets, the overfitting of the model to the
training set can be reduced. Each data point is used as
a training and validation set once, which helps to
more accurately evaluate the generalization ability of
the model.
3 STATISTICAL ANALYSIS
In this work known data sets are leveraged to draw
pie charts, line charts, and bar charts for
demonstrating the top 200 richest people each year
based on country, industry, and gender.
3.1 Analysis of Country Distribution
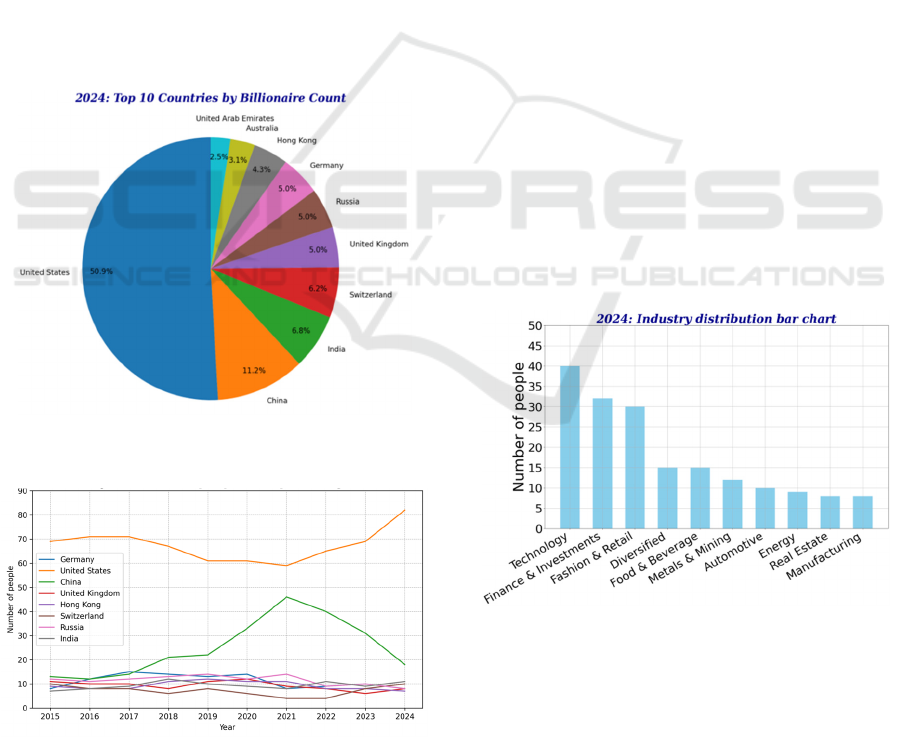
Figure 1 shows the distribution of the top 10 countries
in 2024. Figure 2 shows the line chart of the changes
in the number of people on the list of the top ten
countries in each year from 2015 to 2024.
Figure 1: Distribution of top 10 countries in the rich list in
year 2024 (Figure Credits: Original).
Figure 2: Tendency of rich list changes over years in top
ranking countries (Figure Credits: Original).
From Figure 2, it can be seen that the United
States (US) accounts for 45% of the richest people,
indicating that the US occupies an important position
in the global rich list. This may be closely related to
factors such as the US economic scale, innovation
ability, maturity of the financial market, and
entrepreneurial spirit. In addition, As the world's
second largest economy, China has seen an increase
in the number of its wealthy people year after year,
reflecting the country's rapid economic growth and
wealth accumulation. China's business environment
and market opportunities have promoted the growth
of local wealthy people. What is more, Countries such
as Germany, the United Kingdom, Russia, India,
Hong Kong, and Switzerland also maintain a certain
presence in the global rich list, showing their
importance in their respective economic sectors. For
example, Germany's industry and manufacturing, the
United Kingdom's financial services, Russia's energy
industry, India's technology and entrepreneurship,
Hong Kong's financial markets, and Switzerland's
financial confidentiality and high net worth
population management all contribute to their
position in the global rich list.
3.2 Analysis of Industry Distribution
Figure 3 shows a bar chart of the number of people in
the top 200 of the rich list by industry in 2024. Figure
4 shows a line chart of the number of people in the
top ten industries in the past five years.
Figure 3: Distribution of top 10 industries in the rich list in
year 2024 (Figure Credits: Original).
From Figure 4, it can be seen that the technology
industry occupies a prominent position in the rich list,
and in the past ten years, the technology industry has
accounted for the highest proportion almost every
year. This shows that the technology industry has a
huge impact on the wealth accumulation of the rich.
MLSCM 2024 - International Conference on Modern Logistics and Supply Chain Management
68
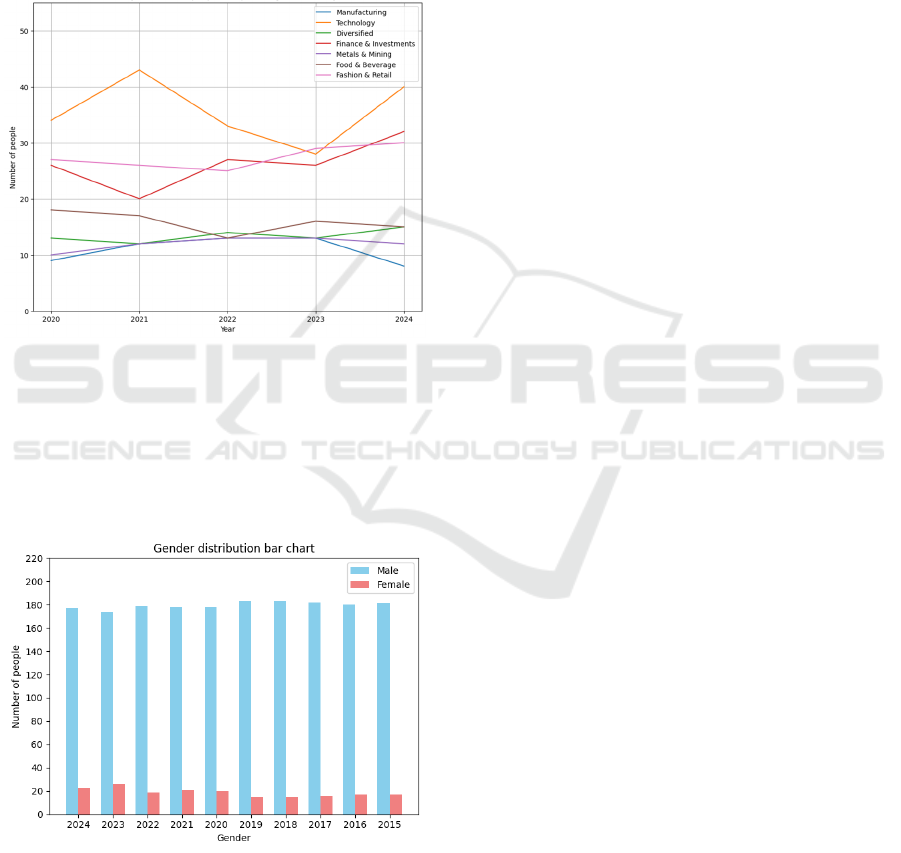
Moreover, in 2024, Finance & Investment also
frequently appeared in the top three of the rich list,
which shows that the finance and investment industry
plays an important role in the accumulation of wealth.
Besides, emerging industries (such as food and
beverage, manufacturing, etc.) gradually entered the
rich list. This shows that although technology, finance
and fashion retail are the main sources of wealth,
other industries are also beginning to play an
increasingly important role.
Figure 4: Tendency of rich list changes over years in top
ranking industries (Figure Credits: Original).
3.2 Analysis of Gender Distribution
Figure 5 shows the number of men and women in the
top 200 richest people list each year from 2015 to
2024.
Figure 5: Distribution of gender in the rich list from year
2015 to 2024 (Figure Credits: Original).
From Figure 5, it can be seen that the male to
female ratio is about 9:1 every year, which may mean
men’s advantages in wealth accumulation and
economic opportunities may indicate gender
inequality. In many industries and regions, women
may face more barriers or restrictions.
4 EXPERIMENTS AND RESULTS
4.1 Experimental Setups
4.1.1 Setting of Linear Regression
The core of linear regression is to use the least squares
method to fit at the first order. Specifically, the role
of the least squares method is to find a linear model
that minimizes the sum of squared errors between the
model's predicted values and the actual values. This
is a common regression analysis method used to fit a
linear relationship on a given data set.
Before data input, standardization is used to
process the data, making the entire training process
more stable and effective. Standardization adjusts the
mean of the features to 0 and the standard deviation
to 1, so that all features are trained on the same scale.
This helps prevent certain features from having too
much influence on the model, which can lead to an
unstable learning process.
In the experiments, the data years earlier than the
current forecast year is used for training and the data
of the current forecast year for testing.
4.1.2 Setting of Polynomial Regression
This article uses three methods to perform polynomial
prediction: (1) Use only year as feature and assets as
target variable. (2) Make a pipeline model for each
rich person, where the features of each model are: net
assets, country, industry, gender, and the assets of
each rich person are the target variable of each model
(3) Use pipeline model for overall data, with features
of country, industry, gender, year, and assets as target
variable. All three methods predict the net assets of
each rich person in 2025 and then rank them.
Polynomial Method 1: First, group the data by
the names of the rich and make predictions for each
rich person individually. That is, build a polynomial
regression for each rich person. Then select year as
feature and wealth as target variable. And the year
characteristics are standardized (The data is still
transformed into a standard normal distribution with
a mean of 0 and a variance of 1).
When building a model, Pipeline is used to create
a polynomial regression model, including feature
transformation and linear regression. Polynomial
Features is then used to generate polynomial features,
Exploring the Influence of Country, Industry, and Gender Features in Machine Learning-Based Rich List Prediction
69

specifying different degrees (that is, orders) to
capture nonlinear relationships and compare
prediction results of different orders.
Here is some explanation of the pipeline model.
The Pipeline Model is a method used in machine
learning to string together multiple data processing
and modelling steps. The Pipeline model can
integrate multiple steps such as data preprocessing,
feature selection, feature conversion, and model
training into a unified workflow, greatly improving
the maintainability and reusability of the code and
reducing manual operations and human errors.
Train the model using historical data of each rich
person. Finally, substitute the year into the trained
model for prediction. Polynomial regression can
capture more complex trends by using higher-order
features. It can fit nonlinear relationships compared
to simple linear regression.
Polynomial Method 2: Similar to method one,
but a pipeline model is built for each rich person and
features such as country, industry, and gender are
added through one-hot encoding for polynomial
fitting prediction. Use ColumnTransformer (a method
from the sklearn. compose package in Python) to
standardize features (for years) and one-hot encode
(for categorical variables). Create a Pipeline that
includes polynomial features and a linear regression
model. Train the model using the data for each rich
person.
For non-numerical information such as country,
industry, and gender, this experiment uses one-hot
encoding to convert them into binary vectors. In this
vector, only one position is 1, and the rest are 0. This
position corresponds to the position of the category
among all possible categories. The features converted
by One-Hot Encoding are passed to the model as
input data. The model learns the relationship between
the features and the target variable based on the
values of these features, thereby automatically
determining the weight of each feature. Through
training, the model adjusts the weight of each feature
to minimize the prediction error.
Finally, 2025 is entered into the established model.
Make predictions and keep the rich people whose
prediction results are greater than zero. (The rich
people predicted with negative values are at the
bottom of the rankings over the years, and the net
assets of the rankings are in billions, while their assets
on the rankings are close to 1, so the model has a
greater impact on them)
Polynomial Method 3: Finally, the third method
uses a pipeline model, with country, industry, gender,
year, and assets as target variables. It standardizes the
Year column to eliminate the dimension effect of
numerical features, similar to the previous methods.
Then this method creates a multinomial regression
model through the pipeline.
4.1.3 Setting of Random Forest
The core idea of random forest model is to improve
the stability and accuracy of the model by combining
the prediction results of multiple decision trees. A
decision tree is constructed for each subset, and the
training data for each tree is different. When splitting
at each node, a portion of the features are randomly
selected for consideration instead of using all the
features. This makes the trees different and reduces
overfitting.
This study uses random forest to measure the
importance of different features, which is equivalent
to the weight of the impact on the prediction results,
and then substitutes the established model into the
2024 data for prediction.
In this model, the following features are selected
for analysis: Rank, Country, Business Category,
Gender, and Year. Wealth (Billion $) is used as the
target variable for prediction. This method converts
categorical variables into numerical features so that
they can be input into the model for training. Here,
pandas.get_dummies is used to convert categorical
variables (such as country, industry, and gender) into
one-hot encoding form.
In this experiment dataset is split into a training
set and a test set with a ratio of 70% and 30%. This is
a common practice in machine learning to ensure the
performance of the model on unseen data. And set the
maximum depth to 10 to prevent overfitting
4.2 Model Comparison
Through linear regression analysis, it can visualize
the importance of different features in predicting the
difference in the net assets of the rich, and provide the
importance ranking of each feature. Feature
importance and coefficients can provide explanations
and analysis of the prediction model, helping people
understand which factors have the greatest impact on
the prediction results.
Table 1: Result comparison of different models.
Model MSE R
2
linear re
g
ression 8.3 0.64
p
ol
y
nomial model method1 171.5 0.7
p
olynomial model method2 320.7 0.17
p
olynomial model method3 17.1 0.97
random tree 65.6 0.28
MLSCM 2024 - International Conference on Modern Logistics and Supply Chain Management
70

Table 1 shows the MSE and R
2
calculated for each
model and method. Table 2 shows the most accurate
prediction among all the model calculation results,
showing the top 20 prediction rankings
Table 2: Predicted wealth of rich list.
Rank Name
Wealth
(Billion $)
1 Bernard Arnault & famil
y
236.1
2 Elon Mus
k
226.6
3 Jeff Bezos 202.6
4 Warren Buffett 165.2
5 Bill Gates 133
6 Larr
y
Ellison 130.8
7 Mark Zuckerber
g
124.7
8 Larr
y
Pa
g
e 116.7
9 Steve Ballme
r
113.8
10 Sergey Brin 112.5
11 Michael Bloomberg 104.6
12
Francoise Bettencourt
Meyers & family
104.1
13 Rob Walton & famil
y
97.2
14 Qin Yinglin & famil
y
93.9
15 Mukesh Ambani 93.3
16 Carlos Slim Helu & famil
y
91.5
17 Gautam Adani 87.1
18 Amancio Ortega 83.2
19 Alice Walton 81.2
20 Jim Walton 81.1
These results of linear regression model shows
that the prediction model is more reliable at the top of
the prediction list, and the prediction becomes less
reliable as it goes further back, because the top rich
have a large wealth base, while the opposite is true for
the rich at the bottom of the ranking.
In Polynomial method1, the data results show that
pure numerical prediction is not accurate. It is
possible to add more features for increasing the
accuracy of prediction.
In Polynomial method 2, the results show that the
prediction results of this model are poor. Compared
with method 1 and method 3, it can be seen that
building a model for each rich person is more accurate
than using the overall data model to make predictions.
In Polynomial method 3, the results show that the
model fits well. It shows that the best prediction
results are obtained by building a model for each
billionaire separately and adding characteristics such
as country, industry, gender, etc.
4.2 Feature Importance Analysis
The result of random forest shows that the decision
tree prediction considers the country and business to
have a higher degree of influence, as shown in Table
3. However, due to the low accuracy of the
calculation, it is possible to add other features that
have a greater impact on the rankings.
Table 3: Feature importance measured from random forest
results.
Feature Feature Importance
Countr
y
Business 0.63
Yea
r
0.37
Gende
r
0
A further investigation shows the top 20 features
and their coefficients among all the correlation
coefficients of the linear regression model. It could be
found that investment, finance, food and beverage
and other industries play an important role in the
predicted asset differences. The influence of East
Asian countries cannot be underestimated.
5 CONCLUSIONS
This article used information visualization to draw
pictures to intuitively find the characteristic factors
that may affect the rich list, and then use machine
learning to predict different results under different
characteristic conditions. The linear regression model
is mainly used to compare the results of linear fitting
predictions based on the assets of each rich person
with the results of linear fitting based on assets and
other factors (country, industry, gender). In this way,
it could be found out the impact of country, industry
and gender on the rich list. And this work uses the
random forest model to analyze the weight ratio of
different characteristics.
Finally, this study found that when a linear
regression model was established for each rich
person, the accuracy after verification was the
highest. It was also found that the year and ranking
had a greater impact on the results.
It may reflect the impact of time trends on the
wealth of billionaires. This can be understood as the
overall economic environment, technological
progress, global market dynamics and other factors
will affect the accumulation of billionaire wealth over
time. The ranking is not only a number, it also reflects
the fierce competition among billionaires around the
world. The rich who can stay at the top may have
competitive advantages in certain aspects (such as
business vision, market share, etc.). From a national
level, other countries also have significant wealthy
individuals, but their proportion is relatively small
compared to the United States, reflecting the uneven
Exploring the Influence of Country, Industry, and Gender Features in Machine Learning-Based Rich List Prediction
71

distribution of global wealth. From an industry
perspective, the technology industry has the greatest
impact on wealth accumulation, mainly due to its
innovation and market drivers. The financial and
investment industries play an important role in wealth
management and capital operations. The fashion and
retail industries have a stabilizing impact on wealth
accumulation, reflecting the value of brands and
consumer markets. The growth of emerging
industries indicates an increase in the diversity of
wealth accumulation, which may lead to changes in
wealth distribution. The results show that gender has
little effect, probably because the number of male
billionaires in the dataset is far greater than that of
female billionaires, and the model may automatically
ignore the importance of gender because its impact on
the prediction results is negligible.
REFERENCES
Davies, J. B., Lluberas, R., & Shorrocks, A. F. 2017.
Estimating the level and distribution of global wealth,
2000–2014. Review of Income and Wealth, 63(4), 731-
759.
Dhall, D., Kaur, R., & Juneja, M. 2020. Machine learning:
a review of the algorithms and its applications. Procee
dings of ICRIC 2019: Recent innovations in computing,
47-63.
Guillem, SD. 2024. Forbes Billionaires Evolution 1997-20
24. Kaggle Dataset, URL: https://www.kaggle.com/da
tasets/guillemservera/forbes-billionaires-1997-2023. L
ast Accessed: 2024/08/08
Heiberger, R. M., Neuwirth, E., Heiberger, R. M., &
Neuwirth, E. 2009. Polynomial regression. R Through
Excel: A Spreadsheet Interface for Statistics, Data
Analysis, and Graphics, 269-284.
Krcmaric, D., Nelson, S. C., & Roberts, A. 2024. Billionai
re Politicians: A global perspective. Perspectives on P
olitics, 22(2), 357-371.
Mahesh, B. 2020. Machine learning algorithms-a
review. International Journal of Science and
Research, 9(1), 381-386.
Neumayer, E. 2004. The super-rich in global perspective: a
quantitative analysis of the Forbes list of
billionaires. Applied Economics Letters, 11(13), 793-
796.
Ozer, D. J. 1985. Correlation and the coefficient of
determination. Psychological bulletin, 97(2), 307.
Rigatti, S. J. 2017. Random forest. Journal of Insurance
Medicine, 47(1), 31-39.
Su, X., Yan, X., & Tsai, C. L. 2012. Linear regression. Wil
ey Interdisciplinary Reviews: Computational Statistic
s, 4(3), 275-294.
MLSCM 2024 - International Conference on Modern Logistics and Supply Chain Management
72
