
Predicting the Gold Price Based on XGBoost
Yixian Li
a
Ulink College of Shanghai, Zhejiang, China
Keywords: Gold Price, XGBoost, Price Forecasting, MSE.
Abstract: In recent years, accurate gold price forecasting has become increasingly important for investors, economists,
and policymakers. To enhance the accuracy of such predictions, various machine learning models have been
explored. This paper aims to explore the validity and practicability of using eXtreme Gradient Boosting
(XGBoost) to predict gold prices. XGBoost is widely used for supervised learning problems and, as an
excellent gradient boosting algorithm, it performs exceptionally well in processing structured data and time
series prediction. This study constructs a prediction model based on XGBoost through historical gold price
datasets, combined with market indicators and economic factors, and assesses its predictive power and
stability. By evaluating the model's performance, the research seeks to determine whether XGBoost offers a
reliable and efficient tool for gold price forecasting, potentially influencing financial and investment strategies.
The results show that XGBoost is a robust and effective model for forecasting gold prices, providing valuable
insights for informed decision-making in financial markets.
1 INTRODUCTION
Gold is a precious metal that has demonstrated
immense significance and has assumed diverse roles
within the financial market, encompassing risk
mitigation, a medium of exchange, a store of value,
and an indicator of interest rate sensitivity, among
others. Beyond historical contexts, gold has long been
synonymous with wealth and authority. Additionally,
it serves as a prudent investment option, offering risk
hedging and asset diversification capabilities. The
primary sources of gold supply stem from mining and
recycling, both of which are labor-intensive
endeavors, contributing to gold's scarcity and
reinforcing its recyclability (Beckmann et al., 2019;
Cotty et al., 2023).
As a result of gold's multifaceted functions and
uses, numerous factors influence its price. These
diverse influences encompass economic indicators
such as changes in Gross Domestic Product, inflation
rates, and prevailing monetary policies, as well as the
demand and supply dynamics of gold itself and the
exchange rate of international trading currencies
(Qian et al., 2019; Erdoğdu, 2017; Lili & Chengmei,
2013).
a
https://orcid.org/0009-0006-7854-9994
Several studies have shown that eXtreme
Gradient Boosting (XGBoost) performs well in gold
price forecasting. For example, Jabeur et al. (2024)
study combines XGBoost and shapley additive
explanations (SHAP) values to provide an in-depth
analysis of the effects of different characteristics on
gold prices. The results show that economic data
(such as inflation rates, interest rates) and market
sentiment (such as investor sentiment indices) play an
important role in the forecasting model.
However, in many of the past research, many of
the researchers chose to use the long-short term
memory (LSTM) model to reasonably predict future
price changes. Amini and Kalantari (2024) in their
study proposed a model combining convolutional
neural network (CNN) and bidirectional Long Short-
Term memory network (Bi-LSTM) for gold price
prediction. The aim of this research is to improve the
prediction performance of the model by introducing
automatic parameter tuning methods to adapt to the
dynamic nature of the gold market.
Compared with other prediction methods,
XGBoost shows high accuracy and stability. For
example, Shi (2023) compared the performance of
XGBoost and LSTM in bitcoin price prediction,
pointing out that XGBoost can provide better
Li, Y.
Predicting the Gold Price Based on XGBoost.
DOI: 10.5220/0013230700004568
In Proceedings of the 1st International Conference on E-commerce and Artificial Intelligence (ECAI 2024), pages 355-359
ISBN: 978-989-758-726-9
Copyright © 2025 by Paper published under CC license (CC BY-NC-ND 4.0)
355
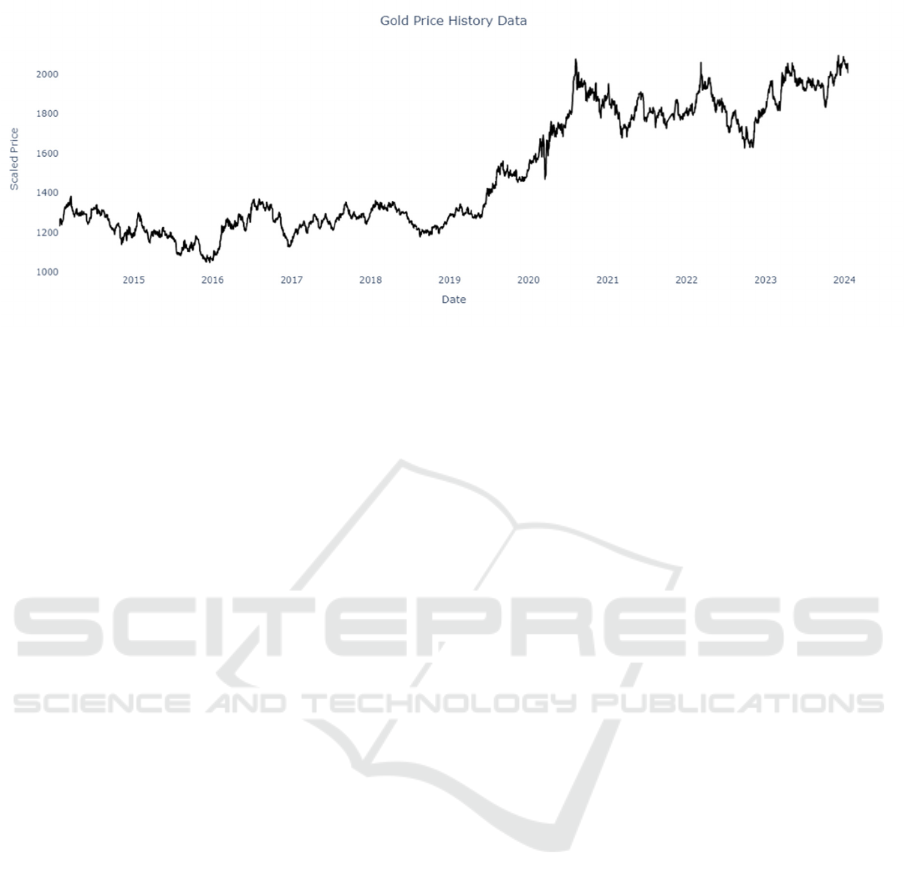
Figure 1: gold price variation during 2014 – 2024 (Photo/Picture credit: Original).
prediction results in some cases. Similar studies in
gold price forecasting also found that XGBoost
outperformed LSTM when dealing with nonlinear
features and complex patterns.
The author discovered that quite a few would use
other machine learning models such as XGBoost
which is also a very effective model in regression and
prediction. Basically, this article will make use of
XGBoost, which is one of the machine learning
models, to observe and predict the gold price, making
use of decision trees and regressions and making use
of mean square error (MSE) to evaluate whether the
model the author produced is effective.
Through further discussion of the methodologies
to be used to predict future price changes, hopefully,
this study could help provide brand new
understandings about prediction and machine
learning methods, in order to help future researchers
to achieve predictions more accurately and
effectively.
2 MANUSCRIPT PREPARATION
2.1 Data and Method
2.1.1 Data Collection and Description
This passage mainly collects the table data from a
machine learning website and sets the name of the
data as goldsock.csv. The dataset this article has used
is the history of gold price data from 2014 to 2024.
The author has pressed the data and plotted the data
into a broken line graph shown in Figure 1. From
2014 to 2024, generally speaking, the global gold
price showed a rising trend but with some
fluctuations.
As the graph has shown, the gold price first
experienced a small drop from 2014 to the beginning
of 2016, remarkably, the gold price even reached the
lowest price by the end of 2015, ever since the past 6
years. However, the gold price started to rebound in
2016, and continued to increase slowly, which then
reached a peak value in 2020 has begun. Noteworthy,
the gold price started to fluctuate between 2021 and
2023. For the gold price data in 2024, the author
consider that it still needs observation, as 2024 has
not passed through.
2.1.2 Data Pre-processing
This article mainly makes use of the machine learning
model XGBoost, which is an effective model in
regression. Collect the dataset at the very beginning,
and name the file as goldstock. Before the model is
built up, there is an acquire to pre-process the data,
which includes data cleaning, dealing with missing
and non-numeric value and feature engineering. Data
cleaning means dealing with missing and non-
numerical values like column Date, which need to be
eliminated, or missing values which could be filled by
averaging. The author first removed the Date column
in the dataset, as string data types cannot be processed
and calculated, d other columns with numerical data
like Open, Close, High, and Low are stored in a
created feature matrix and named X. After that, the
passage included choosing one of the most significant
columns as main research targeted variable named as
Y.
Then, the feature matrix X and the targeted
variable Y are divided into X_train, X_test, Y_train,
Y_test, by simply using the function train_test_split
in the model selection module from the sklearn
library. At this stage, various algorithm models are
ECAI 2024 - International Conference on E-commerce and Artificial Intelligence
356

trained and validated. At the same time, the test set
size is the 20% size of the whole dataset, in addition
to this, a kind reminder that the order of the data
should not be changed. Then, the researcher needs to
build up feature engineering, which includes feature
choosing, transmitting, and setting. Feature of the is
chosen through analyzing the data’s correlation and
importance of the feature, and transformation could
be finished if the grouped data is standardized and
normalized, in order to fit the demand for specified
models. (which is XGBoost in this passage); settings
of features will include originally existing features
which majorly are statistical variables like mean and
standard deviation. Last but not least, the researchers
need to ensure that the format of the processed data
could fit the model, for example, XGBoost needs the
data to be transformed into DMatrix. After all these
steps, the raw data is fully processed and is suitable
for private model to utilize, in order to increase the
model performance and the accuracy and precision of
predicted value.
2.2.1 Applying XGBoost Model
This article makes use of the XGBoost model to
predict future gold price changes. XGBoost is a kind
of machine learning model based on gradient lifting
decision trees, it builds up a strong learner through
combining several weak learners, in order to achieve
a prediction with high precision. XGBoost uses
newtonian methods to solve optimization problems
within the function space, allowing users to
customize the objective function according to their
specific needs. To be more specific, the steps used
will be described and shown in this article. Firstly,
create an XG-Regressor model and adjust the
objective parameter as reg:squarederror, the model
will make use of an initialized prediction model
(which is always a simple form of the model, like
predicting the mean). Secondly, to define a loss
function, the author set a specified regression task
using the MSE as the loss function, this function
calculates and stores the difference between the real
value and the predicted value created by the model;
the value of this function decides whether this
function is meaningful or not, lower value of the loss
function, greater accuracy and precision. Thirdly,
configure the number of base learners in the model to
100 By arranging the parameter n_estimators as 100.
After that, make use of training sets X_train and
Y_train to fit and apply the model.
2.2 Results and Discussion
2.2.1 Evaluation and MSE
𝑀𝑆𝐸 =
1
𝑛
𝑦
−𝑦
1
In Equation (1), 𝑛 refers to the number of the sample,
𝑦
refers to the actual observed value, 𝑦
refers to the
predicted value, which is the predicted value of the
model for the 𝑖 th sample.
MSE is a metric used to evaluate the performance
of regression models by measuring the average
squared difference between predicted and actual
values. Specifically, MSE calculates the average of
the squared errors, providing a measure of how close
the predictions are to the actual outcomes. A lower
MSE indicates better model accuracy. Due to its
sensitivity to large errors, MSE is useful in scenarios
where controlling prediction accuracy is crucial.
Calculating MSE is an important step for
evaluating the ability of the regression model like
XGBoost it could help researchers to understand
further the precision and accuracy of the prediction
model, and provide evidence for further model
adjusting.
2.2.2 Results for Predicted Value
Predicting gold prices is a complex task due to
various determinants of gold, including inflation,
monetary policy, etc. In this passage, the author
makes use of broken line graph and scattered
diagrams. Broken line graphs could help in
identifying the trend and comparing between datasets
by exhibiting several lines on a graph in order to
analyze the difference or relationship between the sets
of data. Broken line graph could be used to show
continuous data or data with data type float, which is
not independent and discrete. The scattered diagram
is always used to show the correlation between 2
values, whether they have a strong correlation or
stuff, also it can be used to show whether there is a
missing value as every digit in the data is shown on
the graph as a point.
From the two graphs can see that as time goes on,
the model predicts more accurately. Generally
speaking, the gold price will show an increasing trend
in the next five centuries. To be more specific, the
gold price will increase in the 21st and 24th centuries.
However, the predicted data shows that in the 22nd
and 25th centuries, the price will be relatively stable
with a bit of fluctuation. Remarkably, in the 23rd
century, the gold price will experience a big rise and
a dramatic drop.
Predicting the Gold Price Based on XGBoost
357
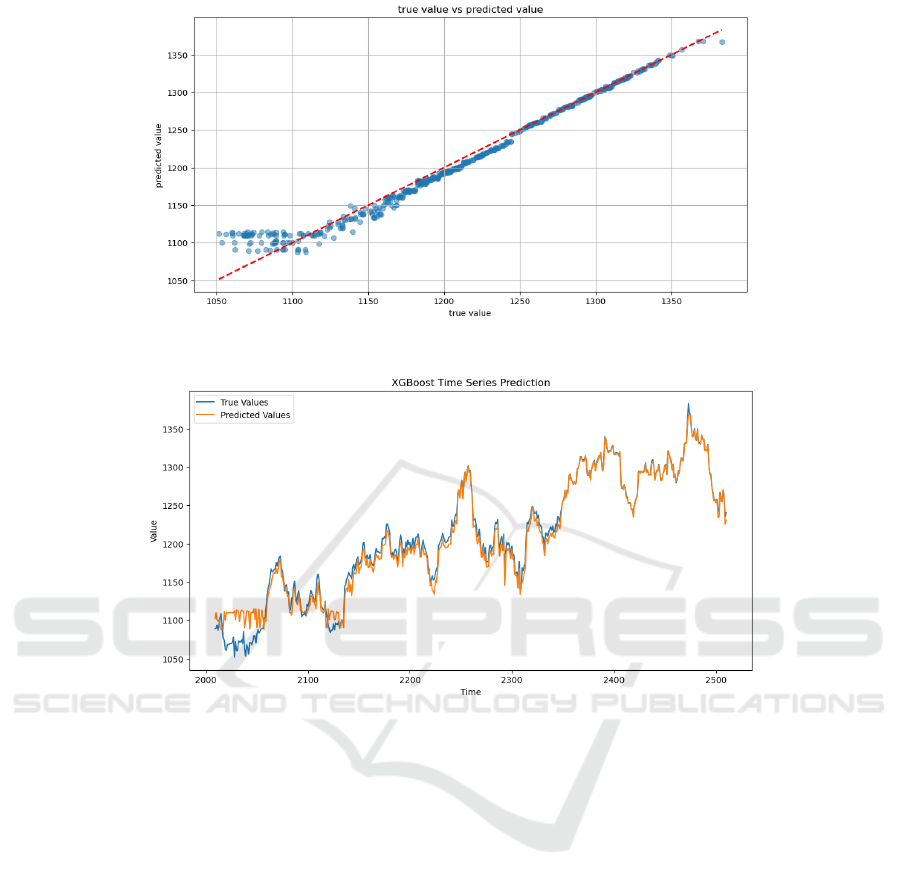
Figure 2: scattered diagram showing the correlation between true and predicted value (Photo/Picture credit: Original).
Figure 3: broken line graph showing the trend in the difference between true and predicted value (Photo/Picture credit:
Original).
Firstly, the author chose to use scattered and
correlation diagrams to visualize the error (Figure 2).
Producing a scattered diagram of true value and
predicted value, blue spots show every data and the
red broken line shows the correlation, which
represents the ideal state of the value (predicted value
equals true value). The graph output by the code show
a generally increasing trend for future gold price
changes. At the same time, these spots shown that
there is a strong correlation between the true value
and the predicted value produced by XGBoost, which
means the model is effective in predicting gold price
and then gold price data is meaningful.
By producing a broken line graph (Figure 3) and
putting both the true value and predicted value on the
same graph in the same scale, the changes could be
shown more directly. As the scattered diagram shows
the correlation between the true value and the
predicted ones, the broken line graph shows how
significant the difference is between the two values.
3 LIMITATIONS AND FUTURE
OUTLOOKS
In this passage, the author mainly used XGBoost to
predict the future gold price changes, thou the model
is a machine learning model with a strong ability to
predict, it has several limitations. To deal with this,
the researchers need to be careful about the
evaluation, to ensure the model performed correctly
and effectively, and ensure whether the dataset used
fits the existing model.
Although XGBoost provides the rankings about
the importance of every feature, it is challenging for
researchers to explain one specified feature.
Compared with other simple models using linear
regression like AutoRegressive Integrated Moving
Average (ARIMA), the explanation for XGBoost
features is much more complex, as the model does not
only have one dimension. It is hard to understand and
ECAI 2024 - International Conference on E-commerce and Artificial Intelligence
358

has higher complexity. At the same time, the higher
complexity of the model will strengthen the burden
on calculation and the computer. XGBoost needs a
great amount of storage and resources for calculation,
this may cause overheat of the computer due to a long
period and high-intense workload if the hardware is
not perfect enough.
Because of the complexity of the model, it is able
to produce a model concluded from the huge amount
of data. However, overfitting might occur if the scale
of the data is not big enough or the noise is too much.
Although normalization and standardization probably
could solve this problem, they need to be debugged
seriously and constantly. It takes a long time and is
challenging but produces similar results to other
machine learning models.
Though with these disadvantages, XGBoost is
still an effective model that could produce quite
complex and accurate results, as it could catch non-
linear relations (Ji et al., 2022; Yaswanth &
Jaisharma, 2024). Hopefully, in the future,
researchers could explore more the adjusting of the
hyperparameters and model optimizing, in order to
increase the precision and accuracy of the model
stability and the model prediction. At the same time,
the author hopes that further majorization of the
model could increase the ability of XGBoost to
perform real-time predictions. Which could lead to
the popularization of the model and better ability to
suit the changes in the market.
4 CONCLUSIONS
This passage built up a predictive model applied in
gold price prediction based on the XGBoost
algorithm. XGBoost makes use of decision trees to
achieve regressions. Through the prediction results of
previous data, the intelligent portfolio optimization
model proposed in this paper uses the model to weigh
the transaction cost and the income obtained in the
transaction to decide whether to trade, and combines
the traditional portfolio model with the algorithm of
machine learning to better apply to the portfolio
research. A regression tree is a type of decision tree
used in machine learning that is designed to predict
continuous target variables based on multiple input
features. It uses a tree model that describes decisions
and their possible consequences, especially target
predictions, to translate observations about a project
into target value conclusions for that project. The
results show that the gold price prediction model
based on the XGBoost algorithm performed
excellently at capturing short-term market
fluctuations and long-term trends. Compared with
traditional time series models, XGBoost can better
deal with complex non-linear relationships and large-
scale feature sets, at the same time, it could improve
the accuracy and stability of the prediction. Although
the XGBoost itself is a black box model, through
feature engineering and data visualization, the
research is able to understand which factors have a
decisive impact on the price of gold. This capability
provides decision-makers with deeper market insight
and helps them develop more precise investment
strategies and risk management programs.
REFERENCES
Amini, A., Kalantari, R., 2024. Gold price prediction by a
CNN-Bi-LSTM model along with automatic parameter
tuning. Plos one, 19(3), e0298426.
Beckmann, J., Berger, T., Czudaj, R., 2019. Gold price
dynamics and the role of uncertainty. Quantitative
Finance, 19(4), 663-681.
Cotty, S. R., Kim, N., Su, X., 2023. Electrochemically
mediated recovery and purification of gold for
sustainable mining and electronic waste recycling. ACS
Sustainable Chemistry & Engineering, 11(9), 3975-
3986.
Erdoğdu, A., 2017. The most significant factors influencing
the price of gold: An empirical analysis of the US
market. Economics, 5(5), 399-406.
Jabeur, S. B., Mefteh-Wali, S., Viviani, J. L., 2024.
Forecasting gold price with the XGBoost algorithm and
SHAP interaction values. Annals of Operations
Research, 334(1), 679-699.
Ji, S., Wang, X., Lyu, T., Liu, X., Wang, Y., Heinen, E.,
Sun, Z., 2022. Understanding cycling distance
according to the prediction of the XGBoost and the
interpretation of SHAP: A non-linear and interaction
effect analysis. Journal of Transport Geography, 103,
103414.
Lili, L., Chengmei, D., 2013. Research of the influence of
macro-economic factors on the price of gold. Procedia
Computer Science, 17, 737-743.
Qian, Y., Ralescu, D. A., Zhang, B., 2019. The analysis of
factors affecting global gold price. Resources Policy,
64, 101478.
Shi, J., 2023. Examine Bitcoin price predictability with
machine learning algorithms. In Third International
Conference on Intelligent Computing and Human-
Computer Interaction (ICHCI 2022) (Vol. 12509, pp.
621-628).
Yaswanth, V., Jaisharma, K., 2024. Prediction of thyroid
nodules using novel optimized XGBoost machine
learning algorithm based on its size compared with non-
linear machine learning algorithm. In AIP Conference
Proceedings (Vol. 2853, No. 1). AIP Publishing.
Predicting the Gold Price Based on XGBoost
359
