
Portfolio Construction Based on LSTM RNN and Black-Litterman
Model: Evidence from Yahoo Finance
Junzhe Wang
Department of Bigdata, Beijing Institute of Technology, Beijing, China
Keywords: LSTM RNN, Black-Litterman Model, Omega Matrix, View, Bias.
Abstract: Portfolio optimization is always a tough issue in fiance field. This study explores the integration of Long
Short-Term Memory (LSTM) Recurrent Neural Networks (RNN) with the Black-Litterman model (BL
model) to improve portfolio optimization. The BL model, which combines the views from the investors with
market equilibrium to modify the revenues that are expected, is commonly used for asset allocation. Yet the
model has a few limitations, including subjectivity, data sensitivity, and complexity. In order to deal with
these issues, the paper proposes incorporating LSTM RNN predictions into the BL model to mitigate bias and
enhance decision-making. The study utilizes historical data from Yahoo Finance for four major
corporations(Apple;Intel;Google;NVIDIA) from January 2023 to August 2024. The LSTM RNN is trained
on this data to generate machine predictions, which are then treated as investor views in the BL model. The
Omega matrix, representing the uncertainty or confidence in these predictions, is adjusted to combine machine
and investor perspectives. Results indicate that while LSTM RNN predictions can improve price forecasting,
they also introduce biases that require careful calibration. The modified BL model, incorporating machine-
generated views, provides a more personalized and potentially more accurate portfolio allocation. This
approach offers a novel way to balance human and machine insights in financial decision-making, though it
requires significant computational resources and expertise to implement effectively. Future research might
focus on refining the Omega matrix estimation and exploring alternative machine learning models to further
enhance the model's robustness.
1 INTRODUCTION
The concept of portfolio was first proposed by Medici
family in the 15th century during the renaissance in
Italy. It was used to describe the collections of the
artists’ works. The famous architect Michelangelo
Buonarroti (1475-1564) once presented his portfolio
of works for an hospital for confirmation (Christensen,
2012). However, nowadays portfolios are mostly
described as a combination of different assets like
derivatives, bonds and real estate. For each asset,
there exists its return and risk. Therefore, for the
investors, the objective is to either minimize risk or
maximize total return when ceteris paribus.
Especially in 1952, Harry Markowitz first transferred
the concept into a mathematical problem and
proposed the portfolio theory in Markowitz model
(Markowitz, 2019). In the early theory, returns were
represented as 𝑟=
∑
𝑤
𝑟
where w represents for
the weight of each asset in the portfolio and the risk
as 𝑅= 𝐸
𝑟−𝐸
𝑟
. In Markowitz model,
returns and risks are shown as the following formulae
(w and r are in vector forms, and Σ is a variance
covariance matrix):
Return = 𝑤
𝑟 (1)
𝑅𝑖𝑠𝑘= 𝑤
Σ𝑤 (2)
Harry Markowitz converts the portfolio management
as an optimization problem as an equation like this.
𝑚𝑎𝑥
𝑤
𝑟−
𝑤
∑
𝑤 (3)
The model aims to seek the balance between return
and risk, which of the relationship can also be
described as the Sharpe Ratio. Despite this,
inefficiency still existed in the model. The non
negligible fact is that those investors aren’t always
risk-averse as well as their expected return won’t
always be the highest (Ban et al, 2016; Best, 2010;
Fabozzi et al, 2007).
Wang, J.
Portfolio Construction Based on LSTM RNN and Black-Litterman Model: Evidence from Yahoo Finance.
DOI: 10.5220/0013225400004568
In Proceedings of the 1st International Conference on E-commerce and Artificial Intelligence (ECAI 2024), pages 337-343
ISBN: 978-989-758-726-9
Copyright © 2025 by Paper published under CC license (CC BY-NC-ND 4.0)
337

The portfolio theory was developed ever since.
And in 1992, Fisher Black and Robert Litterman put
forward the Black-Litterman Model (BL model)
(Black & Litterman, 1992a; Black & Litterman,
1992b; Jorion, 1992). The BL model is an asset
allocation model that combines investors’ views on
the market with the equilibrium portfolio implied by
the market's risk and return characteristics (Gunjan &
Bhattacharyya, 2023). It adjusts the market
equilibrium using the investor's views to create a new
expected return for each asset, which is then used to
optimize the portfolio allocation. This enables
investors to factor their personal opinions about how
the market will behave in the future into their
investment choices. Matrix P represents for the map
of investors’ views to assets (He & Litterman, 2002).
Vector Q represents for actual views. Matrix Ω is an
uncertainty matrix. Nevertheless, BL model yet is not
perfect nor complete, that it is defective in several
aspects as follows (Walters, 2014):
Subjectivity. The model requires subjective
inputs from the user, such as views on expected
returns and the choice of risk aversion
parameters. This subjectivity can lead to bias
and errors in the results.
Data sensitivity. The covariance matrix and
expected returns are two examples of the input
data that the model is extremely sensitive to, and
even slight changes in these inputs can have a
big impact on the allocation outcomes.
Complexity. The model is complex and requires
a deep understanding of financial markets and
investment theory in order to use it effectively.
This complexity can make it difficult for less
experienced users to implement the model
correctly.
Lack of historical validation. The model is
based on forward-looking views and
expectations, which may not be accurately
reflected in historical data. This can lead to the
model producing unrealistic or unreliable
allocations.
Limited application. The model is best suited for
institutional investors with access to extensive
resources and data, making it less practical for
individual or retail investors.
Due to the inefficiency and the improvement
based on previous research to BL model, the paper
aims to research on the construction of portfolios
under Markowitz model and BL model, using LSTM
model to eliminate the bias from the investors and
trying to add machine views against human views.
Hopefully, it will generate a more humanized result
according to the proportion of how the investors trust
the prediction from machines. Additionally, the
influence from the machines could be artificially
adjusted as a parameter within a specific scope
(Selvin et al, 2018).
2 DATA AND METHOD
The paper choose the history data for four
corporations from https://finance.yahoo.com: NVDA,
Apple, Intel, Google from 2023.01.01 - 2024.8.1 and
put them into the LSTM RNN for former prediction
as the machine view, and combine it with investor’s
view to verify and predict the future value of each
stock. This study mainly based on an improved BL
model, associated with LSTM model. To be specific,
it will be dealing with the Omega Matrix in the BL
model, in which interfered with the machine view to
combine with the investors’ view.
The modified model addresses the issue of having
to make a return assumption for an asset when no
historical data is available. The model initially
specifies the mean together with covariance matrix of
expected returns based on the market equilibrium.
The formulas for the mean-variance optimization are
as minimize w'Σ𝑤and subject to 𝑤′𝜇= 𝑅. Here, w is
the weight of the assets in vector form; μ represents
for the expected returns in vector form; Σ is the
covariance matrix; R is the targeted return. The
modified model then incorporates the investor's
subjective views through a Bayesian adjustment
process. The equation to calculate the adjusted
expected returns is:
𝐸
∗
= Σ((Σ
+ 𝑃′𝑄
𝑃)
)(Σ
𝐸+ 𝑃′𝑄
𝑄) (4)
Where E* is the adjusted expected return; Σ is the
covariance matrix; P is the matrix mapping the
expected returns to the views; Ω is the covariance
matrix of the errors in the views and Q is the vector
of views. Finally, the model suggests the computation
of the new optimized portfolio weights using the
adjusted expected returns and the covariance matrix.
Recurrent neural network (RNN) architectures
such as Long Short-Term Memory (LSTM) are
specifically created to solve the vanishing gradient
issue that can arise with conventional RNN. RNN'
capacity to identify long-range dependencies in
sequential data may be constrained by the vanishing
gradient problem.
LSTM networks consist of memory cells that are
connected through special gates. By controlling the
information entering and leaving the memory cells,
these gates enable the network to store and recall data
as needed. The input gate, forget gate, and output gate
are the three primary gates in an LSTM network.
ECAI 2024 - International Conference on E-commerce and Artificial Intelligence
338
The forget gate regulates the amount of data that
is eliminated from the cell state, whereas the input
gate regulates the amount of new information that is
added to the cell state. The quantity of data
transferred to the network's subsequent layer is then
controlled by the output gate.
For experiment steps, one first trains the LSTM
model on historical asset prices to predict future
returns and extracts the predicted returns for the
relevant assets. Then, this study will treat the LSTM
predictions as views on expected returns for the assets.
Construct the Omega matrix based on the confidence
in the LSTM predictions. For example, Omega could
be a diagonal matrix where each element corresponds
to the inverse of the variance of the LSTM prediction
errors. Subsequently, this research will Combine the
equilibrium returns (from a market capitalization-
weighted portfolio) with the LSTM-based views,
weighted by the Omega matrix, to derive the posterior
expected returns. Finally, this paper will use the
posterior expected returns to optimize the portfolio,
typically using mean-variance optimization.
To assess the performance of the BL model and
the LSTM RNN in portfolio optimization and
forecasting, one evaluated both models using
historical market data from 2023.01.01 to 2024.08.27.
The primary metric for evaluation include the
comparison and combination of Omega Matrix which
represent the uncertainty and confidence of an
investor and the machine view generated by the
model. While the BL model excels in portfolio
optimization with a robust risk-adjusted return, the
LSTM RNN outperforms in price prediction accuracy.
However, the LSTM RNN's performance may vary
significantly due to the choice of hyper-parameters
and the volume of training data. The omega matrix is
a key parameter in the BL model, which is used to
incorporate the investor's confidence in the
equilibrium market returns. It represents the
uncertainty or in another way, the confidence in the
market equilibrium returns and is typically derived
from the investor's views or historical data. The
omega matrix helps to adjust the variance of the
equilibrium returns and influences the overall
portfolio weights. A higher value in the omega matrix
indicates higher uncertainty or lower confidence in
the equilibrium returns, which can lead to a higher
adjustment in the portfolio weights.
3 RESULTS AND DISCUSSION
This section presents the performance of the BL
model and LSTM RNN on the chosen data set from
four corporations in four different parameters in
omega matrix of investor’s view which represents
how the investors believe in machine prediction. The
metrics used for evaluation include the Omega matrix,
which is constructed as a diagonal matrix, with
elements derived from the variance of the LSTM
prediction errors. The results are shown in Figure. 1,
Figure. 2, Figure. 3 and Figure. 4 for Microsoft, Intel,
Apple and NVIDA, respectively.
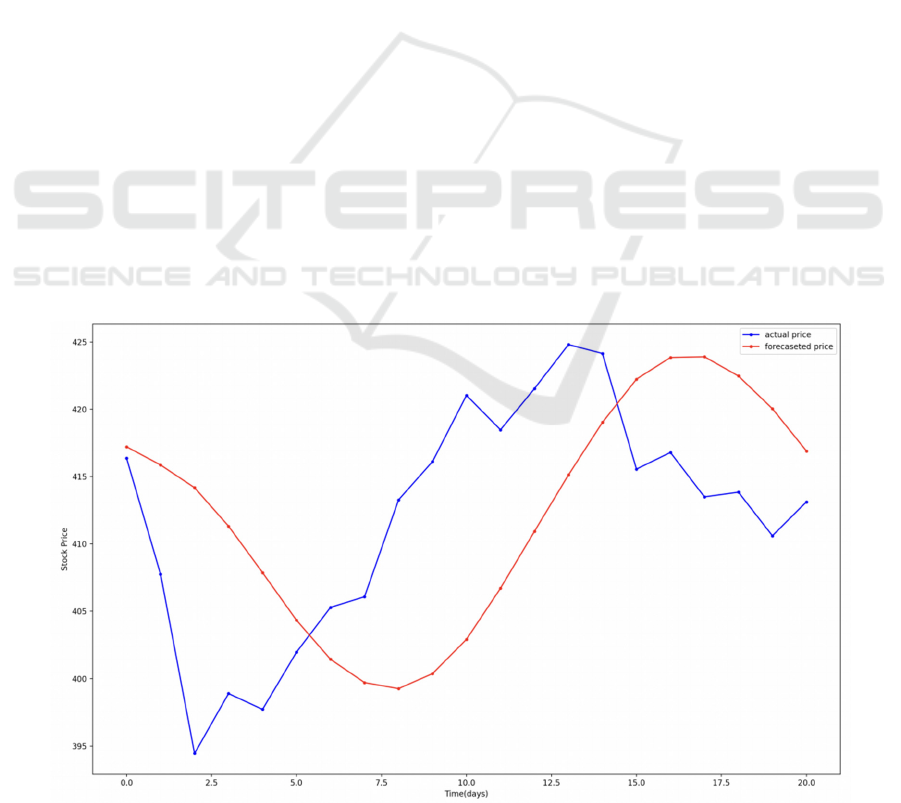
Figure 1: Results for Microsoft (Photo/Picture credit: Original).
Portfolio Construction Based on LSTM RNN and Black-Litterman Model: Evidence from Yahoo Finance
339
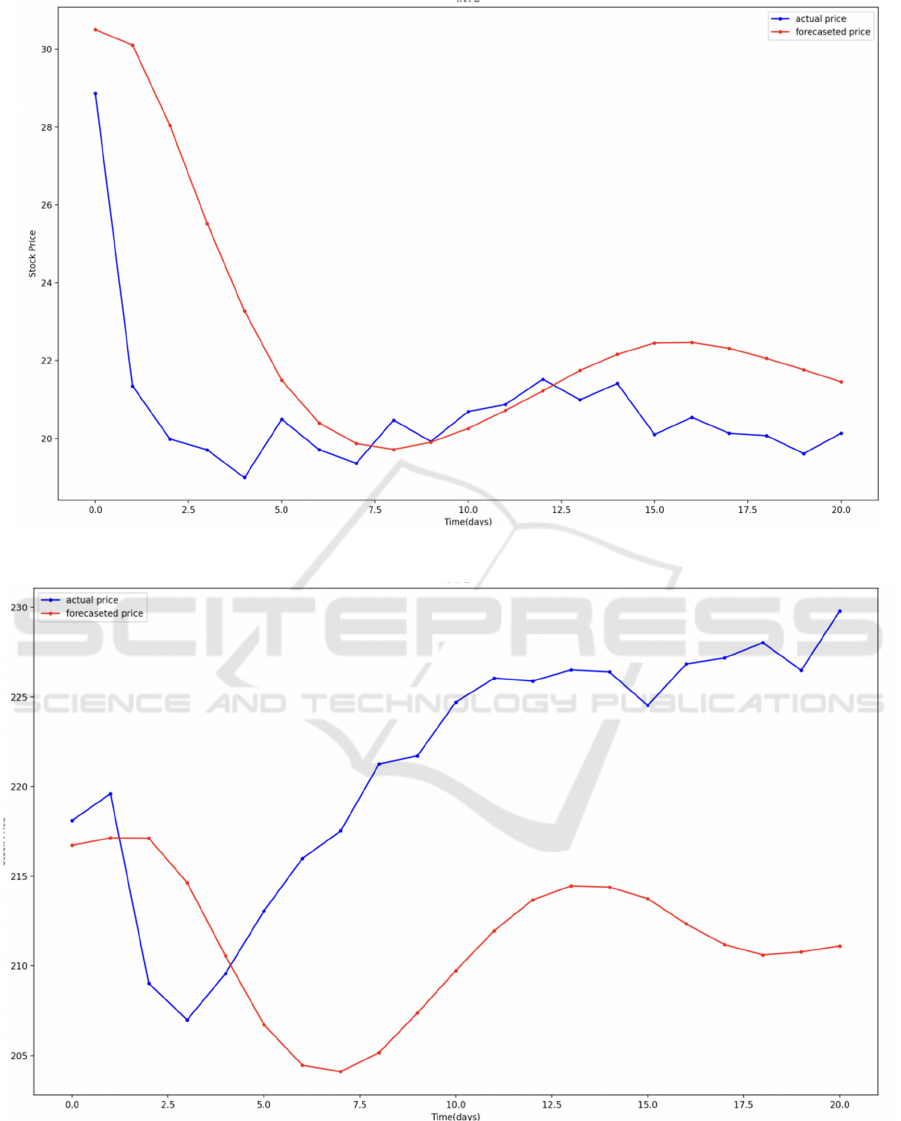
Figure 2: Results for Intel (Photo/Picture credit: Original).
Figure 3: Results for Apple (Photo/Picture credit: Original).
ECAI 2024 - International Conference on E-commerce and Artificial Intelligence
340
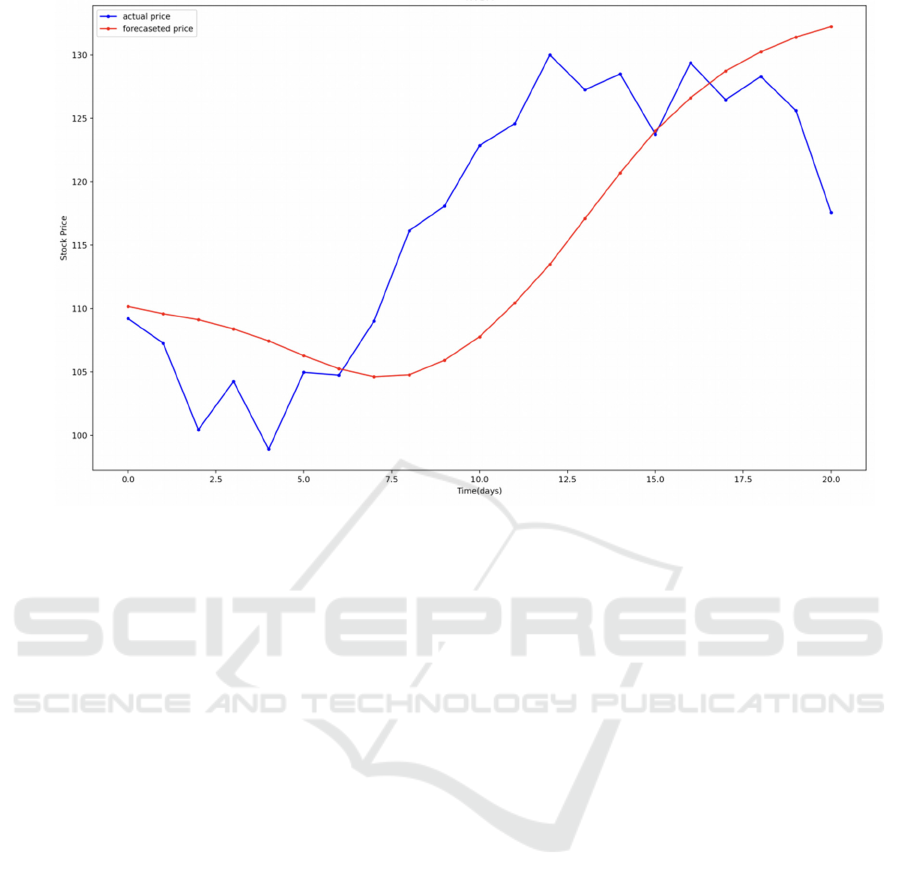
Figure 4: Results for NVIDIA (Photo/Picture credit: Original).
First of all, the results shown in Figures represents
for the LSTM RNN training results based on the
historical data from four corporations(Apple,
Microsoft, Intel, NVIDIA) from 2023.1.1 to 2024.8.1
and the prediction period is 30 days in August. The
blue fold line is the real time market trend while the
red one shows the forecast prices. Despite exhibiting
varying degrees of deviation and offset, the LSTM
model was well learned from the past market situation
and performed approximately similar trend lines as it
could be seen from the chart. Further correction and
modification against these deviations and bias ought
to be taken into consideration. Next, one views and
the Omega matrix are constructed as the confidence
and the uncertainty. The prediction from the LSTM
RNN would be treated as views on expected returns,
machine views in another word. The formats are as
follows:
𝑄
= Prediction Returns =
⎝
⎜
⎛
𝑟
𝑟
𝑟
𝑟
⎠
⎟
⎞
(5)
𝑄
=Investor View =
⎝
⎜
⎛
𝑟
𝑟
𝑟
𝑟
⎠
⎟
⎞
(6)
This study adds the investors’ views as Q2 to the
machine prediction and modify the proportion of each
views to combine and forms a integrated view as the
views Matrix Q. Together with the Omega matrix
constructed from the variance of each historical error,
one would apply it to the BL model to combine with
the LSTM predicted returns, weighted by the Omega
matrix. Finally, it Optimize Portfolio Using the
posterior expected returns, mean-variance
optimization are performed to build an optimized
portfolio. The analysis revealed that the LSTM model
exhibited a certain degree of bias and deviation in its
stock price predictions. The model consistently
overestimated or underestimated the actual stock
prices, leading to relatively high MAE and RMSE
values. Furthermore, the model's predictions showed
a tendency to deviate from the actual stock price
trends, particularly in the presence of sudden market
fluctuations or anomalies. These findings indicate
that the presence of bias and deviation can
significantly affect the accuracy and reliability of the
LSTM RNN for stock prediction.
The presence of bias and deviation in the LSTM
model's stock predictions has important implications
for its practical utility in financial markets. Inaccurate
predictions can lead to substantial financial losses for
investors and traders, and undermine the trust and
credibility of the model as well. Therefore, it is
crucial to mitigate bias and deviation in the model's
predictions through the use of advanced
Portfolio Construction Based on LSTM RNN and Black-Litterman Model: Evidence from Yahoo Finance
341

regularization techniques, feature engineering, and
data preprocessing methods. Additionally,
transparency and interpretability in the model's
decision-making process are essential for building
confidence in its predictions and insights.
The BL model provides a more realistic and
robust allocation of the portfolio by accounting for
both the market equilibrium and the subjective
opinions of the investor. The model enables a more
specialized and customized portfolio that is in line
with the investor's objectives and risk tolerance by
taking into account the investor's opinions. The
implication is that the portfolio generated using BL
model has a higher chance of fulfilling the demands
and expectations of the investor. After implementing
the BL model and generating the portfolio, we could
conducted a back test analysis to evaluate its
performance. The portfolio was compared to a
standard market benchmark to assess its risk-adjusted
returns and volatility. Additionally, this research
examined the portfolio's reaction to shifts in the
market as well as the effect of investor opinions on
portfolio allocation.
Combining the LSTM RNN predictions with the
Omega matrix from the BL model offers a novel
approach to portfolio optimization, but it is not
without limitations. One key limitation lies in the
estimation of the Omega matrix. The Omega matrix,
which represents the uncertainty in the LSTM
predictions, is often constructed using the variance of
prediction errors. However, accurately estimating
these variances can be demanding, especially in
volatile markets or when working with limited
historical data. Misestimation of the Omega matrix
could lead to overconfidence in the LSTM predictions,
resulting in sub-optimal portfolio allocations.
Another limitation is the inherent complexity of the
combined model. Integrating LSTM RNN predictions
into the Black-Litterman framework requires careful
calibration and understanding of both models'
mechanics. The complexity may make it difficult for
practitioners without advanced technical expertise to
implement and interpret the results correctly.
Moreover, the LSTM model, being a data-driven
approach, is highly dependent on the quality and
quantity of the input data. Inaccurate forecasts
resulting from inadequate or poor quality data can
impact views and ultimately the performance of the
portfolio. The computational demands of training
LSTM models and running the Black-Litterman
optimization are also non-trivial. These models
require significant computational resources,
particularly when working with sizable datasets or
asset-rich portfolios. This can be a barrier for smaller
institutions or individual investors with limited access
to high-performance computing resources.
Despite these limitations, the combination of
LSTM RNN predictions and the Omega matrix from
the Black-Litterman model holds significant potential
for future development. One promising area is the
refinement of the Omega matrix estimation.
Advanced methods could be explored to better
capture the uncertainty in the LSTM predictions (e.g.,
Bayesian approaches or machine learning techniques),
leading to more robust portfolio allocations. Another
prospect lies in enhancing the interpretability of the
combined model. A wider range of users may find the
model more approachable if more natural ways to see
and understand the relationships between the BL
model outputs and the LSTM predictions were
developed. Additionally, integrating alternative
machine learning models with the Black-Litterman
framework could be explored. Models like
Transformers or reinforcement learning-based
approaches might offer improvements in prediction
accuracy and decision-making under uncertainty.
Finally, as computational resources continue to
advance, the practical barriers to implementing
complex models like this one will diminish, making
it more feasible for a wider range of practitioners.
This could lead to broader adoption and further
refinement of the model in real-world portfolio
management scenarios, ultimately improving
investment outcomes in a dynamic and uncertain
financial environment.
4 CONCLUSIONS
To sum up, this study explores the integration of
LSTM RNN predictions with the BL model to
enhance portfolio optimization. Results demonstrate
that incorporating LSTM RNN predictions into the
BL model framework can mitigate biases and offer a
more refined approach to asset allocation. While the
LSTM model improves forecasting accuracy, it
introduces biases that require careful calibration. The
modified Black-Litterman model, combining
machine and investor views, provides a more tailored
portfolio allocation but demands significant
computational resources and expertise. Future
research could focus on refining the Omega matrix
estimation and exploring alternative machine
learning models to further improve robustness. This
research advances the understanding of combining
machine learning with traditional financial models,
offering a novel approach to enhance portfolio
ECAI 2024 - International Conference on E-commerce and Artificial Intelligence
342

management and decision-making in a dynamic
market environment.
REFERENCES
Ban, G. Y., El Karoui, N., Lim, A. E. B., 2016. Machine
learning and portfolio optimization. Management
Science, 2644.
Best, M. J., 2010. Portfolio optimization. CRC Press.
Black, F., Litterman, R., 1992a. Global portfolio
optimization. Financial Analysts Journal, 48(5), 28–43.
Black, F., Litterman, R., 1992b. The Black–Litterman
model explained. Journal of Asset Management, 11(3),
229–243.
Christensen, M. M., 2012. On the history of the growth-
optimal portfolio. Growth optimal portfolio, 3-30.
Fabozzi, F. J., Kolm, P. N., Pachamanova, D. A., Focardi,
S. M., 2007. Robust portfolio optimization and
management. John Wiley & Sons.
Gunjan, A., Bhattacharyya, S., 2023. A brief review of
portfolio optimization techniques. Artificial
Intelligence Review, 56, 3847–3886.
He, G., Litterman, R., 2002. The intuition behind Black-
Litterman model portfolios. Goldman Sachs Group, Inc.,
Quantitative Strategy Group; Kepos Capital.
Jorion, P., 1992. Portfolio optimization in practice.
Financial Analysts Journal, 48(1), 68–74.
Markowitz, H. M., 2019. The early history of portfolio
theory: 1600–1960. Financial Analysts Journal, 55(4),
5-16.
Selvin, S., Vinayakumar, R., Gopalakrishnan, E. A., Menon,
V. K., Soman, K. P., 2017. Stock price prediction using
LSTM, RNN and CNN-sliding window model. IEEE.
Walters, J., 2014. The Black-Litterman model in detail.
Boston University, Metropolitan College, Department
of Computer Science.
Portfolio Construction Based on LSTM RNN and Black-Litterman Model: Evidence from Yahoo Finance
343
