
Price Prediction of Ford Cars Applying Multiple Machine Learning
Methods
Yicheng Wang
a
School of Computer, Nanjing University of Information Science & Technology, Jiangsu, China
Keywords: Price prediction, Ford Motors, Machine Learning, eXtreme Gradient Boosting.
Abstract: The growing supply of used cars and lower prices compared with their counterparts make the used car market
highly competitive. Such a dynamic and sophisticated market underscores the necessity for accurate price
prediction, which is crucial for both buyers and sellers. Nowadays, the popularisation of online databases and
advanced machine learning techniques have made price prediction based on machine learning models an
obvious trend in the used car trading industry. This study delves into the performance evaluation of multiple
machine learning methods for predicting used Ford car prices. Utilizing a comprehensive dataset from Kaggle,
encompassing 17,966 entries with nine distinct features, the researcher employed a battery of regression
models, including linear regression (LR), decision tree (DT), random forest (RF) and eXtreme Gradient
Boosting (XGBoost). The approach involved rigorous feature engineering, model training and cross-
validation evaluation, employing Mean Squared Error (MSE), Mean Absolute Error (MAE), and R-squared
(𝑅
) as key performance indicators. The results indicate that XGBoost and RF surpass traditional models in
predictive accuracy, with XGBoost demonstrating the highest 𝑅
value of 0.9347. This study compares the
performance of several widespread models and offers practical implications for stakeholders seeking to
enhance transactional outcomes through data-driven pricing strategies.
1 INTRODUCTION
Ford Motors is the second largest automobile
manufacturer in the United States. Since 1903, the
company has launched countless iconic models like
Mustang, Bronco, Cortina and Transit. As the first
motor manufacturer that implements assembly lines
and vertical integration into industrial production,
Ford contributes a lot to the modern car industry
(Mead & Brinkley, 2003). Trusted quality and
moderate depreciation rate make used Ford cars
popular in the market.
Over the past few decades, the flourishing second-
hand car market has become a vibrant sector within
the automotive industry, offering consumers a
reasonably-priced alternative to a brand-new
counterpart. According to Edmunds, an online
resource that provides car buying information and
vehicle sales data, approximately 39 million used
vehicles were sold in the U.S. throughout the year
2021. Manheim, a global provider of vehicle
remarketing services, introduced Manheim Used
a
https://orcid.org/0009-0006-7569-6219
Vehicle Value Index to reflect the fluctuation of
America’s used car prices (Manheim, 2023). The
index showed an upward trend in price over the last
five years.
Accurate price prediction for used cars is not only
crucial for buyers seeking value but also essential for
sellers aiming to maximize their profits. As the
volume of transactions continues to grow, the
precision of used car pricing has garnered
considerable interest, prompting researchers to
pursue better performance of various predictive
models.
The complexity of the used car market requires
advanced and sophisticated analytical tools to
evaluate the fair value of vehicles based on multi-
dimensional factors. The manufacturer who produces
the vehicle, mileage, transmission and fuel economy
all contribute to the training process of machine
learning models. The application of data-driven
models has transformed the way prices are estimated,
moving from heuristic methods to evidence-based
approaches. Cui et al. (2022) discussed the integration
280
Wang, Y.
Price Prediction of Ford Cars Applying Multiple Machine Learning Methods.
DOI: 10.5220/0013214800004568
In Proceedings of the 1st International Conference on E-commerce and Artificial Intelligence (ECAI 2024), pages 280-285
ISBN: 978-989-758-726-9
Copyright © 2025 by Paper published under CC license (CC BY-NC-ND 4.0)

of machine learning algorithms in predicting used car
prices, which is vital in enhancing the accuracy and
efficiency of predictions.
Previous scholarly endeavours in the domain of
used car price prediction have primarily leveraged
models such as linear regression (LR), decision tree
(DT), and neural networks. LR models, despite their
simplicity, offer a baseline for understanding the
relationship between car attributes and their actual
price (Dahal, 2023). Jin (2021) constructed DT
models, including ensemble methods such as random
forest (RF) in their research. Ensemble models were
also widely applied due to their ability to deal with
feature interactions under non-linear correlations and
provided robust predictions. Neural networks,
particularly deep learning architectures, have
demonstrated remarkable potential in capturing
complex patterns, especially when applied to datasets
on a large scale (Huang et al., 2023).
The evolution of these models reflects the
growing need for more nuanced and dynamic pricing
strategies. However, the heterogeneity of used cars
and the rapid pace of technological advancements in
the automotive industry present ongoing challenges.
The quest for more accurate and efficient predictive
models continues, with recent studies exploring
ensemble methods and hybrid approaches that
combine the strengths of multiple algorithms.
The previous study has shown the necessity of
combining multiple regressors to better evaluate used
cars’ prices. This paper aims to evaluate the
performance of different regressors and discover
critical factors that influence used cars’ value. The
author will first introduce the dataset used during the
study, and then discuss the main methodologies and
techniques applied. At the end, the author will offer
an overview of the research and discuss limitations
and possible optimization methods.
2 DATASETS AND METHODS
2.1 Data Collection and Description
The dataset used in the research is obtained through
Kaggle. It highlights 9 features that might influence
the pricing procedure of used Ford vehicles. Those
features include the specific model of the car and its
production year, both of which depict the overall
price section of certain models. However, prices of
the same models vary significantly as each car has
different mileage, engine size, transmission, fuel
consumption and tax. The dataset collects detailed
information on 17,966 used Ford vehicles priced in
U.S. dollars. The introduction of characteristic
properties used during the research is shown in Table
1.
Table 1: Basic characteristic properties of the data.
ID Features T
yp
e
1 model object
2 yea
r
int64
3
p
rice int64
4 transmission o
bj
ect
5 milea
g
e int64
6 feulType o
b
ject
7 tax int64
8 m
p
g float64
9 en
g
ineSize float64
Among the features mentioned in Table 1,
transmission tells the researcher what kind of gearbox
the car is equipped with, including manual, semi-auto
and automatic. Mpg stands for mile per gallon, which
is an indicator of vehicle’s fuel economy. The figure
of engine size indicates how many litres the engine
has in swept volume.
To better carry out the following research, the
author first conducted the Exploratory Data Analysis
(EDA). The data chosen doesn’t have null values and
the size of duplicate records is relatively small.
However, it is worth noting that the distribution of
samples on model, transmission and fuel type is
highly imbalanced. To improve the performance of
models applied, the paper dealt with those rare data
through feature engineering.
2.2 Feature Engineering
Before model training, it is vital to ensure data quality
through data pre-processing. To optimize the
performance of selected models, the author processes
the data with the following steps. The first step is to
divide characteristic properties into two groups,
numerical and categorical. The classification standard
is slightly different from the ordinary one, that is the
researcher treats engine size and tax as categorical
features as they cluster at a few discrete values.
After grouping, the researcher focuses on rare data
among the categorical features. To reduce the
disturbance of those records, a threshold of 0.05 is set
in the paper. Features with a ratio less than 5% will
be added to a new group called “Other”. Figure 1
shows the distribution of values on 4 features,
including model, engine size, fuel type and tax. All
kinds of transmission options meet the threshold of
0.05 so it is not necessary to update the bar chart.
Price Prediction of Ford Cars Applying Multiple Machine Learning Methods
281
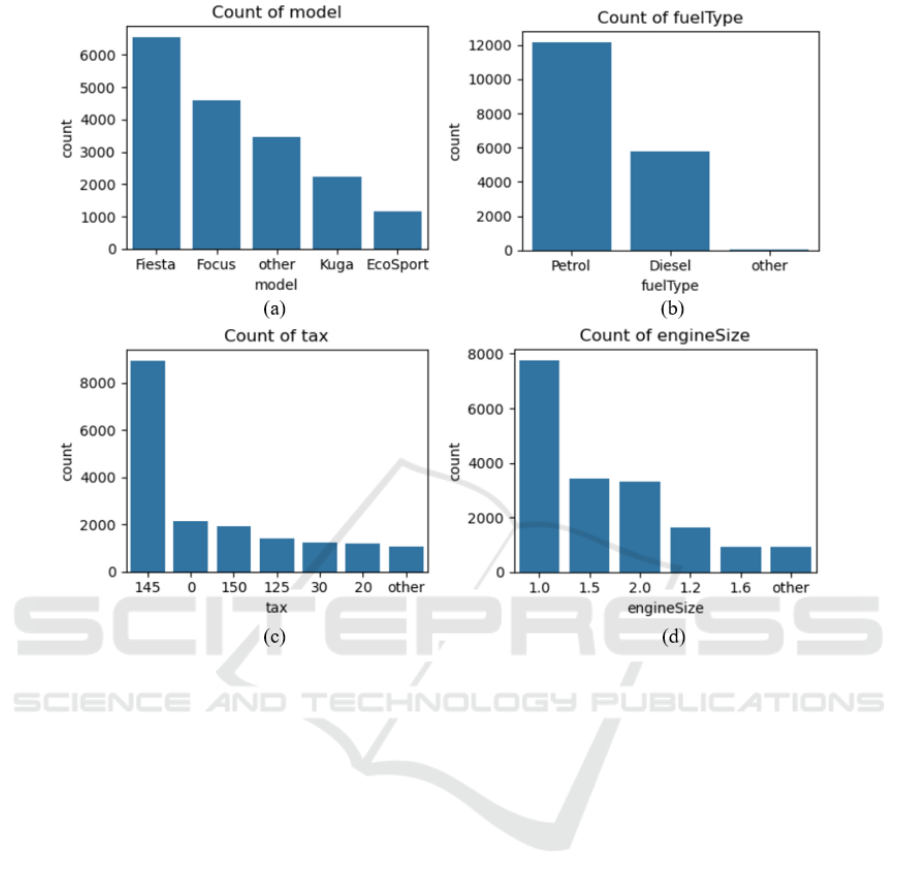
Figure 1: Distribution of values across selected features. (a) Distribution of Model types, (b) Distribution of Fuel types, (c)
Distribution of Tax, (d) Distribution of Engine Size (Photo/Picture credit: Original).
For each categorical feature f, this paper applies
functions to perform one-hot encoding. This function
converts the categorical feature into a series of binary
columns, where each column represents a category,
and each sample has only 1 in the corresponding
column, with 0s in all others. After the encoding
procedure, the author checked each option’s
correlation with the price tag of the vehicle. By
sorting them into descending order, the study dropped
three low-correlated features with an influence
coefficient below 0.05. As for the numerical features,
this study has found that none of the three features
follows normal distribution according to respective
count figures. In this case, it is essential to apply
scalers to reduce the size of evaluation metrics in the
following tests. This paper applies MinMaxScaler to
process corresponding values.
2.3 Linear Regression
Linear regression (LR) is a statistical methodology
employed to model the correlation between the
variable to be predicted and a set of independent
variables. It searches for the best-fitting line through
data points under the supposition that the variables
have linear correlations. The coefficient of
determination is used to gauge the strength of the
model, which is usually expressed as an equation. LR
is extensively employed in various domains for
forecasting, inference, and prediction.
2.4 Decision Tree & Random Forest
Decision Tree (DT) is a machine-learning algorithm
based on tree-like model to predict continuous
outcomes. It works by splitting the data into subsets
based on feature values, creating a tree of decisions
that ultimately yield a prediction. This method is
robust, easy to interpret, and capable of handling non-
linear relationships and feature interactions.
Random Forest (RF) is a versatile ensemble
learning method that effectively addresses regression
challenges by combining the predictions of multiple
decision trees (Fawagreh et al., 2014). It harnesses the
power of bagging (Bootstrap Aggregating) to
enhance the stability and accuracy of the model.
ECAI 2024 - International Conference on E-commerce and Artificial Intelligence
282

The training procedure of each tree involves
different bootstrap samples of the data and the model
makes its final prediction by averaging the individual
tree predictions, thereby reducing the variance and
preventing overfitting.
The algorithm incorporates randomness by
selecting a random subset of features to consider at
each split in the trees, which promotes diversity
among the trees and improves the model's
generalization capabilities. RF is particularly useful
for high-dimensional datasets and is known for its
robustness to outliers and noise.
In the research, the author applied early stopping
to select a suitable value for n_estimators, which
indicates the number of DT. Normally speaking,
implementing more DT enables the model to achieve
better performance. However, after the n_estimator
reaches the performance saturation point, adding
more trees to the ensemble no longer leads to
significant improvements in the model's predictive
performance. Early stopping assists the computer in
making the trade-off between computation time and
model's performance by stopping the optimization
process when the improvement is lower than the
significance threshold set before the evaluation.
2.5 Extreme Gradient Boosting
The eXtreme Gradient Boosting (XGBoost) is
another efficient ensemble method designed for
regression and classification tasks (Chen & Guestrin,
2016). It builds models in an additive manner by
focusing on minimizing a loss function through a
gradient-boosting framework. XGBoost employs a
tree-based approach, enhancing the predictive
accuracy by scaling the weak learners and adding
them to the final prediction. It also introduces
regularization to control overfitting, making it robust
for a wide range of data sets (Yang et al., 2023). With
its user-friendly interface and high performance,
XGBoost has become a go-to tool for data scientists
and machine learning practitioners in various
competitions and industries.
3 RESULTS AND DISCUSSION
3.1 Evaluation Metrics
The performance of selected models in this study was
assessed using Mean Squared Error (MSE), Mean
Absolute Error (MAE), and R-Square (𝑅
).
MSE is the average squared difference between
the estimated values and the actual values. The
formula for MSE is shown in Equation (1).
𝑀𝑆𝐸 =
1
𝑛
𝑌
−𝑌
1
In Equation (1), Y
stands for the actual value
while 𝑌
means predicted value. The character n is the
size of observations involved.
MAE measures the average magnitude of errors
among predictions without considering their
direction. Therefore, the figure is always non-
negative. The formula for MAE is shown in Equation
(2).
𝑀𝐴𝐸 =
1
𝑛
𝑌
−𝑌
2
𝑅
is a metric that indicates how effectively the
model is likely to predict future outcomes. It
demonstrates the proportion of the variance in the
dependent variable which can be predicted from the
independent variables. According to Chicco et al.
(2021), 𝑅
is capable of overcoming the
interpretability limitations of MSE and MAE. The
formula for 𝑅
is shown in Equation (3).
𝑅
=1−
∑
𝑌
−𝑌
∑
𝑌
−𝑌
3
3.2 Model Training
Before the author fits the data into the DT, LR is
applied to set a baseline, achieving an 𝑅
of 0.7779.
The result of DT significantly improves the
performance with the MSE in 8e-3, MAE in 0.0201
and 𝑅
in 0.8832.
To further optimize the performance of the model,
this study applies the method of Bootstrap
Aggregating by increasing the number of DT during
the predicting procedure. The approach has proved
effective in strengthening the model’s robustness and
preventing overfitting. To find a suitable number of
trees acquired, the researcher uses an iterative
algorithm that compares the cross-validation score
between two nearby rounds. The improvement
threshold is set at 0.1%, indicating that the algorithm
will stop after the model fails to reach the
improvement threshold for 5 consecutive tries. The
cross-validation score is calculated based on model’s
𝑅
figure. Eventually, the performance saturated after
22 trees. The 𝑅
figure reached 0.9222. Table 2
shows the performance evaluation of three regression
trained so far.
Price Prediction of Ford Cars Applying Multiple Machine Learning Methods
283

Table 2: Performance Evaluation of three regression.
ID Model
𝑀𝑆𝐸 𝑀𝐴𝐸
𝑅
1 Linear Regression 1.68e-3 0.0283 0.7779
2 Decision Tree 8.81e-4 0.0201 0.8832
3 Random Forest 5.86e-4 0.0166 0.9222
Table 3: Performance Evaluation of four regression.
ID Model
𝑀𝑆𝐸 𝑀𝐴𝐸
𝑅
CV Score
1 LR 1.68e-3 0.0283 0.7779 79.1941
2 DT 8.81e-4 0.0201 0.8832 87.9012
3 RF 5.86e-4 0.0166 0.9222 91.7158
4 XGBoost 4.93e-4 0.0152 0.9347 93.0520
Then researcher generates importance values of
different features by implementing functions of DT.
Among all the features, the top seven characteristic
properties show a higher correlation with the price of
used vehicles. Figure 2 demonstrates their important
value to the price of cars.
Figure 2: Top 7 features that influence vehicle pricing
(Photo/Picture credit: Original).
From Figure 2, it is obvious that consumers
consider production year as the most vital factor when
purchasing used vehicles, followed by engine size of
2.0 and mpg. The study also finds that consumers may
prefer an engine size of 2.0 to 1.2 or other options.
Ford Kuga generally has a higher price according to
both Figure 2 and the original dataset.
The study then trains the XGBoost model and
makes it continue to optimize its performance based
on the results of previous models. Yet the
improvement of the model will reach a bottleneck
where further optimization is less evident but time-
consuming. To avoid the situation, an early-stopping
algorithm is applied with the threshold set at 5 rounds.
The final iteration result indicates that the model
scores 0.9347 in 𝑅
. Figure 3 shows the change of
Root Mean Squared Error (RMSE) figure as iteration
grows.
Figure 3: RMSE value as the iteration grows (Photo/Picture
credit: Original).
Table 3 compares the performance of four
selected models. CV Score demonstrates their
performance on cross-validation accuracy judged by
the 𝑅
figure.
From the results shown above, it is obvious that
XGBoost outperforms its counterpart at the price
prediction of the given dataset. Closely followed by
RF. Despite its simplicity, LR still achieves a
moderate performance.
4 CONCLUSIONS
Tens of thousands of used vehicles are traded every
day around the world, making timely and accurate
ECAI 2024 - International Conference on E-commerce and Artificial Intelligence
284

price predictions essential to boost the efficiency and
profit of the industry. Therefore, applying machine
learning methods to assist participants with decision-
making is promising. This study offers insightful
information about used automobile pricing
predictions. Not only has it found the key features
which might affect the price of cars, but also shown
the preference of customers for those features. For
example, the importance values of various features
indicate that a 2.0-litre engine affects the price more
than its 1.2-litre counterparts. This study also
demonstrates the effectiveness of used car price
prediction based on machine learning methodology,
with XGBoost and RF showing superior
performance. The cross-validation scores indicate
that these models offer a high level of accuracy and
are capable of providing reliable price predictions for
used cars. However, the research has some limitations
at the present stage. Firstly, the car market is a
sophisticated system and the detailed information on
models involves complicated terms. The dataset
selected focused on a single manufacturer Ford and
simplified the issue. More work on data pre-
processing is acquired to predict data of a much larger
scale, such as annual domestic used car trading. Apart
from that, more features involved will inevitably lead
to the Multi-collinearity problem. In that case
additional machine learning methods need to be
implemented to handle that issue.
REFERENCES
Chen, T., Guestrin, C., 2016. XGBoost: A scalable tree
boosting system. arXiv preprint arXiv:1603.02754.
Chicco, D., Warrens, M. J., Jurman, G., 2021. The
coefficient of determination R-squared is more
informative than SMAPE, MAE, MAPE, MSE and
RMSE in regression analysis evaluation. PeerJ
Computer Science, 7, e623.
Cui, B., Ye, Z., Zhao, H., Renqing, Z., Meng, L., Yang, Y.,
2022. Used car price prediction based on the iterative
framework of XGBOOST + LightGBM. Electronics,
11(18), 2932.
Dahal, R., 2023. Used car price prediction using Linear
regression. https://www.researchgate.net/publication/
375697258_Used_car_price_prediction_using_Linear
_ regression.
Fawagreh, K., Gaber, M. M., Elyan, E., 2014. Random
forests: from early developments to recent
advancements. Systems Science & Control
Engineering, 2(1), 602–609.
Huang, J., Saw, S. N., Feng, W., Jiang, Y., Yang, R., Qin,
Y., Seng, L. S., 2023. A Latent Factor-Based Bayesian
Neural Networks Model in Cloud Platform for Used
Car Price Prediction. IEEE Transactions on
Engineering Management, 1–11.
Jin, C., 2021. Price prediction of used cars using machine
learning. In 2021 IEEE International Conference on
Emergency Science and Information Technology
(ICESIT) (pp. 223-230). Chongqing, China.
https://doi.org/10.1109/ICESIT53460.2021.9696839.
Manheim., 2023. Summary Methodology for Manheim
Used Vehicle Value Index. https://site.manheim.
com/wp-content/uploads/sites/2/2023/07/Used-
Vehicle-Summary-Methodology.pdf.
Mead, W. R., Brinkley, D., 2003. Wheels for the World:
Henry Ford, his Company, and A Century of Progress,
1903-2003. Foreign Affairs, 82(5), 176.
Yang, Q., He, K., Zheng, L., Wu, C., Yu, Y., Zou, Y., 2023.
Forecasting crude oil futures prices using Extreme
Gradient Boosting. Procedia Computer Science, 221,
920–926.
Price Prediction of Ford Cars Applying Multiple Machine Learning Methods
285
