
Predicting the U.S. Stock Market Index Using LSTM with Different
Financial Factors
Tingxi Zhang
a
Shenzhen Audencia Financial Technology Institute, Shenzhen University, Guangdong, China
Keywords: Index Prediction, Long Short-Term Memory, Financial Factors.
Abstract: The complexity and dynamic nature of financial markets demand advanced tools for accurate forecasting.
This is vital for investors, portfolio managers, and policymakers to make informed decisions regarding asset
allocation and risk management. This study explores the potential of Long Short-Term Memory (LSTM)
networks in predicting the S&P 500 index, augmented by a diverse set of financial factors including the Cboe
Volatility Index (VIX), Effective Federal Funds Rate (EFFR), U.S. Dollar Index (USDX), and various U.S.
Treasury rates. The research employs an approach involving data collection spanning from June 2010 to June
2023, preprocessing to ensure data suitability, and LSTM model development tailored to capture long-term
dependencies. This article starts from two tasks, classification and regression, and focuses on predicting the
S&P 500 index across varying time horizons. The study reveals that LSTM models augmented with relevant
financial factors effectively predict short-term movements in the S&P 500 index, with low Root Mean Square
Error (RMSE) and Mean Absolute Error (MAE) values for 1-day predictions. However, prediction errors
increase significantly for longer horizons, particularly for variables highly sensitive to market volatility and
interest rate changes. The findings contribute to developing more accurate forecasting tools for the financial
industry, enhancing decision-making capabilities for various stakeholders.
1 INTRODUCTION
Expanding the potential of Long Short-Term Memory
(LSTM) networks in predicting the S&P 500,
research delves into the intricacies of applying this
model & rationale for selecting financial factors (Lee
& Kang, 2020). As a subclass of Recurrent Neural
Networks (RNNs), LSTMs overcome vanishing
exploding gradient issues, enabling them to retain
past information effectively, ideal for capturing
complex, nonlinear relationships and long-term
dependencies in financial data (Wang et al., 2022).
Integrating factors like the Cboe Volatility Index
(VIX), Effective Federal Funds Rate (EFFR), U.S.
Dollar Index (USDX), and U.S. Treasury rates
enhances predictive power. VIX insights into investor
sentiment & market volatility aid in capturing
sentiment impacts during uncertainty. EFFR, a
monetary policy tool, influences borrowing costs and
stock market movements. USDX reflects currency
fluctuations, impacting international competitiveness
and stock prices (Bhandari et al., 2022). Treasury
a
https://orcid.org/0009-0004-7252-6834
rates offer insights into interest rates, economic
growth, and inflation expectations, which are crucial
for investment and financing decisions.
This research aims to improve S&P 500
forecasting accuracy for investors, managers, and,
policymakers. Accurate forecasts inform asset
allocation, risk management, & policy formulation.
LSTM's pattern recognition & long-term dependency
capture enable insights into U.S. equity market trends
(Michańków et al., 2022).
Experimental approaches include data collection,
preprocessing (cleaning, normalization, feature
engineering), model development, and evaluation are
used. Focusing on 1-day, 5-day, and 20-day forecasts,
models undergo rigorous testing with regression
(Root Mean Square Error (RMSE), Mean Absolute
Error (MAE)) and classification (confusion matrix)
metrics. This aims to develop models accurately
forecasting S&P 500 changes and classifying market
movements, guiding investments, risk management,
and policy.
Zhang, T.
Predicting the U.S. Stock Market Index Using LSTM with Different Financial Factors.
DOI: 10.5220/0013214300004568
In Proceedings of the 1st International Conference on E-commerce and Artificial Intelligence (ECAI 2024), pages 251-256
ISBN: 978-989-758-726-9
Copyright © 2025 by Paper published under CC license (CC BY-NC-ND 4.0)
251

2 LITERATURE REVIEW
The literature concerning utilizing machine learning
and deep learning methodologies for forecasting
stock market trends is continually expanding and
advancing. Early studies employed traditional
statistical methods like Autoregressive Integrated
Moving Average (ARIMA) models and exponential
smoothing techniques (Vo & Ślepaczuk, 2022).
However, these approaches struggled to capture the
nonlinearities and complexities inherent in financial
time series.
With the advent of artificial neural networks,
researchers began exploring their potential for stock
market forecasting. While standard feedforward
neural networks showed some promise, they were
limited by their inability to handle sequential data
effectively. In 2009, an extensive review
encompassing over 100 scholarly articles by the
authors revealed that neural networks (NNs)
demonstrate a superior capacity for enhancing market
forecasting when juxtaposed against conventional
methodologies (Atsalakis & Valavanis, 2009). This
finding underscores the potential advantages of
adopting NNs in predictive analytics within the
market context. Exploring the Influence of Financial
Ratios and Technical Analysis on Stock Price
Forecasting Leveraging Random Forests,with an
Emerging Trend in AI-assisted and Human Insight-
Integrated Prediction Frameworks (Pramod & Pm,
2020).
The introduction of RNNs, and subsequently
LSTM networks, revolutionized the field by enabling
the models to retain information from previous time
steps, making them particularly suited for time-series
analysis. Several studies have utilized LSTM
networks for stock market prediction, demonstrating
their effectiveness in capturing the dynamic behavior
of stock prices and indices. These models have been
found to outperform traditional statistical and even
other machine learning methods in predicting stock
market trends. Besides using some financial news,
economic indicators, or sentiment data from social
media (Vargas et al., 2017), the inclusion of financial
factors as input features has further enhanced the
predictive accuracy of LSTM models, as they provide
a more comprehensive view of the market's
underlying dynamics. In particular, the VIX index, as
a measure of market uncertainty and expected
volatility, has been widely used in stock market
forecasting models (Roszyk & Ślepaczuk, 2024). Its
predictive power stems from its ability to capture
investor sentiment and risk appetite, which are crucial
factors influencing stock prices. The EFFR, a key
interest rate that influences the cost of borrowing and
lending, also holds considerable sway in shaping the
overall economic well-being and, consequently, the
performance of the stock market (Bhandari et al.,
2022).
Similarly, the USDX and U.S. Treasury rates are
essential indicators of the dollar's strength and the
country's debt market conditions, respectively. Their
inclusion in stock market prediction models provides
valuable insights into global macroeconomic trends
and their potential impact on the U.S. equity market.
By synthesizing the insights from previous
research and incorporating a diverse set of financial
factors, this study aims to advance the field of stock
market prediction using LSTM networks and
contribute to a more nuanced understanding of the
relationships between these factors and the S&P 500
index.
3 DATA AND METHOD
3.1 Dataset Introduction
This study employs a comprehensive methodology to
forecast the future value of the S&P 500 index using
daily market data and various financial factors. The
dataset, sourced from Kaggle, spans from June 29,
2010, to June 27, 2023, encompassing 3271 days of
information. It includes closing prices for the S&P
500 index, alongside selected financial indicators
such as the VIX, EFFR, USDX, and a range of U.S.
Treasury rates.
Data processing begins with acquiring the daily
S&P 500 market data and relevant financial factors,
followed by data cleaning to rectify errors,
standardize date formats, and filter for the desired
date range. The cleaned datasets are then integrated
into a single CSV file. Before analysis, preprocessing
steps include feature scaling using MinMaxScaler to
normalize values between 0 and 1, merging processed
feature columns with the target column into a
DataFrame, defining key parameters such as
timesteps and forecast horizon, and converting the
DataFrame into a NumPy array for integration into
the model. Then preprocessed data is partitioned into
training and testing sets at an 80:20 ratio for model
evaluation.
ECAI 2024 - International Conference on E-commerce and Artificial Intelligence
252

3.2 Method
3.2.1 Algorithm
LSTM is a specialized RNN, that utilizes gates and a
cell state to alleviate gradient issues in long
sequences, enabling it to capture long-term
dependencies. It has the advantage of long-term
memory capacity in requiring sequence prediction.
The core of the model is an LSTM layer that
processes the input sequence. In this case, the hidden
size is set to 128 and there are 3 layers. The batch first
parameter is set to True to indicate that the input
tensor's first dimension corresponds to the batch
size. This layer is used to capture the temporal
dependencies within the input sequence. Following
the LSTM layer, a linear layer is used as the Fully
Connected Layer (FC) to map the output of the LSTM
to the desired output size, which corresponds to the
forecast horizon in this case. The output of the LSTM
layer's last time step is passed through this layer to
produce the final predictions. During the forward
pass, the LSTM layer initializes its hidden state (h0)
and cell state (c0) to zero tensors of appropriate sizes,
ensuring that the model's initial state is clean for each
new input sequence (Mehtab et al., 2021).
3.2.2 Parameter Introduction
In this work, the input size is different for two types
of groups. For the blank group (only Close price), it
is set to be 2; for the experimental group, it is set to
be 3. Then the hidden size is fixed at 128, balancing
model complexity and computational efficiency.
Three layers are stacked to capture intricate temporal
patterns in the input sequence. The output size
corresponds to the forecast horizon, tailored to the
specific prediction task.
Adam optimizer is used and the learning rate is
chosen to be 0.001 for the complexity of the data.
Then Mean Squared Error (MSE) is used to be the
Loss Function. There are 300 epochs to ensure
thorough training and performance monitoring. The
model with the lowest test loss is chosen to prevent
overfitting and ensure good generalization as the best
model.
3.2.3 Evaluation
In this work, the evaluation is RMSE and MAE for
the regression part and accuracy for the classification
part. The regression is evaluated by using the RMSE
and MAE to the changing value but not the index
value itself between the predicted value and real value.
Then a threshold of 0 is applied to define binary labels
(Decrease or Increase) based on changes in the target
variable (Ding & Qin, 2020). After that, classification
performance is evaluated using accuracy. Also, a
classification report and a confusion matrix can help
to further evaluate the model. (For example, if the
recall of increase or decrease is lower than 0.5, the
accuracy of this group will be marked in italic in
Table 4). The assessment metrics give a further
insight into the efficacy of the model, highlighting
areas for improvement and ensuring its practical
significance in investment prediction.
4 EXPERIMENTAL RESULTS
4.1 Model Performance
This model's performance exhibits notable variations
across diverse time horizons and financial indicators.
After predicting, the figure of the target (S&P500
index) value and the change of target value can be
drawn. The input is the target and different features
that vary from groups. After using the model
mentioned above, a regression evaluation can be used
and the output is shown in the pictures. All the
pictures in Figure 1 show the best model in their
horizon. The regression evaluation metrics are
calculated by the change value of the predicted value
and the true value of the target (Avoiding evaluating
the index value itself). The RMSE and MAE metrics
offer valuable insights into the predictive prowess of
this model. Table 1 and Table 2 show the results of
RMSE and MAE.
Table 1: RMSE of the change value in different groups.
RMSE blank USDX EFFR VIX US30Y US20Y US10Y US7Y
1-day 47.7831 48.7075 47.9827 49.3035 47.8874 47.8192 47.9292 48.1814
5-day 92.2823 95.7983 91.9878 99.1853 157.5846 133.8851 152.5618 126.2125
20-day 183.9919 173.7341 302.0017 188.2947 396.0349 296.6774 758.4307 571.4574
RMSE US5Y US3Y US2Y US1Y US6M US3M US1M
1-day 48.3179 47.9508 47.7837 47.4222 47.5952 48.1978 47.7664
5-day 168.6958 136.6147 151.8824 136.541 110.0165 117.7768 96.0132
20-day 389.5934 426.5298 398.0085 261.923 301.5459 314.9735 299.2177
Predicting the U.S. Stock Market Index Using LSTM with Different Financial Factors
253
(a) (b)
(c) (d)
(e) (f)
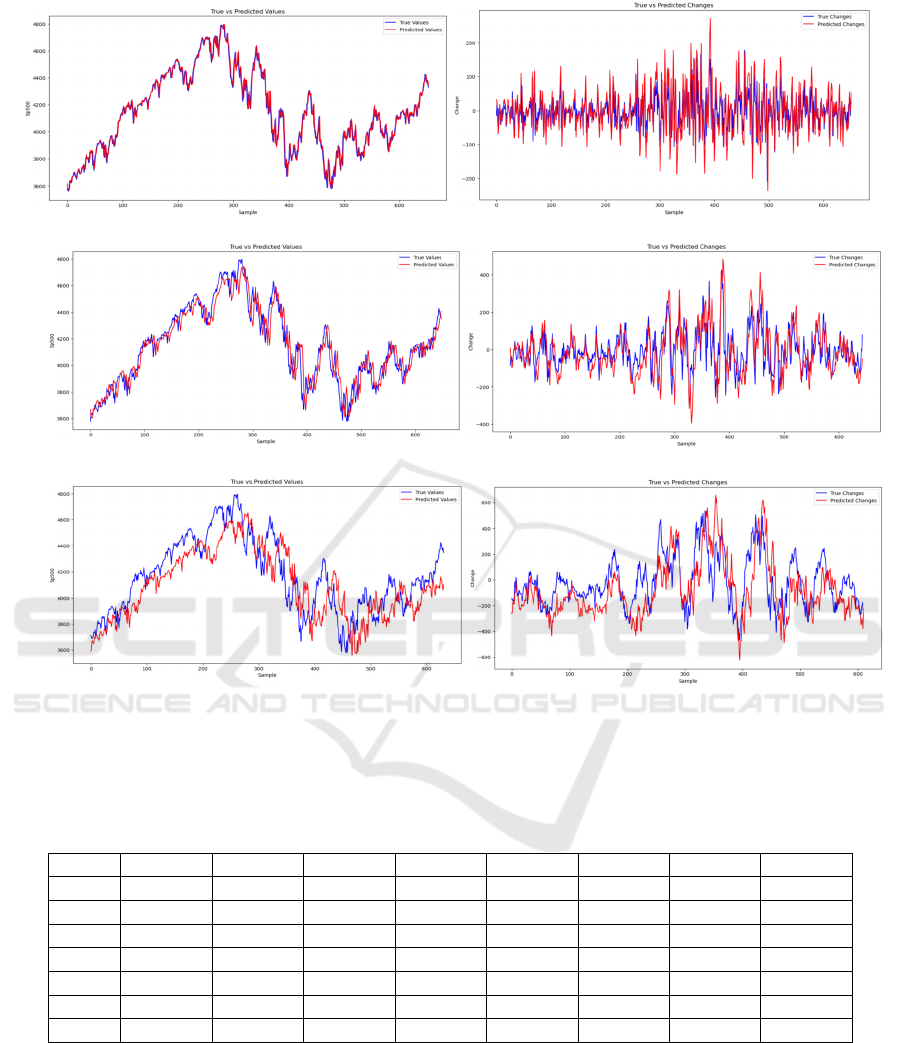
Figure 1: Figure of regression. (a) is True vs Predicted values of 1-day horizon (Close+US1Y), (b) is True vs Predicted
changes of the 1-day horizon (Close+US1Y), (c) is True vs Predicted values of the 5-day horizon (Close), (d) is True vs
Predicted changes of the 5-day horizon (Close), (e) is True vs Predicted values of the 20-day horizon (Close+USDX), (f) is
True vs Predicted changes of the 20-day horizon (Close+USDX) (Photo/Picture credit : Original).
Table 2: MAE of the change value in different groups.
MAE blank USDX EFFR VIX US30Y US20Y US10Y US7Y
1-day 36.2807 36.2915 35.9285 37.6879 36.0179 35.9536 36.0336 36.3091
5-day 71.0963 72.8989 70.2543 77.3336 132.9187 111.5851 127.9587 103.846
20-day 148.1766 139.2767 256.1971 143.1215 346.526 250.634 718.5778 523.7565
MAE US5Y US3Y US2Y US1Y US6M US3M US1M
1-day 36.4255 36.3041 36.0454 35.6879 35.7133 36.3581 35.8566
5-day 143.9013 112.3368 124.6026 110.7712 86.4111 93.9518 74.5086
20-day 348.5007 384.4366 339.1228 223.5755 259.2718 268.1143 261.8683
4.1.1 RMSE Analysis
1-Day Prediction RMSE: The RMSE values for 1-day
predictions are generally low, ranging from 47.4222
for the 1-month U.S. Treasury yield (US1Y) to
49.3035 for the Volatility Index (VIX). The model
demonstrates its proficiency in effectively capturing
short-term fluctuations in a wide array of financial
indicators.
5-Day Prediction RMSE: As the prediction
horizon increases to 5 days, the RMSE values
increase significantly, particularly for longer-term
interest rates (e.g., US30Y: 157.5846, US20Y:
133.8851) and the VIX (99.1853). This highlights the
ECAI 2024 - International Conference on E-commerce and Artificial Intelligence
254

model's difficulty in accurately predicting longer-
term trends, especially for volatile indicators.
20-Day Prediction RMSE: For 20-day
predictions, the RMSE values surge even further,
with the highest value recorded for the 10-year U.S.
Treasury yield (US10Y) at 758.4307. This
emphasizes the model's limited ability to anticipate
trends over extended periods, particularly for highly
sensitive indicators.
4.1.2 MAE Analysis
1-Day Prediction MAE: Similar to RMSE, 1-day
MAE values are relatively low, ranging from 35.6879
for US1Y to 37.6879 for VIX. This underscores the
model's effectiveness in short-term forecasting.
5-Day Prediction MAE: The MAE values
increase for 5-day predictions, particularly for interest
rates and VIX, indicating larger average prediction
deviations over a longer horizon. However, the
increases are less pronounced compared to RMSE,
suggesting MAE may be a more stable metric for
assessing prediction performance.
20-Day Prediction MAE: For 20-day predictions,
MAE values continue to rise, with the highest being
718.5778 for US10Y. This trend aligns with the
RMSE analysis, confirming the model's reduced
accuracy in long-term forecasting.
4.2 Classification Results
After using a threshold of 0 to define binary labels
(Decrease or Increase) based on changes in the target
variable, the accuracy and classification report can be
shown. Although the best model has the highest
accuracy, the RMSE and MAE may not be the lowest
but their value is fairly low compared with other
groups (The classification report of the best model in
different forecast horizons is shown in Table 3.
According to the result of each group, the
accuracy is shown in Table 4 while some values are
marked in italic because in this group the recall of
increase type or decrease type is lower than 0.5 which
does not have realistic investment meanings.
1-Day Accuracy: For 1-day predictions, the
highest accuracy of 0.7730 is observed for US1Y,
followed closely by the USDX and several other yield
curves. This suggests that the model performs best in
predicting short-term market movements, particularly
for the 1-month Treasury yield.
5-Day Accuracy: In the 5-day forecasts, the
accuracy decreases significantly across all indicators,
with the lowest scores observed for the longer-term
Treasury yields (US30Y, US20Y, and US10Y). This
decline indicates that predicting market movements
over a longer horizon (5 days) introduces more
uncertainty and complexity, leading to reduced
accuracy.
However, the 1-month Treasury yield again
shows relatively higher accuracy (0.736),
highlighting the model's potential for short-term
predictions.
20-Day Accuracy: For the 20-day forecasts, the
accuracy levels are further diluted, with most
indicators falling below 0.7. The highest accuracy of
0.7774 is recorded for USDX, suggesting a somewhat
stable performance for the currency index over a
longer period. However, the significant drops in
accuracy for the yield curves indicate that predicting
longer-term market trends is challenging.
Table 3: Best model in different forecast horizon.
1 day (Close+US1Y) 5 days (Close) 20 days (Close+USDX)
precision recall f1 precision recall f1 precision recall f1
Decrease 0.79 0.74 0.76 Decrease 0.74 0.7 0.72 Decrease 0.82 0.56 0.67
Increase 0.76 0.8 0.78 Increase 0.78 0.81 0.8 Increase 0.76 0.92 0.83
accuracy 0.77 accuracy 0.76 accuracy 0.78
Table 4: Accuracy of each group.
accuracy blank USDX EFFR VIX US30Y US20Y US10Y US7Y
1-day 0.7623 0.7699 0.7638 0.7638 0.7699 0.7669 0.7623 0.7623
5-day 0.764 0.7593 0.7236 0.7345 0.6848 0.6863 0.6863 0.6957
20-day 0.7641 0.7774 0.7021 0.7643 0.6825 0.7038 0.6105 0.6301
accuracy US5Y US3Y US2Y US1Y US6M US3M US1M
1-day 0.7638 0.7638 0.7638 0.773 0.7653 0.7623 0.7592
5-day 0.6491 0.6941 0.6817 0.6879 0.7283 0.7236 0.736
20-day 0.6432 0.6694 0.653 0.7021 0.7021 0.7087 0.6939
Predicting the U.S. Stock Market Index Using LSTM with Different Financial Factors
255

5 LIMITATIONS AND FUTURE
OUTLOOKS
The present study, while demonstrating the potential
of LSTM networks in predicting the S&P 500 index
with the augmentation of financial factors, is not
without its limitations. One key limitation lies in the
reliance on a simple LSTM architecture. As the
financial forecasting landscape evolves rapidly,
exploring alternative LSTM variants, such as stacked
or bidirectional LSTMs, or hybrid architectures
combining LSTMs with CNNs or attention
mechanisms, could potentially enhance predictive
capabilities. Additionally, the evaluation framework,
utilizing RMSE, MAE, and classification accuracy,
provides valuable insights but may be further refined
by incorporating metrics like R-squared for
regression or F1-score for imbalanced classification
problems.
Looking ahead, the dynamic nature of financial
markets necessitates mechanisms for model
retraining and adaptation to maintain predictive
accuracy over time. Continuous monitoring of market
dynamics and regular updating of model parameters
are crucial. Moreover, there may be other relevant
variables, such as financial news, economic
indicators, or sentiment data from social media, that
could be incorporated to improve predictive
power. Future research should aim to address these
limitations by exploring alternative architectures,
refining evaluation metrics, incorporating additional
data sources, and implementing mechanisms for
continuous model updating.
6 CONCLUSIONS
This study has shown the potential ability of LSTM
networks to predict the S&P 500 index, particularly
when augmented with financial factors. The findings
underscore the effectiveness of LSTM models in
capturing short-term market fluctuations, evidenced
by their relatively low RMSE and MAE values for 1-
day predictions. However, as the study also
highlights, predicting longer-term trends remains a
challenge, with errors increasing for 5-day and 20-
day horizons, especially for variables sensitive to
market volatility and interest rate changes. Looking
toward the future, it is crucial to acknowledge that the
dynamic nature of financial markets necessitates
ongoing efforts to maintain predictive accuracy. This
includes exploring alternative LSTM variants and
hybrid architectures, refining evaluation metrics,
incorporating additional information sources
encompassing financial updates, economic metrics,
and public opinion reflected on social media
platforms, and implementing mechanisms for
continuous model updating and adaptation. By
addressing these limitations and harnessing the full
potential of LSTM networks, the model can further
enhance the ability to forecast the S&P 500 index
while providing valuable insights for investors,
portfolio managers, policymakers, and so on.
REFERENCES
Atsalakis, G. S., Valavanis, K. P., 2009. Surveying stock
market forecasting techniques–Part II: Soft computing
methods. Expert Systems with applications,36(3),
5932-5941.
Bhandari, H. N., Rimal, B., Pokhrel, N.R., Rimal, R.,
Dahal, K. R., & Khatri, R. K., 2022. Predicting stock
market index using LSTM. Machine Learning with
Applications,9, 100320.
Ding, G., Qin, L., 2020. Study on the prediction of stock
price based on the associated network model of LSTM.
International Journal of Machine Learning and
Cybernetics, 11(6), 1307-1317.
Lee, J., Kang, J., 2020. Effectively training neural networks
for stock index prediction: Predicting the S&P 500
index without using its index data. PloS one, 15(4),
e0230635.
Michańków, J., Sakowski, P., Ślepaczuk, R., 2022. LSTM
in algorithmic investment strategies on BTC and
S&P500 index. Sensors, 22(3), 917.
Mehtab, S., Sen, J., Dutta, A., 2021. Stock price prediction
using machine learning and LSTM-based deep learning
models. In Machine Learning and Metaheuristics
Algorithms, and Applications: Second Symposium,
SoMMA 2020, Chennai, India, October 14–17, 2020,
Revised Selected Papers 2 (pp.88-106). Springer
Singapore.
Pramod, B. S., Pm, M. S., 2020. Stock price prediction
using LSTM.Test Engineering and Management, 83,
5246-5251.
Roszyk, N., Ślepaczuk, R., 2024. The Hybrid Forecast of
S&P 500 Volatility ensembled from VIX, GARCH and
LSTM models.arxiv preprint arxiv:2407.16780.
Vargas, M. R., De Lima, B. S., Evsukoff, A. G., 2017. Deep
learning for stock market prediction from financial
news articles. In 2017 IEEE international conference on
computational intelligence and virtual environments for
measurement systems and applications (CIVEMSA)
(pp. 60-65). IEEE.
Vo, N., Ślepaczuk, R., 2022. Applying hybrid ARIMA-
SGARCH in algorithmic investment strategies on
S&P500 index. Entropy, 24(2), 158.
Wang, C., Chen, Y., Zhang, S., Zhang, Q., 2022. Stock
market index prediction using deep Transformer model.
Expert Systems with Applications, 208, 118128.
ECAI 2024 - International Conference on E-commerce and Artificial Intelligence
256
