
Hybrid Deep Learning Model for Stock Price Prediction: Evidence
from Guizhou Moutai Stock
Jingyi Lu
School of Electronics Engineering and Computer Science, Peking University, Beijing, China
Keywords: Hybrid Deep Learning, Stock Price Prediction, CNN, BiLSTM, Attention Mechanism.
Abstract: Research on stock price prediction has been increasingly important, particularly as financial markets get more
complicated. This study evaluates the execution of various hybrid deep learning models for stock price
prediction using data from Guizhou Moutai, a leading Chinese company, from January 5, 2015, to September
6, 2024. The models compared include MLP, RNN, CNN, LSTM, BiLSTM, CNN-LSTM, CNN-BiLSTM
and CNN-BiLSTM-AM. In contrast to alternative approaches, the CNN BiLSTM-AM method is better suited
for stock price prediction and offers investors a dependable means of making stock investing selections. CNN,
BiLSTM, and AM make up this technique. It achieves the lowest RMSE (21.273) and MAPE (0.944%) while
maintaining the highest R² value (0.9580), highlighting its superior predictive accuracy. This study provides
a more reliable tool for data-driven decision-making in the financial market, which not only helps improve
the accuracy of investors' decisions, but also encourages the use of deep learning in the finance industry.
Furthermore, this study offers a valuable reference for further investigations into maximizing model
performance, cutting down on computational expenses, and integrating external macroeconomic variables.
1 INTRODUCTION
The stock market is seen to be a good indicator of the
financial and economic health of a nation. The 1990s
saw the establishment of the Chinese stock market.
However, the Chinese stock market is comparable to
the Western one in terms of size and structure. One of
the most significant things for investors is the stock
trend. Stock price fluctuations are seldom linear.
Predicting future movements in stock prices has
always been important to economists (Xiao et al,
2020; Yu & Yan, 2020). The risk of investment will
be greatly decreased if the prediction is considerable
and accurate. In order to maximize revenue, the
investor will adjust their approach based on the
anticipated stock price.
Stock price prediction has been a key area of
financial research for many decades. The early
models like ARMA and ARIMA very good at
expressing linear relationships and are widely used
for their simplicity and interpretability (Box &
Jenkins, 1970). However, they can’t explain the
nonlinear and volatile nature of financial markets. As
the financial system becomes more and more
complex, the need for high-level models becomes
increasingly evident. In the late 20th century, the
crucial change in stock forecasting arrived with the
development of machine learning. Neural networks,
particularly feedforward networks, have been among
the earliest machine learning models employed to
model complex, nonlinear relationships in various
domains, including financial data (Haykin, 1999).
With the increase in computing ability and the
popularity of huge datasets, researchers began to
explore deep learning models. For example, one can
use CNN to capture features from the data. LSTM can
avoid the gradient vanishing or gradient explosion
problems caused by RNN. BiLSTM is a good method
to discover the interdependency of time series data.
AM can measure the effect of historical feature states
of time series data on the price of stocks.
Recently, Machine Learning has witnessed the
advancement of increasingly intricate stock
prediction techniques. The combination of the
attention mechanism (AM) and traditional neural
networks has attracted broad attention. Models can
perform better on tasks like machine translation by
focusing on the most important segments of the input
process thanks to the attention mechanism (Vaswani
et al, 2017). For example, the combination of CNN
with BiLSTM, enhanced by an attention mechanism,
has demonstrated increases in prediction accuracy by
Lu, J.
Hybrid Deep Learning Model for Stock Price Prediction: Evidence from Guizhou Moutai Stock.
DOI: 10.5220/0013214200004568
In Proceedings of the 1st International Conference on E-commerce and Artificial Intelligence (ECAI 2024), pages 243-250
ISBN: 978-989-758-726-9
Copyright © 2025 by Paper published under CC license (CC BY-NC-ND 4.0)
243

successfully capturing temporal relationships both
forward and backward (Qin et al, 2018). Despite these
improvements, there are still challenges, especially in
terms of balancing the complexity of the models and
calculating efficiency. While advanced models
improve predictive performance, they require
significant computational resources, limiting their
application in real-time scenarios (Luo & Zhang,
2022). Thus, the research should not only focus on the
improvement of accuracy but also emphasize
efficiency and practicability in the market condition.
The purpose of this research is to assess and
contrast several hybrid deep learning models for stock
price prediction. Assessing the models' performance
under identical conditions is crucial for the
development of learning models. This study aims to
conduct carry out a thorough analysis of eight distinct
models, ranging from simpler models to more
advanced models such as CNN, LSTM, and hybrid
models like CNN-LSTM, CNN-BiLSTM, and CNN-
BiLSTM-AM. The format of this document is as
follows. Sec. 2 outlines the data and techniques
employed in this research. This part introduces the
structure and functions of each model in detail. Sec. 3
compares the results of the models and provides a
detailed analysis of the results. This part highlights
the benefits and drawbacks of every model, discusses
the limitations, and suggests directions for future
work. Sec. 4 summarizes the conclusion of the study
and explains the research significance and future
expectations.
2 DATA AND METHOD
Lecun et al. proposed the CNN network model in
1998. CNN is a type of feed-forward neural network
with strong image and natural language processing
(NLP) capabilities. Time series prediction is one area
in which it works well (Wang et al, 2021; Zhang et al,
2023). CNN has several advantages. One of them is
that it canenhance the learning models' efficacy. This
is realized by lowering the quantity of variables
through weight sharing and local perception. CNN is
mainly composed of five parts: input layer,
convolutional layer, pooling layer, fully connected
layer, and output layer (Luo & Zhang, 2022). The
convolutional layer and pooling layer are essential
because they are in charge of feature extraction and
dimensionality reduction. There are several kernels in
each convolutional layer. They are used to operate on
the input data to extract features. The features of the
data are recovered after the convolution procedure.
On the other hand, the features could have fairly large
dimensions. To reduce the dimensionality and
training costs, a pooling layer is added after each
convolutional layer in order to address this issue. The
pooling layer then compress the feature map and keep
the most crucial information. This will increase the
efficiency and accuracy in tasks like time series
prediction and classification.This procedure can be
stated as follows:
lt=tanh(xt*kt+bt) (1)
where xt is the input vector, tanh is the activation
function, lt is the output value following convolution,
kt is the convolution kernel's weight, and bt is the
kernel's bias.
Hochreiter and Schmidhuber first proposed Long
Short-Term Memory networks (LSTM) in 1997 as a
Recurrent Neural Network (RNN) variant
(Hochreiter & Schmidhuber, 1997). LSTM is usually
used to deal with data with long-term dependencies,
such as time series, audio or text. LSTM employs a
gating unit mechanism to enhance the structure of the
concealed layer of RNN. As seen in Fig. 1, this
system is composed of three gates: the forget gate, the
input gate, and the output gate. The information that
has to be deleted from the model neuron is decided by
the forgetting gate. The unit state is updated by the
input gate. Additionally, the output gate controls the
neuron's output at the subsequent moment (Sun et al,
2022).
The outputs of the previous cell and the current
cell are shown in the figure as h(t-1) and ht,
respectively. The current unit's input is represented by
xt, its activation functions are σ and tanh, and the
arithmetic rules connecting the vectors are indicated
by the circles in Fig. 1. Ct is the current state of the
neuron. The forgetting threshold, ft, determines how
information should be discarded by the cell using the
σ activation function. The information that the σ
function needs to update is determined by the input.
The σ function then uses the tanh activation function
Ct to produce a new memory, eventually controlling
the amount of new information added to the neuronal
state (Lu et al, 2020).
Figure 1: LSTM memory cell (Photo/Picture credit:
Original).
ECAI 2024 - International Conference on E-commerce and Artificial Intelligence
244

AM was proposed by Treisman et al. in 1980
(Treisman & Gelade, 1980). The AM theory
optimizes conventional models by selecting
important input from a vast amount of data and
emphasizing it. The primary idea stems from how
people pay attention to images. Human vision can
rapidly identify the important regions and concentrate
on them to gather data. In a similar vein, AM
selectively attends to and disregards less crucial
information. Typically, the AM calculating method is
broken down into three steps:
Step 1: Determine the correlation or similarity
between the input and output features using:
st=tanh(Whht+bh) (2)
where ht is the input vector, Wh is the weight of
AM and bh is its bias.
Step 2: Normalize the score from the first stage.
Then transform the attention score using the
softmax function, as indicated by:
a
∑
(3)
with v representing the attention value.
Step 3: Calculate the weighted summation of the
values to get the last attention value based on the
weight coefficients:
s
∑
a
h
(4)
BiLSTM is an expansion of the conventional
LSTM network. It enhances the ability to capture
information from both history and future states.
Different from LSTM, which only uses past
information to predict future outcomes, BiLSTMs
utilize two LSTM layers: separate for processing in
both directions (forward and backward).
In a BiLSTM network, the hidden states from both
directions are connected. This allows the model to
have a deeper comprehension of the sequence context.
This structure is especially beneficial in tasks where
the relationship between different time steps is crucial,
such as stock price prediction. The BiLSTM
equations are as follows with forward LSTM:
ℎ
⃑
𝐿𝑆𝑇𝑀ℎ
⃑
, 𝑥
(5)
and backward LSTM:
ℎ
⃐
𝐿𝑆𝑇𝑀ℎ
⃐
, 𝑥
(6)
and combined output:
ℎ
ℎ
⃑
; ℎ
⃐
(7)
With this method, the model is guaranteed access to
both previous and subsequent data at every time step.
The CNN-BiLSTM-AM model combines the
strengths of CNN, BiLSTM, and the Attention
Mechanism. It forms a powerful predictive
framework. This hybrid model is particularly
effective in tasks involving complex temporal
sequences, like forecasting stock prices. The flow of
this method is as follows:
Step 1: Normalize the gathered stock data. The
data will be divided into the training set and the
test set.
Step 2: First, one uses CNN to extract the
internal characteristic. CNN comprises a
convolution layer, a pooling layer, and a
dropout layer. After that, the BiLSTM layer will
then be trained to identify internal dynamic
change patterns using the local characteristics
that CNN extracted. Lastly, the BiLSTM
outputs are subjected to the attention
mechanism in order to emphasize the most
important features. Next, as seen in Fig. 2, the
output passes through a dense layer.
Step 3: Normalize the forecast result and obtain
the expected value.
Figure 2: CNN-BiLSTM-AM neural network
(Photo/Picture credit: Original).
This paper selected the data of Guizhou Moutai
from January 5, 2015, to September 6, 2024,
estimating the closing price and stock price for a
period of 3274 trading days. Guizhou Moutai is one
of China's most prominent publicly traded companies.
Daily records of the stock's initial price, highest price,
lowest price, closing price, adjusted closing price, and
volume are among the aspects that have been chosen.
These variables provide a comprehensive overview of
the stock's trading activity and are crucial for accurate
prediction. The training and test sets of data were
used at an 8:2 ratio. This data, characterized by its
high frequency and non-linear nature, is particularly
suitable for testing the effectiveness of various
predictive models, including CNN, LSTM, and other
hybrid approaches. The extensive period and detailed
daily records allow for a thorough examination of the
Hybrid Deep Learning Model for Stock Price Prediction: Evidence from Guizhou Moutai Stock
245
capacity of the model to represent and forecast
intricate changes in stock prices.
Three important error indicators are used to assess
the prediction models' efficacy: Mean Absolute
Percentage Error (MAPE), Root Mean Square Error
(RMSE), and the coefficient of determination (R²).
Every metric offers a different viewpoint on the
effectiveness of the model:
𝑀𝐴𝑃𝐸 Σ
|𝑦
𝑦
|/𝑦
100% (8)
𝑅𝑀𝑆𝐸
Σ
𝑦
𝑦
(9)
𝑅
1 Σ
𝑦
𝑦
/Σ
𝑦𝑦
(10)
Where 𝑦
is the predicted value, 𝑦
is the actual value,
𝑦 is the mean of the actual values, and n is the total
number of observations. Better predictive accuracy is
shown by a lower MAPE, with values nearer zero
denoting more accurate forecasts. Lower RMSE
values denote better performance, with smaller
numbers reflecting more accurate predictions. A
model's fit to the data is better when the R
2
value is
closer to 1, and less well when it is closer to 0. These
metrics offer a thorough assessment of the models'
functionality, ensuring that the predictions are
accurate and reliable for the given stock price data.
3 RESULTS AND DISCUSSION
3.1 Model Performance
This section uses a Guizhou Moutai stock price
dataset to assess how well each of eight stock price
prediction models. MLP, RNN, CNN, LSTM, CNN-
LSTM, BiLSTM, CNN-BiLSTM, and CNN-
BiLSTM-AM are the models taken into consideration.
Performance is assessed based on three metrics:
RMSE, MAPE, and R
2
. Fig. 3 to Fig. 10 display the
predictions for each model. Forecast outcomes
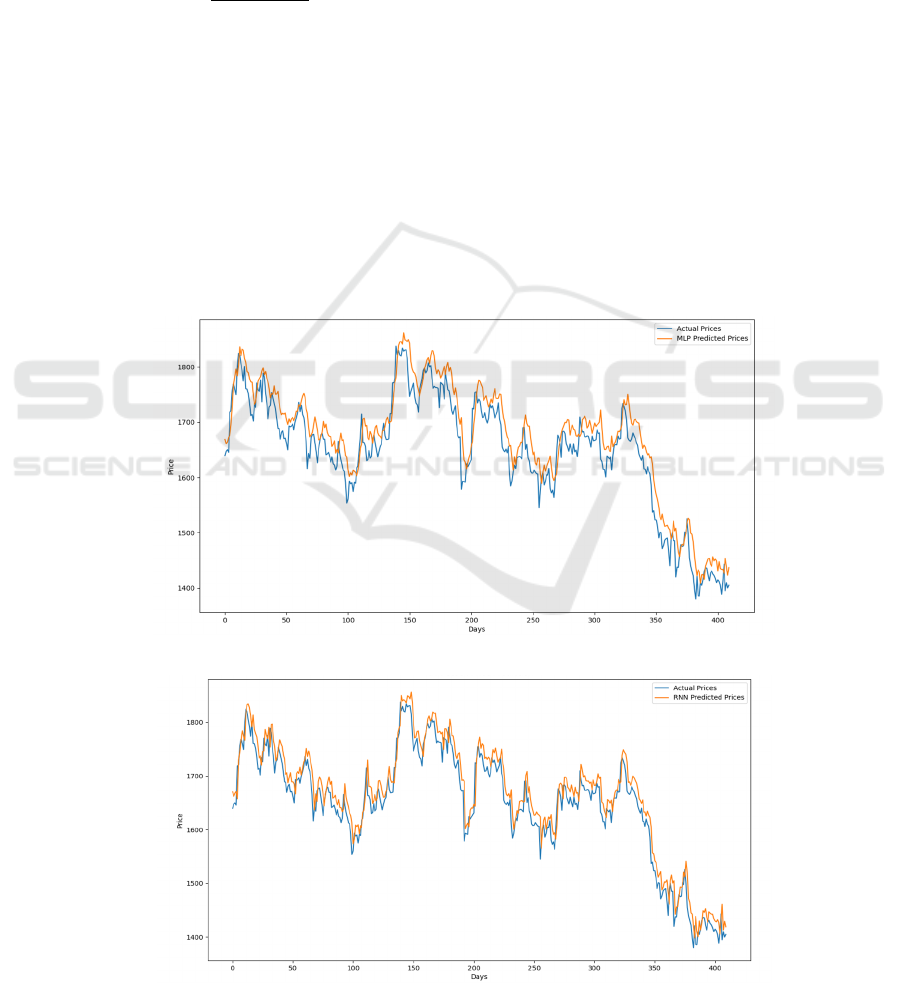
derived from the eight models is shown in Figures 3,
4, 5, 6, 7, 8, 9, and 10. Whereas the MLP line has the
lowest fit, and the CNN-BiLSTM-AM line has the
highest fit between the true value and the predicted
value, which almost completely overlap. The
comparison results of the three errors of the eight
methods are shown in Table 1.
Figure 3: Forecast outcomes derived from MLP (Photo/Picture credit: Original)
Figure 4: Forecast outcomes derived from RNN (Photo/Picture credit: Original).
ECAI 2024 - International Conference on E-commerce and Artificial Intelligence
246
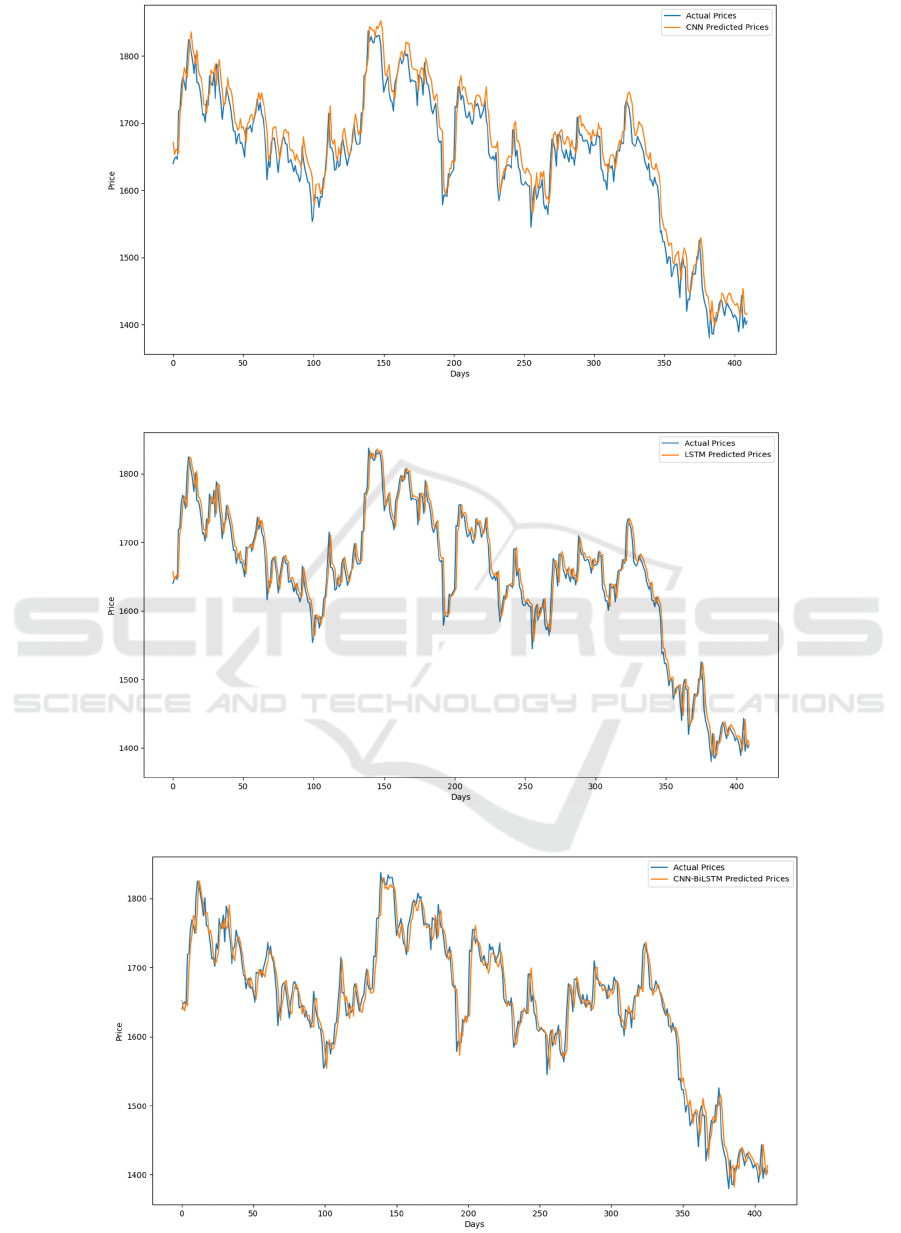
Figure 5: Forecast outcomes derived from CNN (Photo/Picture credit: Original).
Figure 6: Forecast outcomes derived from LSTM (Photo/Picture credit: Original).
Figure 7: Forecast outcomes derived from CNN-BiLSTM (Photo/Picture credit: Original).
Hybrid Deep Learning Model for Stock Price Prediction: Evidence from Guizhou Moutai Stock
247
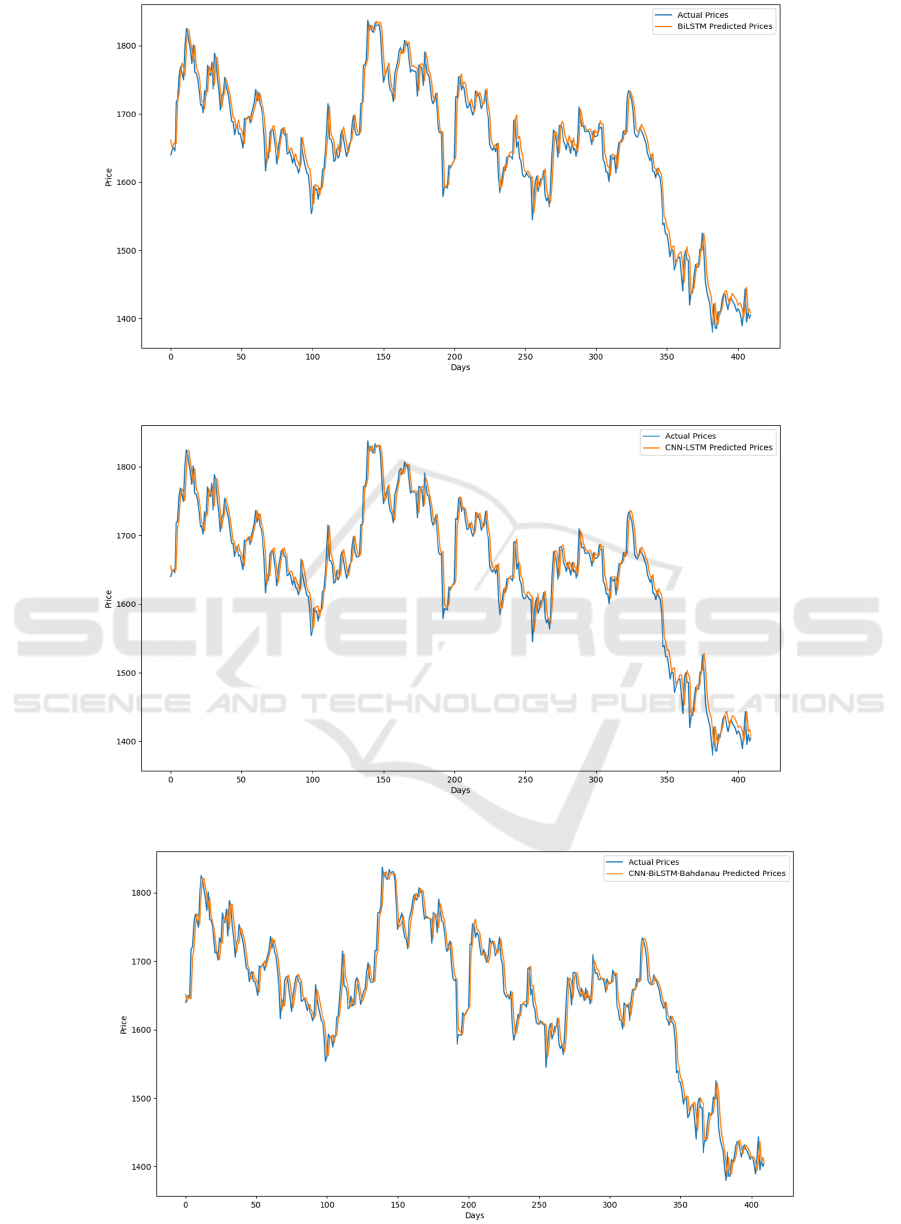
Figure 8: Forecast outcomes derived from BiLSTM (Photo/Picture credit: Original).
Figure 9: Forecast outcomes derived from CNN-LSTM (Photo/Picture credit: Original).
Figure 10: Forecast outcomes derived from CNN-BiLSTM-AM (Photo/Picture credit: Original).
ECAI 2024 - International Conference on E-commerce and Artificial Intelligence
248

Table 1: Model performance comparison.
Method RMSE MAPE
𝑅
MLP 37.162 1.908% 0.8718
RNN 28.002 1.426% 0.9272
CNN 27.163 1.362% 0.9315
LSTM 23.005 1.094% 0.9509
CNN-BiLSTM 22.202 1.016% 0.9542
BiLSTM 21.461 0.978% 0.9572
CNN-LSTM 21.412 0.967% 0.9574
CNN-BiLSTM-AM 21.273 0.944% 0.9580
3.2 Explanation and Implication
The examination of the outcomes indicates that the
more elaborate models perform better overall than the
simpler models such as MLP and RNN, particularly
when it comes to identifying the finer patterns in the
stock price data. The MLP model exhibits the highest
RMSE (37.162) and MAPE (1.908%), indicating
significant errors in its predictions. The low R
2
value
(0.8718) further suggests that MLP is less capable of
explaining the variance in the stock prices. The
underperformance of MLP underscores its limitations
in handling sequential data, where temporal
dependencies are crucial. This model's architecture
lacks the capability to capture the time-dependent
nature of stock prices effectively.
The RNN model improves upon MLP, with a
lower RMSE (28.002) and MAPE (1.426%).
However, its performance is still suboptimal
compared to more advanced models. The R
2
value of
0.9272 indicates a moderate ability to explain
variance. RNN’s ability to process sequences makes
it better suited for time series forecasting than MLP,
but issues like vanishing gradients limit its
effectiveness over longer sequences, which is evident
in its performance.
The CNN model further reduces RMSE (27.163)
and MAPE (1.362%), with an R
2
of 0.9315. This
suggests a better fit to the data compared to RNN.
CNN’s strength lies in its feature extraction
capabilities, which allow it to capture important
patterns in the data. However, without a mechanism
to explicitly handle temporal dependencies, CNN’s
performance is still outstripped by models like LSTM.
LSTM shows a marked improvement with RMSE
at 23.005 and MAPE at 1.094%. The R
2
value of
0.9509 indicates a strong fit to the data. The vanishing
gradient problem of RNN is solved by LSTM, making
it possible to identify long-term dependencies in the
data. Because of this, LSTM is quite useful for time
series forecasting applications such as stock price
prediction.
BiLSTM continues the trend of improvement,
with RMSE of 21.461 and MAPE of 0.978%. The R
2
value of 0.9572 reflects its enhanced predictive
capability. Because BiLSTM can analyze data both
forward and backward, it can comprehend the time
series more thoroughly and produce predictions that
are more accurate.
CNN-BiLSTM l slightly outperforms BiLSTM
alone, with an RMSE of 22.202 and MAPE of
1.016%. The R
2
value is marginally higher at 0.9542.
By merging the temporal processing of BiLSTM with
the feature extraction of CNN, this model effectively
captures both spatial and temporal patterns, resulting
in robust predictive performance.
CNN-LSTM offers similar results to CNN-
BiLSTM, with an RMSE of 21.412 and MAPE of
0.967%. Its R
2
value of 0.9574 indicates a strong fit.
The CNN-LSTM model’s architecture allows it to
harness CNN’s pattern recognition strengths while
benefiting from LSTM’s capability to handle
temporal dependencies, making it one of the more
effective models in this comparison.
The CNN-BiLSTM-AM model exhibits the best
performance, with the lowest RMSE (21.273) and
MAPE (0.944%) among all models. The R
2
value of
0.9580 is the highest, reflecting its superior accuracy.
The integration of an Attention Mechanism with
CNN-BiLSTM allows this model to concentrate on
the most pertinent time steps and elements, further
enhancing its ability to make precise predictions. This
makes it the most powerful model in this study for
stock price prediction.
3.3 Limitations and Prospects
Stock trading data is the assessment index utilized in
this article, and stock prices and indexes are impacted
by numerous different circumstances. Consequently,
the model suggested in this work has limits just like
previous models, the primary cause of which being
the model's structure. More effort can be done to
increase the prediction accuracy, such as adding the
most recent models to the index, creating new models,
Hybrid Deep Learning Model for Stock Price Prediction: Evidence from Guizhou Moutai Stock
249

which is of course challenging, or merging multi-
source heterogeneous stock information. Although it
is thought that similar results can be drawn, the author
did not evaluate the methodologies used in this study
using data from other nations or industries due to time
and space constraints. These can all be taken into
account in further work.
Subsequent investigations will primarily modify
the model's parameters in an effort to increase the
findings' accuracy. Future research work will also
conduct model stability analysis on the proposed
model to study whether the model is applicable to
other data sets estimation in other application fields,
such as gold price prediction and weather forecast.
4 CONCLUSIONS
To sum up, this study assesses and contrasts the
performance of many hybrid deep learning models,
concentrating on Guizhou Moutai stock. Results
demonstrate that advanced models, especially CNN-
BiLSTM-AM, outperform simpler models like MLP
and RNN on the precision of the predictions. Using
CNN for extraction of features, BiLSTM for temporal
dependency extraction, and Attention Mechanism for
emphasizing key information leads to superior
predictive performance. The CNN-BiLSTM-AM
model achieves the closest R
2
to 1 and the lowest
RMSE and MAPE, highlighting its effectiveness in
handling complex time series data. In the future,
studies should concentrate on increasing model
efficiency in order to lower computing expenses,
making it suitable for real-time trading environments.
Additionally, exploring the integration of external
factors like macroeconomic indicators could further
improve prediction accuracy. The study's significance
lies in providing a comprehensive comparison of
predictive models and offering insights into how
hybrid architectures can enhance stock price
forecasting.
REFERENCES
Box, G. E. P., Jenkins, G. M., 1970. Time Series Analysis:
Forecasting and Control. Holden-Day.
Haykin, S., 1999. Neural Networks: A Comprehensive
Foundation. Prentice Hall.
Hochreiter, S., Schmidhuber, J., 1997. Long Short-Term
Memory. Neural Comput., 9, 1735–1780.
Lu, W., Li, J., Li, Y., Sun, A., Wang, J., 2020. A cnn-lstm-
based model to forecast stock prices. Complexity, 2020,
1–10.
Luo, J., Zhang, X., 2022. Convolutional neural network
based on attention mechanism and bi-lstm for bearing
remaining life prediction. Applied Intelligence, 52(2),
1076-1091.
Qin, L., Yu, N., Zhao, D., 2018. Applying the convolutional
neural network deep learning technology to behavioral
recognition in intelligent video. Tehnički vjesnik, 25(2),
528-535.
Sun, Y., Sun, Q., Zhu, S., 2022. Prediction of Shanghai
stock index based on investor sentiment and cnn-lstm
model. J. Syst. Sci. Inf. Technol. Engl. Ed., 10, 620–632.
Treisman, A., Gelade, G., 1980. A feature-integration
theory of attention. Cogn Psychol 12(1), 97–146
Vaswani, A., Shazeer, N., Parmar, N., Uszkoreit, J., Jones,
L., Gomez, A. N., Kaiser, Ł., Polosukhin, I., 2017.
Attention is all you need. Advances in Neural
Information Processing Systems, 30, 5998-6008.
Wang, J., Wang, J., Sun, Q., 2021. Forecasting stock
market with optimized model by artificial rabbits
optimization algorithm. Expert Systems with
Applications, 163, 113481
Xiao, C., Xia, W., Jiang, J., 2020. Stock price forecast
based on combined model of ARI-MA-LS-SVM. Neural
Comput Appl., 32(10), 5379-5388.
Yu, P., Yan, X., 2020. Stock price prediction based on deep
neural networks. Neural Comput Appl., 32(6), 1609-
1628.
Zhang, J., Ye, L., Lai, Y., 2023. Stock Price Prediction
Using CNN-BiLSTM-Attention Model. Mathematics,
11(1985), 1-18.
ECAI 2024 - International Conference on E-commerce and Artificial Intelligence
250
