
A Fractional Mathematical Model of Influenza: Meningitis
Coinfection Using Caputo Derivatives
Muhammad Rifki Nisardi
a
, Hartina Husain
b
, Kusnaeni
c
, Muh. Ikhsan Amar
d
,
Muh Fadhil Nurahmad and Nur Rahmi
e
Bacharuddin Jusuf Habibie Institute of Technology, Parepare, Indonesia
Keywords: Fractional Model, Influenza, Meningitis, Predictor-Corrector Product Integration Method.
Abstract: This study examines a mathematical model involving the influenza infection on the spread of meningitis
within a population. This research extends previous studies by formulating the model in Caputo fractional
derivative with order 𝛼. Based on this model, we determined the equilibrium points of the system and their
stability conditions are determined. We also employ the Next Generation Matrix method to calculate the basic
reproduction number
𝑅
. Subsequently, the model solution is addressed through a numerical simulation
scheme for the fractional model, specifically the Predictor-Corrector Product Integration Rule (PECE-PI)
method. The result of this study showed that Different values of the fractional order indicated varying speeds
of reaching a steady state or endemic level while the changes of both influenza and meningitis transmission
rate and quarantine rate have an impact to transmission dynamics.
1 INTRODUCTION
Influenza is one of the diseases that can be transmitted
through airborne droplets and infect the respiratory
tract (Beauchemin & Handel, 2011). The
transmission rate of influenza is relatively high, thus
a susceptible person should maintain a distance of at
least one meter from an infected individual to
minimize the risk of infection (Jonnalagadda, 2022).
The infection caused by this virus typically lasts
around one week and is characterized by symptoms
such as fever, headache, pharyngitis, cough, and
fatigue. Generally, influenza infection affects the
nose, throat, bronchi, and even the lungs (Zhou &
Guo, 2012). In recent years, influenza has been found
in several different strains. In 2009, the H5N1 strain
caused avian flu infections, which were later followed
by the H1N1 strain that marked the onset of swine flu
(Kharis & Arifudin, 2017).
In addition to influenza, meningitis is a
contagious disease caused by the bacterial infection
of meningococcus (Neisseria meningitidis)
a
https://orcid.org/0000-0003-3235-4666
b
https://orcid.org/0009-0008-2590-8425
c
https://orcid.org/0000-0002-1392-3889
d
https://orcid.org/0009-0009-4473-910X
e
https://orcid.org/0000-0001-6774-1143
(Widyastuti et al., 2023). The infection process of
meningitis occurs through the transmission of
bacteria via airborne droplets from an infected
individual to a susceptible person. Additionally, the
use of personal items contaminated with bacteria can
also cause meningitis infection. The Neisseria
meningitidis bacteria infect the meninges, which are
thin layers that provide protection to the brain and
spinal cord (Abdullahi Baba et al., 2020; Musa et al.,
2020; Sulma et al., 2020; Türkün et al., 2023). After
infection, an individual may be asymptomatic or may
exhibit symptoms. Symptoms that can appear in an
infected individual include high fever, headache, stiff
neck, vomiting, and skin rash. Meningitis infection
requires prompt and accurate treatment, as untreated
meningitis can lead to fluid swelling around the brain
and spinal cord, potentially causing disability or death
(Bashir et al., 2003; Musa et al., 2020).
In terms of their transmission, both influenza and
meningitis spread from person to person through
coughing, sneezing, or airborne droplets. Several
symptoms caused by these diseases are similar,
Nisardi, M. R., Husain, H., Kusnaeni, , Amar, M. I., Nurahmad, M. F. and Rahmi, N.
A Fractional Mathematical Model of Influenza: Meningitis Coinfection Using Caputo Derivatives.
DOI: 10.5220/0013214100004605
Paper published under CC license (CC BY-NC-ND 4.0)
In Proceedings of the 5th Borneo International Conference (BICAME 2024), pages 5-13
ISBN: 978-989-758-734-4; ISSN: 3051-6994
Proceedings Copyright © 2025 by SCITEPRESS – Science and Technology Publications, Lda.
5

necessitating clinical tests for accurate identification.
The similar patterns of spread and symptoms make it
possible for an individual infected with meningitis to
be influenced by influenza or vice versa (Cartwright
et al., 1991; Salomon et al., 2020). Previous research
has extensively studied the mathematical models of
influenza transmission only (Aulia & Kharis, 2016;
Goswami & Shanmukha, 2016; Kanyiri et al., 2018;
Wu & Cowling, 2011) and meningitis only
(Abdullahi Baba et al., 2020; Asamoah et al., 2018;
Buonomo & Della Marca, 2024; Peter et al., 2022).
However, there is still a lack of studies examining the
transmission dynamics of co-infection models for
influenza and meningitis. Therefore, mathematical
models are one of the methods that can be used to
explore the transmission dynamics of these co-
infection models.
A previous study that examined the influenza-
meningitis co-infection model is that of Varshney et
al., who constructed a mathematical model of the
spread of influenza and meningitis co-infection. This
model was developed using an integer-order
mathematical model to understand the dynamics of
the co-infection spread (Varshney & Dwivedi, 2021).
Based on this model, the present study develops the
influenza-meningitis co-infection model using a
fractional-order mathematical model to yield a better
understanding of the transmission dynamics of the
influenza-meningitis co-infection spread.
2 MODEL FORMULATION AND
PROPERTIES
2.1 Model Formulation
The model formulated in this study is divided into six
subpopulations: Susceptible 𝑆𝑡, influenza-infective
only 𝐼
𝑡 , meningitis-infective only 𝐼
𝑡 ,
influenza-meningitis coinfectives 𝐼
𝑡, quarantine
of influenza 𝑄𝑡, and recovered 𝑅𝑡. The 𝑆𝑡
compartment increases by the birth rate Λ .
Individuals who come into contact with those infected
with influenza or those with influenza-meningitis
coinfection will move to the 𝐼
𝑡 compartment at a
contact rate 𝛽
. The proportion of individuals infected
with influenza or coinfected with influenza and
meningitis moving to the 𝐼
compartment is
represented by the force of infection of influenza 𝑓
, where 𝑁 is the number of total
populations. Similarly, susceptible individuals move
to the 𝐼
𝑡 compartment due to contact with
individuals infected with meningitis or those with
influenza-meningitis coinfection at a contact rate 𝛽
,
with the force of infection of meningitis 𝑓
. Additionally, the 𝑆𝑡 compartment
decreases due to natural death at a rate 𝜇.
The 𝐼
compartment decreases due to several
factors: natural death, death caused by influenza
infection at a rate 𝑑
, individuals infected with
influenza being quarantined at a rate 𝜏
, individuals
who experience coinfection with meningitis (with a
force of infection 𝑓
) moving to the 𝐼
compartment, and individuals who recover naturally
at a rate 𝛾
. Similarly, the 𝐼
compartment decreases
due to natural death, death caused by meningitis at a
rate 𝑑
, secondary influenza infection (with a force of
infection 𝑓
) leading to a transition to the 𝐼
compartment, and individuals who recover naturally
at a rate 𝛾
.
Subsequently, the 𝐼
compartment increases
due to secondary infection of individuals in the 𝐼
and
𝐼
compartments. This compartment decreases due to
natural death, death from coinfection at a rate 𝑑
, and
natural recovery at a rate 𝛾
. The 𝑄𝑡 compartment
increases when individuals infected with influenza
are quarantined at a rate 𝜏
, preventing them from
spreading the disease to susceptible individuals. The
𝑄𝑡 compartment decreases due to natural death,
death from influenza infection, and recovery of
individuals at a rate 𝜓. The 𝑅𝑡 compartment
increases as individuals recover and decreases due to
natural death and loss of immunity at a rate 𝜃, leading
to a transition back to the 𝑆𝑡 compartment. The
interactions among these compartments are
illustrated in Figure 1
.
Figure 1. Flowchart of Model.
In this study, we developed the deterministic
model of influenza-meningitis coinfection from
Varshney & Dwivedi (Varshney & Dwivedi, 2021)
into fractional differential system. The model divided
into six compartments as follows
BICAME 2024 - Borneo International Conference
6

𝐷
𝑆
𝑡
= Λ
+ 𝜃
𝑅−
𝑓
+
𝑓
+ 𝜇
𝑆,
𝐷
𝐼
𝑡
=
𝑓
𝑆−
𝜇
+ 𝑑
+ 𝜏
+ 𝛾
+ 𝜙
𝑓
𝐼
,
𝐷
𝐼
𝑡
= 𝑓
𝑆−
𝜇
+ 𝑑
+ 𝛾
+ 𝜔𝑓
𝐼
,
𝐷
𝐼
𝑡
= 𝜙𝑓
𝐼
+ 𝜔𝑓
𝐼
−
𝜇
+ 𝑑
+
𝛾
𝐼
,
𝐷
𝑄
𝑡
= 𝜏
𝐼
−
𝜇
+ 𝑑
+ 𝜓
𝑄,
𝐷
𝑅
𝑡
= 𝛾
𝐼
+ 𝛾
𝐼
+ 𝛾
𝐼
+ 𝜓
𝑄−
𝜇
+ 𝜃
𝑅.
(1)
We apply the Caputo fractional derivative in
the left-hand side of the model (1) The adjustment to
fractional system implies the change of dimension 𝑡
into 𝑠
dimension for 0<𝛼≤1 (Barros et al.,
2021). Therefore, we set all parameters with power of
𝛼 to accommodate dimensional changes
2.2 Positivity and Boundedness
Let us consider the closed set Ω defined as
Ω= 𝑆, 𝐼
, 𝐼
, 𝐼
, 𝑄, 𝑅∈𝑅
|𝑆, 𝐼
, 𝐼
, 𝐼
, 𝑄, 𝑅≥
0 is the biologically feasible region for system (1).
Theorem 1 The solution of fractional model of
Influenza Meningitis coinfection starting in 𝑅
along
with initial conditions are positive invariant and
bounded for all time 𝑡≥0.
Proof. We have to show that the set Ω is a positive
invariant. From the system (1) we obtained.
𝐷
𝑆
𝑡
= Λ
+ 𝜃
𝑅≥0
𝐷
𝐼
𝑡
=
𝑓
𝑆≥0
𝐷
𝐼
𝑡
=
𝑓
𝑆≥0
𝐷
𝐼
𝑡
= 𝜙𝑓
𝐼
+ 𝜔𝑓
𝐼
≥0
𝐷
𝑄
𝑡
= 𝜏
𝐼
≥0
𝐷
𝑅
𝑡
= 𝛾
𝐼
+ 𝛾
𝐼
+ 𝛾
𝐼
+ 𝜓
𝑄≥0
(2)
The Equation (2) hold for all points in Ω and using
Lemma 1 show that the set Ω is positive invariant of
model (1).
Next, we derived the boundedness of Ω. If all of
the equations in model (1) are added then we obtained
the total population as follows
𝐷
𝑁
𝑡
= Λ
−𝜇
𝑆+ 𝐼
+ 𝐼
+ 𝐼
+ 𝑄+ 𝑅
−𝑑
𝑄−𝑑
𝐼
−𝑑
𝐼
−𝑑
𝐼
.
This gives
𝐷
𝑁
𝑡
≤Λ
−𝜇
𝑁.
By using Lemma 9 in Choi et al., (2014) we get
𝑁
𝑡
≤Λ
𝑡
𝐸
,
−𝜇
𝑡
+ 𝑁
𝐸
,
−𝜇
𝑡
𝑁
𝑡
≤
Λ
𝜇
𝜇
𝑡
𝐸
,
−𝜇
𝑡
+ 𝐸
,
−𝜇
𝑡
where 𝐸
,
is Mittag-Leffler function. Using
Theorem 5.1 in Haubold et al., (2011) we obtained
𝑁
𝑡
≤
Λ
𝜇
1
Γ(1)
−𝐸
,
(
−𝜇
𝑡
)
+ 𝐸
,
(
−𝜇
𝑡
)
𝑁
(
𝑡
)
≤
Λ
𝜇
1
Γ
(
1
)
≤
Λ
𝜇
.
Since the total population is bounded so the
subpopulations are also bounded and this complete
the proof.
2.3 Normalized Model of
Influenza-Meningitis Coinfection
Model
By assuming new dimensionless variables, 𝑥
=
, 𝑥
=
, 𝑥
=
, 𝑥
=
, 𝑥
=
, 𝑥
=
, the
dimensionless model is obtained as follows
𝐷
𝑥
(
𝑡
)
= 𝜇
+ 𝜃
𝑥
−
(
𝑓
+
𝑓
+ 𝜇
)
𝑥
,
𝐷
𝑥
(
𝑡
)
=
𝑓
𝑥
−
(
𝜇
+ 𝑑
+ 𝜏
+ 𝛾
+ 𝜙
𝑓
)
𝑥
,
𝐷
𝑥
(
𝑡
)
= 𝑓
𝑥
−
(
𝜇
+ 𝑑
+ 𝛾
+ 𝜔𝑓
)
𝑥
,
𝐷
𝑥
(
𝑡
)
= 𝜙𝑓
𝑥
+ 𝜔𝑓
𝑥
−
(
𝜇
+ 𝑑
+ 𝛾
)
𝑥
,
𝐷
𝑥
(
𝑡
)
= 𝜏
𝑥
−
(
𝜇
+ 𝑑
+ 𝜓
)
𝑥
,
𝐷
𝑥
(
𝑡
)
= 𝛾
𝑥
+ 𝛾
𝑥
+ 𝛾
𝑥
+ 𝜓
𝑥
−
(
𝜇
+ 𝜃
)
𝑥
.
(
3)
where 𝑓
= 𝛽
(
𝑥
+ 𝑥
)
and 𝑓
= 𝛽
(
𝑥
+ 𝑥
)
and
the initial values of system (3) is nonnegative
𝑥
(
0
)
≥0, 𝑥
(
0
)
≥0, 𝑥
(
0
)
≥0, 𝑥
(
0
)
≥
0, 𝑥
(
0
)
≥0, 𝑥
(
0
)
≥0.
3 RESULT AND DISCUSSION
3.1 Equilibrium Point of
Influenza-Meningitis Coinfection
Fractional Model
We obtained the disease-free equilibrium (DFE) point
of the system by setting all the equation equal to zero
and providing that 𝑥
= 𝑥
= 𝑥
=0. We denoted
the DFE point as follows
𝑋
= (1,0,0,0,0,0)
On the other side, the endemic equilibrium (EE)
point is denoted by 𝑋
∗
=
(
𝑥
∗
, 𝑥
∗
, 𝑥
∗
, 𝑥
∗
, 𝑥
∗
, 𝑥
∗
)
.
The EE point exists when 𝑥
= 𝑥
= 𝑥
≠0 which
means that the disease persists among the community.
By making all equations in (3) equal to zero and
performing some algebraic manipulation, we obtain
EE point for influenza meningitis coinfection model
as follows
.
A Fractional Mathematical Model of Influenza: Meningitis Coinfection Using Caputo Derivatives
7

𝑥
∗
=
𝜇
+ 𝜃
𝑥
𝑓
+
𝑓
+ 𝜇
;
𝑥
∗
=
𝑓
𝑥
𝜇
+ 𝑑
+ 𝜏
+ 𝛾
+ 𝜙𝑓
;
𝑥
∗
=
𝑓
𝑥
𝜇
+ 𝑑
+ 𝛾
+ 𝜔𝑓
;
𝑥
∗
=
𝜙
(
𝜇
+ 𝑑
+ 𝛾
+ 𝜔𝑓
)
+ 𝜔
(
𝜇
+ 𝑑
+ 𝜏
+ 𝛾
+
𝜙
(
𝜇
+ 𝑑
+ 𝛾
)(
𝜇
+ 𝑑
+ 𝜏
+ 𝛾
+ 𝜙𝑓
)(
𝜇
+ 𝑑
𝑥
∗
=
𝜏
𝑓
𝑥
(
𝜇
+ 𝑑
+ 𝜓
)(
𝜇
+ 𝑑
+ 𝜏
+ 𝛾
𝑥
∗
=
𝛾
𝑥
+ 𝛾
𝑥
+ 𝛾
𝑥
+ 𝜓
𝑥
(
𝜇
+ 𝜃
)
;
(4)
3.2 Basic Reproduction Number
The Next generation Matrix method (Dreessche &
Watmough, 2002) is employed to obtain the
reproduction number of influenza – meningitis
coinfection. First, we consider the disease class 𝑋=
(
𝑥
, 𝑥
, 𝑥
, 𝑥
)
in 𝐹 and 𝑉
𝐹=
𝑓
𝑥
𝑓
𝑥
0
0
,
𝑉=
⎝
⎜
⎛
(
𝜇
+ 𝑑
+ 𝜏
+ 𝛾
+ 𝜙𝑓
)
𝑥
(
𝜇
+ 𝑑
+ 𝛾
+ 𝜔𝑓
)
𝑥
−𝜙𝑓
𝑥
−𝜔𝑓
𝑥
+
(
𝜇
+ 𝑑
+ 𝛾
)
𝑥
−𝜏
𝑥
+
(
𝜇
+ 𝑑
+ 𝜓
)
𝑥
⎠
⎟
⎞
We evaluate the matrices 𝐹 and 𝑉 at 𝑋
𝐹=
𝛽
0 𝛽
0
0 𝛽
𝛽
0
0000
0000
(5)
And
𝑉=
⎣
⎢
⎢
⎡
𝑘
1
000
0 𝑘
00
00𝑘
0
000𝑘
⎦
⎥
⎥
⎤
(6)
𝑘
= 𝜇
𝛼
+ 𝑑
1
𝛼
+ 𝜏
1
𝛼
+ 𝛾
1
𝛼
𝑘
= 𝜇
+ 𝑑
+ 𝛾
𝑘
= 𝜇
+ 𝑑
+ 𝛾
𝑘
= 𝜇
+ 𝑑
+ 𝜓
The matrix 𝐹𝑉
becomes as
𝐹𝑉
=
⎣
⎢
⎢
⎢
⎢
⎡
0
𝑘
3
0
0
𝑘
2
𝑘
3
0
0000
0
0
0
0
⎦
⎥
⎥
⎥
⎥
⎤
(7)
Then, we obtained the corresponding eigen values of
the next matrix generation 𝐹𝑉
are
𝑅
=
𝛽
𝜇
+ 𝑑
+ 𝜏
+ 𝛾
, 𝑅
=
𝛽
𝜇
+ 𝑑
+ 𝛾
.
Thus, the reproduction number is
𝑅
= 𝑚𝑎𝑥
𝑅
, 𝑅
.
3.3 Local Stability Analysis of DFE
We begin the local-stability analysis by forming a
Jacobian Matrix respect to 𝑋
as follows.
𝐽
(
𝐸
)
=
⎣
⎢
⎢
⎢
⎢
⎡
−𝜇
−𝛽
−𝛽
−𝛽
−𝛽
0 𝜃
0 −𝑘
000 0
00−𝑘
00 0
000 −𝑘
00
0 𝜏
00−𝑘
0
0 𝛾
𝛾
𝛾
𝜓
−
(
𝜇
+ 𝜃
)
⎦
⎤
(8)
From Equation (8), we obtained a characteristic
polynomial
(
𝜆+ 𝜇
)(
𝜆+ 𝜇
+ 𝑑
+ 𝜏
+ 𝛾
)(
𝜆
+ 𝜇
+ 𝑑
+ 𝛾
)(
𝜆
+ 𝜇
+ 𝑑
+ 𝛾
)(
𝜆
+ 𝜇
+ 𝑑
+ 𝜓
)(
𝜆
+ 𝜇
+ 𝜃
)
=0
(9)
Based on Equation (9) we obtained the eigen values
𝜆
= −𝜇
;
𝜆
= −
(
𝜇
+ 𝑑
+ 𝜏
+ 𝛾
)
;
𝜆
= −
(
𝜇
+ 𝑑
+ 𝛾
)
;
𝜆
= −
(
𝜇
+ 𝑑
+ 𝛾
)
𝜆
= −
(
𝜇
+ 𝑑
+ 𝜓
)
𝜆
= −
(
𝜇
+ 𝜃
)
Because we have all parameters
𝜇, 𝑑
, 𝑑
, 𝑑
, 𝜏
, 𝛾
, 𝛾
, 𝛾
, 𝜓, 𝜃>0 , it implies
𝜆
,…
<0 and
|
arg (𝜆
)
|
= 𝜋. Therefore, it can be
guaranteed that
|
arg
(
𝜆
)|
>
for all 0<𝛼≤1
and 𝑋
is local asymptotically stable ∎
3.4 Numerical Simulation Findings
This section shows various numerical simulation of
Influenza and Meningitis coinfection model to
analyse the transmission dynamics. The initial
conditions are set to be 𝑥
(
0
)
= 0.7, 𝑥
(
0
)
=0.1 ,
𝑥
(
0
)
=0.1 , 𝑥
(
0
)
=0.05 , 𝑥
(
0
)
= 0.001 ,
𝑥
(
0
)
= 0.049 and the parameter values are provided
in Table 1.
BICAME 2024 - Borneo International Conference
8

Table 1. Parameters of the Model.
Parameters
Description Value Source
𝜇
Natural
birth/death rate
0.02
(Varshney &
Dwivedi,
2021
)
𝜃
Loss of
Immunity
0.00735
(Kotola &
Mekonnen,
2022
)
𝛽
Influenza
contact Rate
2.343
(Varshney &
Dwivedi,
2021
)
𝛽
Meningitis
Contact rate
0.9
(Kotola &
Mekonnen,
2022)
𝑑
Influenza only
caused death
rate
0.001
(Jonnalagadd
a, 2022)
𝜏
The rate of
discovered
influenza moved
to quarantine
0.5 – 2
(Varshney &
Dwivedi,
2021)
𝛾
Natural
Recovery rate of
Influenza onl
y
0.14
(Jonnalagadd
a, 2022)
𝑑
Meningitis only
caused death
rate
0.002
(Kotola &
Mekonnen,
2022)
𝑑
Influenza and
Meningitis co
infection death
rate
0.2
(Varshney
& Dwivedi,
2021)
𝛾
Recovery rate of
Influenza and
Meningitis co
infection
0.04
Assumed
𝛾
Natural
recovery rate of
Menin
g
itis onl
y
0.02
(Kotola &
Mekonnen,
2022)
𝜙
Modification
p
aramete
r
1
Assumed
𝜔
Modification
p
aramete
r
1
Assumed
𝜓
The average
spent in
isolation
0.244
(Varshney
& Dwivedi,
2021)
We employ the Predictor-corrector (PECE) with
Product Integration (PI) rules method developed by
Garrappa (Garrappa, 2018) in MATLAB to perform
numerical simulation for several values of fractional
order 𝛼. It aims to analyse the dynamical behaviour
of each population. By using PECE-PI method we get
numerical expression to solve the system (3) as
follows
𝑥
= 𝑇
𝑥
; 𝑡
(
𝑡
)
+
ℎ
∑
𝑏
(
)
𝑔
𝑡
, 𝑥
(10)
𝑥
= 𝑇
𝑥
; 𝑡
(
𝑡
)
+ ℎ
𝑎
(
)
𝑔
(
0
)
+
∑
𝑎
(
)
𝑔
𝑡
, 𝑥
+ 𝑎
(
)
𝑔
(𝑡
, 𝑥
)
(11)
Where 𝑖=1,2,…6,
𝑏
(
)
=
((
)
)
()
, 𝑎
(
)
=
(
)
(
)
()
,
and
𝑎
(
)
=
()
, 𝑛=0
(
)
(
)
()
, 𝑛=1,2,…
Figure 2 illustrates the dynamics of the proportion
of individuals in the susceptible compartment with
various fractional orders. In this simulation, the four
alpha values exhibit different dynamics. At the
beginning of the simulation, all four show a decrease
in proportion. It is evident that the fractional orders
closer to 1 have a graph that tends to be more
fluctuating before reaching the endemic equilibrium
point. Figure 3 demonstrates the dynamics of the
compartment of individuals infected with influenza
with different fractional orders. The results indicate
that during the first 1-5 days, the population infected
with influenza shows an increase, followed by a
decrease in the number of infections due to
individuals recovering, receiving quarantine
measures, or acquiring secondary infections and
moving to the influenza-meningitis co-infection
compartment. The larger the fractional order, the
faster the approach to the endemic point.
Figure 4 shows the simulation results for the
proportion of individuals infected with meningitis for
several different fractional orders. During the first 2-
3 days, the proportion of infected individuals
increases and then decreases due to individuals
acquiring secondary infections or recovering. The
different fractional orders exhibit varying behaviours.
The fractional order α=0.95 tends to be more
fluctuating compared to the other fractional orders.
Figure 5 illustrates the dynamics of the
proportion of individuals in the influenza-meningitis
co-infection compartment. The simulation results
indicate an increase in cases during the first 10 days
of the simulation. Subsequently, the proportion of
individuals in the co-infection compartment
decreases towards the endemic equilibrium point. It
is observed that smaller fractional orders have
relatively smaller fluctuations compared to other
fractional orders, and therefore tend to reach the
endemic equilibrium point more slowly.
A Fractional Mathematical Model of Influenza: Meningitis Coinfection Using Caputo Derivatives
9
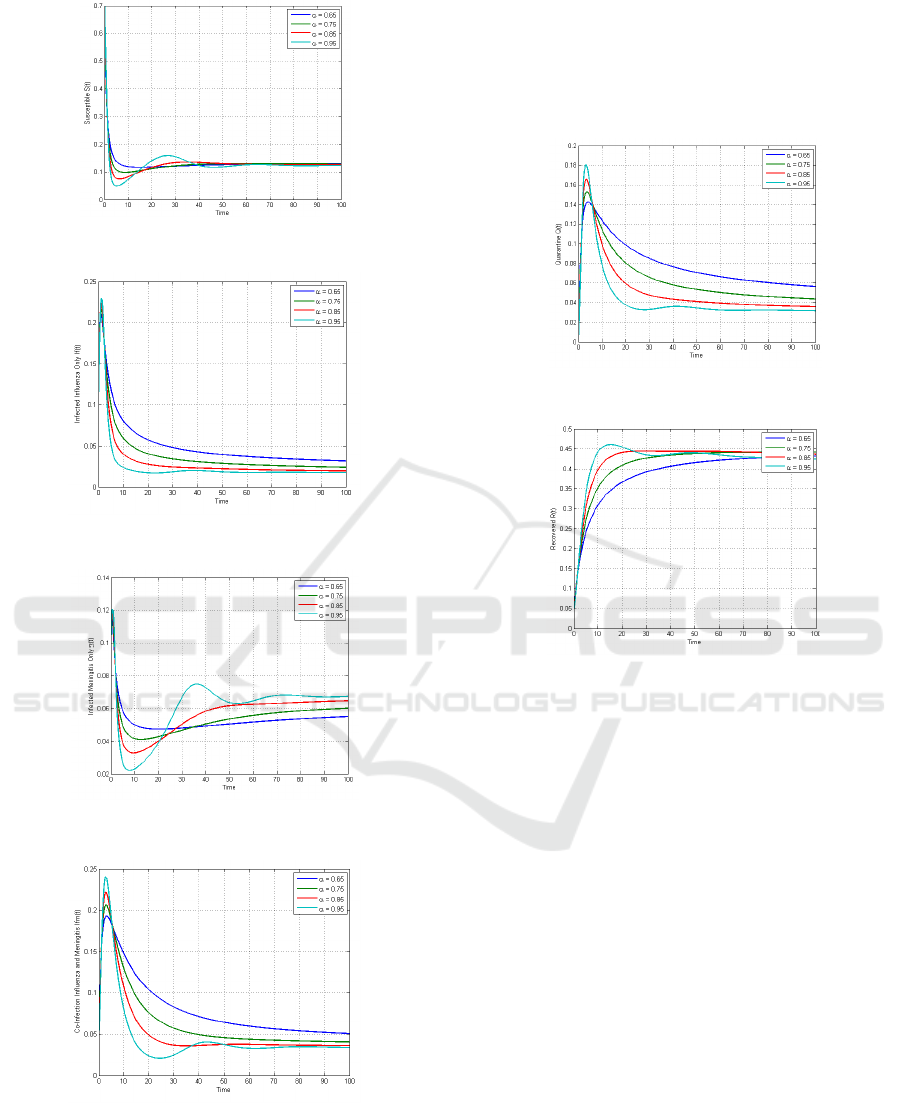
Figure 2: Behaviour of Susceptible Population with
different values of 𝛼.
Figure 3: Behaviour of Infected Influenza Only with
different values of 𝛼.
Figure 4: Behaviour of Infected Meningitis Only with
different values of 𝛼.
Figure 5: Behaviour of Influenza-Meningitis Coinfection
with different values of 𝛼.
Figure 6 shows the dynamics of the proportion of
individuals with influenza who are quarantined with
various fractional orders α. In the initial days, the
proportion of quarantined individuals increases in
line with the rising number of influenza infections.
Subsequently, the proportion of quarantined
individuals decreases due to the recovery of
individuals or the decreasing number of influenza
infections
Figure 6: Behaviour of Quarantine Population with
different values of 𝛼.
Figure 7: Behaviour of Recovered Population with different
values of 𝛼.
Figure 7 presents the simulation results depicting
the recovered subpopulation with different fractional
orders α. In the first 30 days, the number of recoveries
increases before reaching a relatively stagnant phase.
It is observed that smaller fractional orders α reach a
steady state condition relatively faster due to the
memory effect of the susceptible population
Figures 8, 9, 10, and 11 illustrate various contact
rates for infected influenza (β₁) and infected
meningitis (β₂) on the populations infected with
influenza only and meningitis only. Figure 8 shows
that the larger the contact rate for infected influenza,
the higher the proportion of individuals who will be
infected with influenza. Figure 9 shows an inverse
result: an increase in the contact rate for infected
influenza reduces the proportion of individuals
infected with meningitis. This is because more
individuals progressing to the influenza compartment
reduces the proportion of susceptible individuals,
thereby lowering the proportion of individuals
infected with meningitis. Figures 10 and 11 exhibit
similar behavior to the previous cases, where an
increase in the contact rate for infected meningitis
BICAME 2024 - Borneo International Conference
10
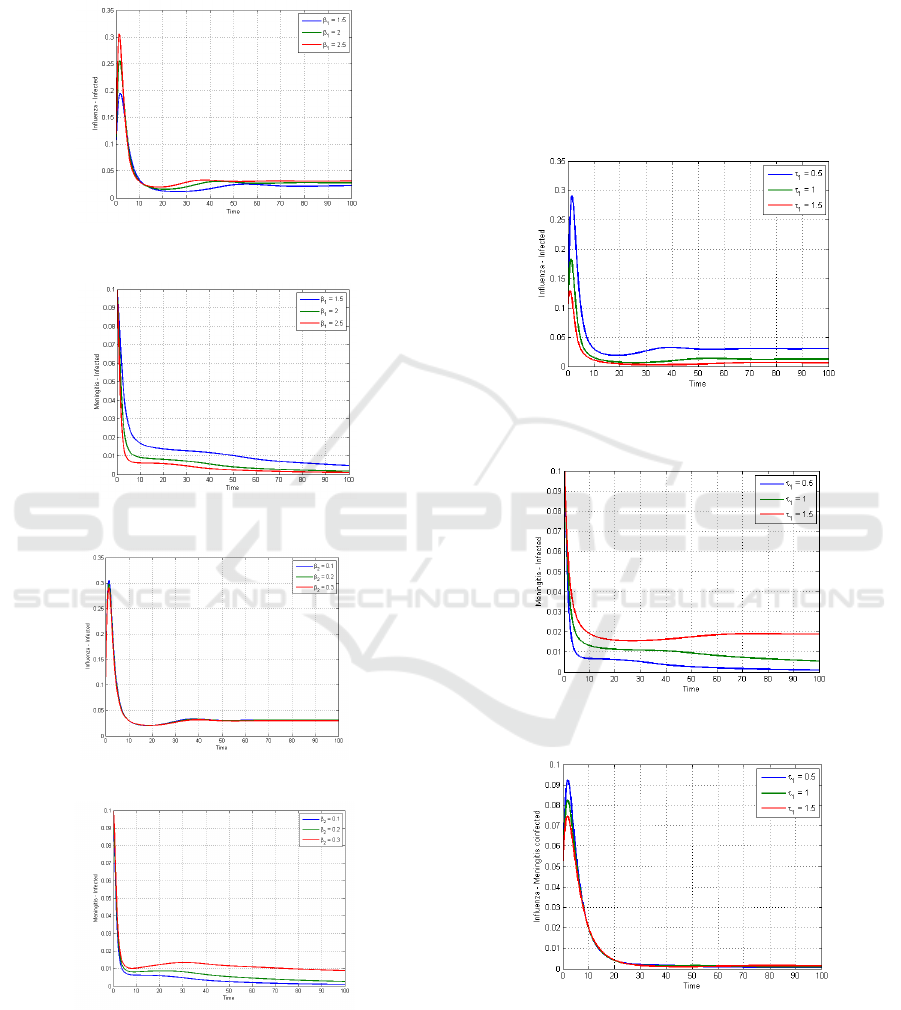
increases the proportion of individuals infected with
meningitis (Figure 11) but, on the other hand,
decreases the proportion of individuals infected with
influenza (Figure 10).
Figure 8: Infected Influenza Only with different contact rate
𝛽
.
Figure 9: Infected Meningitis Only with different contact
rate 𝛽
.
Figure 10: Infected Influenza Only with different contact
rate 𝛽
.
Figure 11:Infected Meningitis Only with different contact
rate 𝛽
.
Figures 12, 13, and 14 present simulation
results for various quarantine rates. The higher the
quarantine rate for influenza, the lower the increase in
the proportion of individuals infected with influenza
only (Figure 12). This is consistent with the lower
increase in the proportion of co-infected individuals
when the quarantine rate for influenza-infected
individuals rises (Figure 14). However, an increase in
the quarantine rate does not reduce the proportion of
individuals infected with meningitis. A high
quarantine rate for influenza-infected individuals
reduces the spread of influenza, which gradually
increases the proportion of meningitis infections in
the population (Figure 13).
Figure 12: Infected Influenza - Only with different
quarantine rate.
Figure 13: Infected Meningitis - Only with different
quarantine rate.
Figure 14: Influenza - Meningitis Coinfection with different
quarantine rate.
A Fractional Mathematical Model of Influenza: Meningitis Coinfection Using Caputo Derivatives
11

4 CONCLUSIONS
This research extended the deterministic model of
Influenza-Meningitis coinfection transmission
dynamics to a generalized Caputo fractional
derivative to consider the memory effect of a
biological system. We demonstrated the qualitative
properties of the model to ensure its biological
relevance, specifically focusing on coinfection
transmission. Using the next-generation method, we
obtained two equilibrium points and computed the
basic reproduction number for Influenza-Meningitis
coinfection. Furthermore, we analysed the local
stability condition of the disease-free equilibrium.
Additionally, we performed numerical simulations
with several values of fractional order, influenza
transmission rate, meningitis transmission rate, and
quarantine rate to explore their effects to the
transmission. Different values of the fractional order
indicated varying speeds of reaching a steady state or
endemic level.
ACKNOWLEDGEMENTS
This research was financially supported by Institut
Teknologi Bacharuddin Jusuf Habibie Research and
Community Service Grant scheme 2024
REFERENCES
Abdullahi Baba, I., Ibrahim Olamilekan, L., Yusuf, A.,
Baleanu, D., (2020). Analysis of meningitis model: A
case study of northern Nigeria. AIMS Bioengineering,
7(4), 179–193. https://doi.org/10.3934/bioeng.2020016
Asamoah, J. K. K., Nyabadza, F., Seidu, B., Chand, M., &
Dutta, H. (2018). Mathematical Modelling of Bacterial
Meningitis Transmission Dynamics with Control
Measures. Computational and Mathematical Methods
in Medicine, 2018, 1–21. https://doi.org/10.1155/
2018/2657461
Aulia, N., & Kharis, M. (2016). Pemodelan Matematika
Epidemi Influenza Dengan Memperhatikan Peluang
Keberhasilan Vaksinasi Dan Kekebalan Tetap.
Barros, L. C. de, Lopes, M. M., Pedro, F. S., Esmi, E.,
Santos, J. P. C. dos, & Sánchez, D. E. (2021). The
memory effect on fractional calculus: An application in
the spread of COVID-19. Computational and Applied
Mathematics, 40(3), 72. https://doi.org/10.1007/s
40314-021-01456-z
Bashir, H. E., Laundy, M., & Booy, R. (2003). Diagnosis
and treatment of bacterial meningitis.
Beauchemin, C. A., & Handel, A. (2011). A review of
mathematical models of influenza A infections within a
host or cell culture: Lessons learned and challenges
ahead.
Buonomo, B., & Della Marca, R. (2024). A behavioural
vaccination model with application to meningitis spread
in Nigeria. Applied Mathematical Modelling, 125, 334–
350. https://doi.org/10.1016/j.apm.2023.09.031
Cartwright, K. A. V., Jones, D. M., Kaczmarski, E., Smith,
A. J., Stuart, J. M., & Palmer, S. R. (1991). Influenza A
and meningococcal disease. The Lancet, 338(8766),
554–557.https://doi.org/10.1016/0140-6736(91)91112-8
Choi, S., Kang, B., & Koo, N. (2014). Stability for Caputo
Fractional Differential Systems. Abstract and Applied
Analysis, 2014, 1–6. https://doi.org/10.1155/2014/
631419
Dreessche, P., & Watmough, J. (2002). Reproduction
Numbers and Sub-threshold Endemic Equilibria for
Compartmental Models of Disease Transmission.
Mathematical Biosciences, 180, 29–48. https://doi.org/
10.1016/S0025-5564(02)00108-6
Garrappa, R. (2018). Numerical Solution of Fractional
Differential Equations: A Survey and a Software
Tutorial. Mathematics, 6(2), 16. https://doi.org/
10.3390/math6020016
Goswami, N. K., & Shanmukha, B. (2016). A Mathematical
Model of Influenza: Stability and Treatment.
Haubold, H. J., Mathai, A. M., & Saxena, R. K. (2011).
Mittag‐Leffler Functions and Their Applications.
Journal of Applied Mathematics, 2011
(1), 298628.
https://doi.org/10.1155/2011/298628
Jonnalagadda, J. M. (2022). Epidemic Analysis and
Mathematical Modelling of H1N1 (A) with
Vaccination. Nonautonomous Dynamical Systems,
9(1), 1–10. https://doi.org/10.1515/msds-2020-0143
Kanyiri, C. W., Mark, K., & Luboobi, L. (2018).
Mathematical Analysis of Influenza A Dynamics in the
Emergence of Drug Resistance. Computational and
Mathematical Methods in Medicine, 2018, 1–14.
https://doi.org/10.1155/2018/2434560
Kharis, M., & Arifudin, R. (2017). Mathematical Model of
Seasonal Influenza with Treatment in Constant
Population. Journal of Physics: Conf. Series, 824, 01
2034. https://doi.org/10.1088/1742-6596/824/1/012034
Kotola, B. S., & Mekonnen, T. T. (2022). Mathematical
model analysis and numerical simulation for codynamics
of meningitis and pneumonia infection with intervention.
Scientific Reports, 12(1), 2639. https://doi.org/10.1
038/s41598-022-06253-0
Musa, S. S., Zhao, S., Hussaini, N., Habib, A. G., & He, D.
(2020). Mathematical modeling and analysis of
meningococcal meningitis transmission dynamics.
International Journal of Biomathematics, 13(01),
2050006. https://doi.org/10.1142/S1793524520500060
Peter, O. J., Yusuf, A., Ojo, M. M., Kumar, S., Kumari, N.,
& Oguntolu, F. A. (2022). A Mathematical Model
Analysis of Meningitis with Treatment and Vaccination
in Fractional Derivatives. International Journal of
Applied and Computational Mathematics, 8(3), 117.
https://doi.org/10.1007/s40819-022-01317-1
Salomon, A., Berry, I., Tuite, A. R., Drews, S., Hatchette,
T., Jamieson, F., Johnson, C., Kwong, J., Lina, B., Lojo,
BICAME 2024 - Borneo International Conference
12

J., Mosnier, A., Ng, V., Vanhems, P., & Fisman, D. N.
(2020). Influenza increases invasive meningococcal
disease risk in temperate countries. Clinical
Microbiology and Infection, 26(9), 1257.e1-1257.e7.
https://doi.org/10.1016/j.cmi.2020.01.004
Sulma, S., Toaha, S., & Kasbawati, K. (2020). Stability
Analysis of Mathematical Models of the Dynamics of
Spread of Meningitis with the Effects of Vaccination,
Campaigns and Treatment. Jurnal Matematika,
Statistika Dan Komputasi, 17, 71–81. https://doi.org/
10.20956/jmsk.v17i1.10031
Türkün, C., Gölgeli, M., & Atay, F. M. (2023). A
mathematical interpretation for outbreaks of bacterial
meningitis under the effect of time-dependent
transmission parameters. Nonlinear Dynamics,
111(15), 14467–14484. https://doi.org/10.1007/s1
1071-023-08577-6
Varshney, K. G., & Dwivedi, Y. K. (2021). Mathematical
Modelling of Influenza-Meningitis under the
Quarantine effect of influenza.
Widyastuti, P., Utami, H. N., & Anugrah, M. F. (2023).
Meningitis Bakterial: Epidemiologi, Patofisiologi,
Penatalaksanaan. 2(2).
Wu, J. T., & Cowling, B. J. (2011). The use of mathematical
models to inform influenza pandemic preparedness and
response. Experimental Biology and Medicine, 236(8),
955–961. https://doi.org/10.1258/ebm.2010.010271
Zhou, X., & Guo, Z. (2012). Analysis of an influenza A
(H1N1) epidemic model with vaccination. Arabian
Journal of Mathematics, 1(2), 267–282. https://doi.org/
10.1007/s40065-012-0013-6
.
A Fractional Mathematical Model of Influenza: Meningitis Coinfection Using Caputo Derivatives
13
