
Forecast and Analysis for Samsung Stock Price Based on Machine
Learning
Wenjing Tu
a
School of Statistics, Jilin University of Finance and Economics, Jilin, China
Keywords: Stock Price Prediction, Logistic Regression, Support Vector Machine, Extreme Gradient Boosting.
Abstract: Predicting stock prices is an important area of research within finance, and selecting suitable machine learning
models is essential for enhancing prediction accuracy. This study seeks to assess and compare Logistic
Regression (LR), Support Vector Machine (SVM), and Extreme Gradient Boosting (XGBoost) regarding their
effectiveness in stock price forecasting, particularly emphasizing their advantages and limitations when
dealing with imbalanced datasets. By examining historical stock data sourced from Yahoo Finance, this
research measures the effectiveness of these three models based on accuracy, precision, and recall. The
findings indicate that the LR model achieves the highest overall performance, attaining an accuracy rate of
84%. In comparison, the SVM and XGBoost had lower performance, with accuracy rates of 81% and 70%,
respectively. These results provide empirical evidence for model selection in finance, emphasizing the
effectiveness of simple models when facing class imbalance. Future research will focus on ensemble
techniques and the integration of real-time data to improve forecasting accuracy and adaptability under
dynamic market conditions.
1 INTRODUCTION
Forecasting stock price fluctuations plays a crucial
role in the financial sector. As a leading global
technology company, Samsung's stock price volatility
not only directly reflects its market valuation
fluctuations but also has profound implications for the
entire technology industry and the global economy.
Therefore, accurately predicting the rise and fall of
Samsung's stock prices is crucial for investors and
market participants, as it can aid in optimizing
investment decisions and provide important insights
for market risk management.
With the rapid development of machine learning
technologies, selecting appropriate predictive models
has become a core challenge for enhancing prediction
accuracy. Stock price movements in the financial
market are affected by numerous factors, which adds
complexity to the prediction task (Kumar et al., 2021;
Usmani & Shamsi, 2021). Yelne et al. (2021)
investigated the use of guided machine learning
algorithms, including Random Forests (RF), Decision
Trees (DT), along Logistic Regression (LR), for
predicting stock values, revealing that regression
a
https://orcid.org/0009-0005-8375-1268
models are more accurate in forecasting stock prices.
Liu et al. (2016) found that LR and SVM models also
performed well in predicting the trends of the S&P
500 index, particularly with the use of the RBF kernel
in SVM. Furthermore, Wang et al. (2023) employed
XGBoost and long short-term memory (LSTM)
algorithms to predict the final prices for 25
companies, achieving a prediction accuracy of up to
99% with XGBoost. These studies demonstrate the
effectiveness of various models in stock price
prediction.
LR is often utilized in financial data analysis due
to its simplicity and interpretability. However,
XGBoost, being a collective learning approach, not
only performs exceptionally well in managing
intricate data but also demonstrates notable
interpretability (Carmona et al., 2022; Yang et al.,
2021). Nonetheless, its intricacy may pose challenges
for certain users in terms of understanding and
application compared to simpler models. SVM has
garnered attention for its effectiveness in high-
dimensional spaces, yet it may encounter
computational efficiency issues when dealing with
large-scale data (Cao & Lin, 2015). Therefore,
234
Tu, W.
Forecast and Analysis for Samsung Stock Price Based on Machine Learning.
DOI: 10.5220/0013213900004568
In Proceedings of the 1st International Conference on E-commerce and Artificial Intelligence (ECAI 2024), pages 234-238
ISBN: 978-989-758-726-9
Copyright © 2025 by Paper published under CC license (CC BY-NC-ND 4.0)
understanding the performance differences among
these three models is important for investment
decision-making. This study aims to utilize a real
stock market dataset to compare and evaluate the
predictive accuracy, precision, and recall of these
three models, with the hope of providing empirical
evidence for model selection in the financial domain.
The structure of this paper is organized as follows.
Section 2 introduces the dataset and outlines the
preprocessing methods applied. Section 3 presents the
experimental models and provides an analysis of the
results. Finally, Section 4 summarizes the findings
and discusses the study’s conclusions.
2 DATA AND METHOD
2.1 Data Collection and Description
The dataset employed in this research is retrieved
from Yahoo Finance’s historical stock data, with
specific details available in Table 1. Open represents
the price at which the stock begins its trading day,
while High indicates the peak price attained during
the session. Conversely, Low shows the minimum
price observed within the same session, and Close
marks the stock’s price when the trading day
concludes. The Adj Close value takes into
consideration adjustments such as cash payouts and
stock splits, providing a more accurate portrayal of
the stock’s true worth. Furthermore, Volume signifies
the entire number of shares exchanged throughout the
trading day, reflecting the level of market activity.
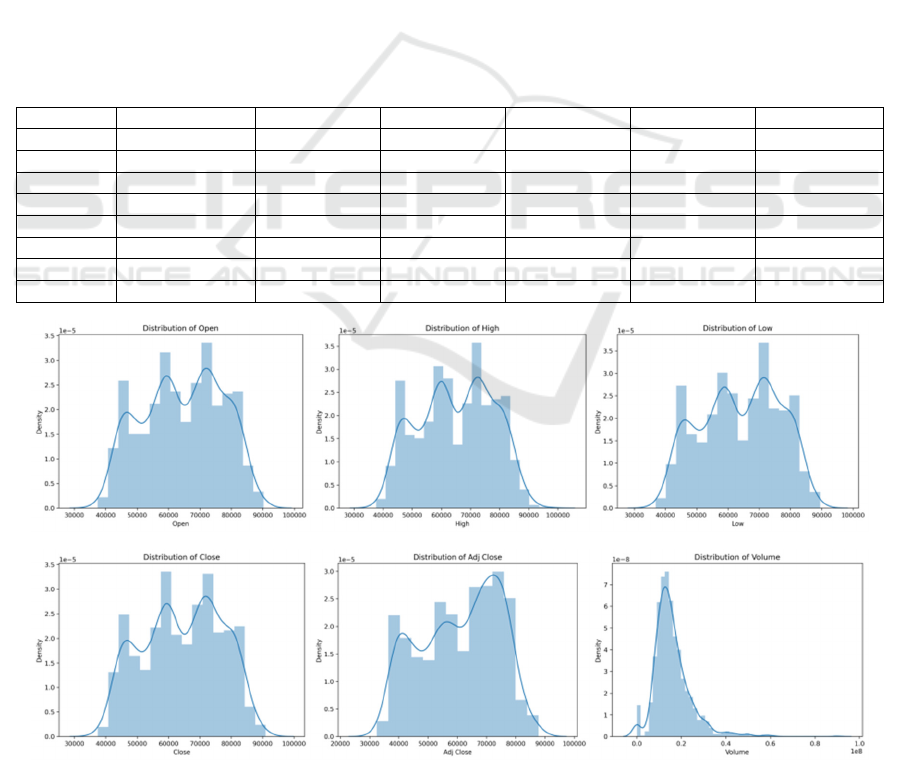
This study begins with an Exploratory Data
Analysis (EDA) of Samsung’s historical stock price
data to develop an initial understanding of the
dataset’s distribution and characteristics. Figure 1
presents the distribution patterns for the following
variables: opening value (Open), peak price (High),
lowest value (Low), end-of-day price (Close),
adjusted final price (Adj Close), and the number of
shares traded (Volume).
Table 1: Description of sample data.
O
p
en Hi
g
h Low Close Ad
j
Close Volume
count 1370.000000 1370.000000 1370.000000 1370.000000 1370.000000 1.370000E+03
mean 64429.197080 64987.226277 63832.116788 64387.299270 60855.500726 1.598891E+07
st
d
12492.575943 12560.151153 12405.131654 12461.450389 13443.892450 8.356224E+06
min 37450.000000 37600.000000 36850.000000 37450.000000 32495.349609 0.000000E+00
25% 55125.000000 55700.000000 54500.000000 55200.000000 49854.492188 1.103028E+07
50% 65200.000000 65650.000000 64700.000000 65150.000000 62718.103516 1.434703E+07
75% 74200.000000 74800.000000 73500.000000 74100.000000 72242.107422 1.906567E+07
max 90300.000000 96800.000000 89500.000000 91000.000000 87800.000000 9.030618E+07
(a) (b) (c)
(d) (e) (f)
Figure 1: Figure Caption Trends in sample data. (a) for the distribution of open, (b) for the distribution of high, (c) for the
distribution of low, (d) for the distribution of open, (e) for the distribution of adj close, (f) for the distribution of volume.
Forecast and Analysis for Samsung Stock Price Based on Machine Learning
235

From Figure 1, it is evident that the overall price
data displays a multi-peak distribution, indicating that
the market has gone through various phases and
experienced different price fluctuations. Meanwhile,
the trading volume distribution shows a clear left-
skewed characteristic, which means that the majority
of the trading volume is concentrated in the lower
range of values. The few high-volume records create
a long tail.
2.2 Data Pre-processing
During the data preprocessing phase, the study
guarantees the quality and relevance of the dataset
through several steps. Initially, the dates in the dataset
were converted from object format to datetime
format, simplifying subsequent analysis and testing.
Following this, the study addressed missing values by
using the SimpleImputer class with a mean fill
strategy, ensuring the integrity of the dataset.
Columns with missing data were populated using the
imputer.fit_transform() method to maintain data
consistency. To handle outliers, the Z-Score method
was applied, which filters outliers by setting specific
thresholds, reducing noise and improving the model
’s ability to capture real market trends. Furthermore,
a new column named Price_Up was added to the
dataset to signify changes in the current closing price
relative to the previous day’s price. This new feature
is created by comparing the closing prices over two
consecutive days: if the current closing price
surpasses that of the prior day, it is labeled as 1
(indicating a price rise); if it is equal to or lower, it is
marked as 0 (indicating either a decrease or stability).
This Boolean value is subsequently transformed into
an integer format to enhance its utility in further
model training. Finally, the study normalizes the data
by scaling the values between 0 and 1, ensuring
balanced feature contributions during the model
training phase.
2.3 Logistic Regression
Logistic Regression (LR) is a commonly utilized
classification algorithm, particularly effective for
binary classification tasks. It achieves category
prediction by mapping the output of a linear function
to a probability between 0 and 1. Due to its simplicity
and interpretability, the LR model is particularly
effective for binary classification. In this study, the
LR model is used to predict the rise and fall of the
closing price of Samsung stock, demonstrating that
the model can efficiently perform this task and
provide a reliable basis for further analysis and
decision-making. The prediction from the LR model
can be represented as:
𝑃
𝑌=1
|
𝑋
=
1
1+𝑒
⋯
1
In this context, P(Y = 1|X) is the likelihood that
the sample belongs to the positive category (i.e. Price
Up = 1 in this study); w
is the bias term;
w
,w
...w
are the weights of the corresponding
features x
,x
...x
are the weights of corresponding
features x
,x
...x
; x
,x
...x
are the input feature
variables; With the Maximum Likelihood Estimation
(MLE) method, these weighting parameters w can be
optimized to minimize the prediction error.
2.4 Support Vector Machine
During the data preprocessing phase, the study SVM
are powerful classification and regression algorithms
aimed at maximizing the separation among various
classes of data points by identifying an optimal
hyperplane. The Support Vector Classifier (SVC)
used in classification tasks is based on the principles
of SVM theory. SVC is suitable for both linearly and
non-linearly separable cases by introducing kernel
methods. In this paper, the SVC model is employed
to forecast the price movements (Price Up) of
Samsung shares. The prediction from the SVC model
can be represented as:
𝑓
(
𝑥
)
= 𝑠𝑖𝑔𝑛𝛼
𝑦
𝐾
(
𝑥
, 𝑥
)
+ 𝑏
(
2
)
In this context, K(x
,x) represents the kernel
function, which is used to compute the support vector
and the similarity between the new sample x
and 𝑥.
Commonly utilized kernel functions encompass
linear kernel, polynomial kernel, and radial basis
function (RBF); a
is the Lagrange multiplier, which
represents the weight of the support vector, and is
non-zero only on the support vector. y
is the actual
label of the sample x
, which takes the numerical
representation of +1 or -1; 𝑏 is the bias term, which is
used for adjusting the position of the decision
boundary; and the sign of the decision function
dictates the classification outcome of the new sample
x, which is predicted to belong to the positive class or
the negative class.
2.5 Extreme Gradient Boosting
Extreme Gradient Boosting (XGBoost) is an
improved gradient learning algorithm, a boosting
method, which transforms many weak classifiers into
ECAI 2024 - International Conference on E-commerce and Artificial Intelligence
236
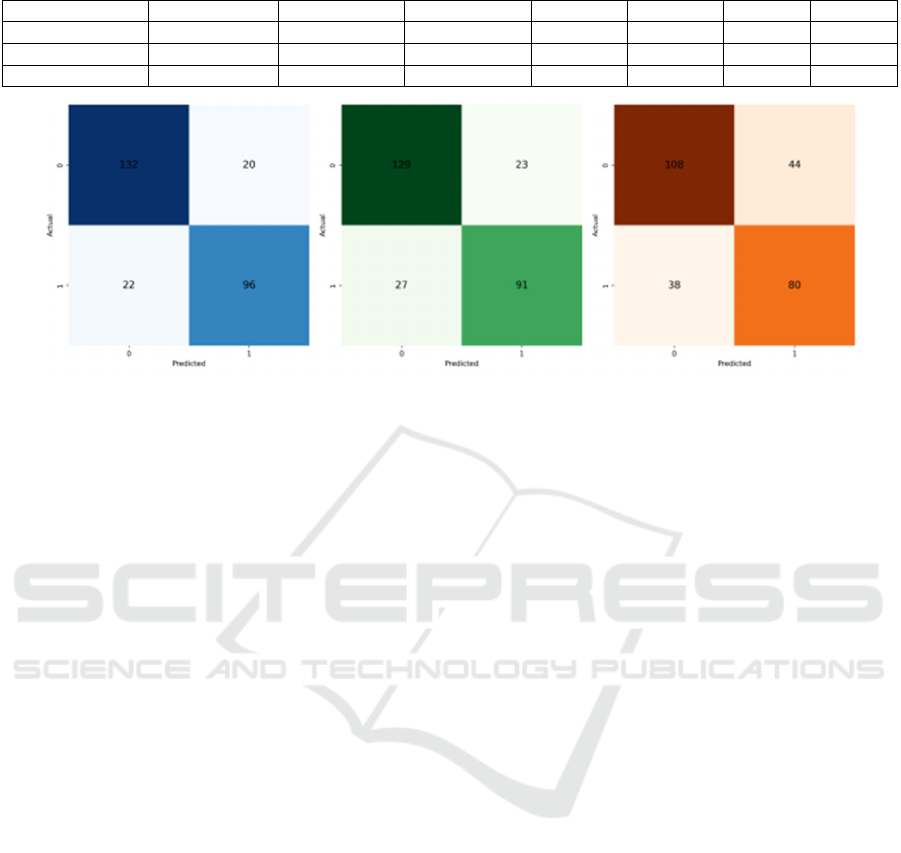
Table 2: Results of different models.
Model Accurac
y
Precision
(
0
)
Precision
(
1
)
Recall
(
0
)
Recall
(
1
)
F1
(
0
)
F1
(
1
)
LR 84% 86% 83% 87% 81% 86% 82%
SVM 81% 83% 80% 85% 77% 84% 78%
XGBoost 70% 74% 65% 71% 68% 72% 66%
(a) (b) (c)
Figure 2: Confusion Matrix. (a) for the LR confusion matrix, (b) for the SVC confusion matrix, (c) for the XGBoost confusion
matrix.
strong classifiers through iterative operations to
achieve accurate classification results (Jiang et al.,
2021). XGBoost is well-known for its capability to
manage extensive datasets, complex features, and
intricate relationships. The predictions generated by
the XGBoost model can be represented as:
𝑓
(
𝑥
)
= ℎ
(
𝑥
)
(
3
)
In this context, 𝐾 denotes the quantity of decision
trees in the framework; h
(x) denotes the predicted
value of input x from the kth tree; the model gradually
reduces the error function to form the final prediction
through continuous iteration and optimisation.
3 EXPERIMENT RESULTS
3.1 Comparison of Results
This research utilizes various evaluation metrics, such
as accuracy, precision, recall, and F1-score. Here, the
positive class signifies cases where the stock price has
risen, while the negative class represents instances
where the stock price has declined. The outcomes of
the experiments are detailed in Table 2.
The findings from the experiments carried out in this
research are outlined in Table 2. The analysis reveals
that LR demonstrates the best overall performance,
with an accuracy of 84%. For the negative class, it
achieves a precision of 86%, a recall rate of 87%, and
an F1-score of 86%. On the other hand, for the
positive class, the model records a precision of 83%,
a recall rate of 81%, and an F1-score of 82%. This
suggests that LR offers strong stability and integrated
capability in classification tasks, especially for the
negative class (category 0). In contrast, SVM attains
an accuracy of 81%, which is 3% less than LR. Its
precision is 83%, recall is 85%, and its F1-score is
84%, slightly lower than LR by 2%. Overall, SVM’s
accuracy in identifying negative samples is slightly
less than that of LR, yet its metrics for the negative
class remain reliable and consistent. XGBoost
exhibits the lowest overall accuracy of 70% and also
ranks the lowest in precision, recall, and F1-score,
indicating weaker performance in classifying the
positive class (category 1). This result suggests that
XGBoost encounters challenges with this dataset.
Overall, LR outperforms the other models across
various metrics, making it more suitable for the
current data and the classification prediction task at
hand.
3.2 Analysis of Results
The findings illustrated in Figure 2 indicate that the
LR model excels in accurately identifying correct
positive and negative predictions, resulting in the
lowest number of misclassifications. This reduction
includes fewer instances of both false positives and
false negatives, emphasizing its high accuracy,
particularly in classifying negative cases. The SVM
model, while slightly underperforming compared to
LR, still shows competence in identifying correct
positive and negative outcomes, albeit with a
Forecast and Analysis for Samsung Stock Price Based on Machine Learning
237

marginally higher error rate. Conversely, the
XGBoost model shows the poorest performance in
this classification task, especially with an increased
occurrence of false positives and false negatives,
implying that it may have overfit the model and
resulted in subpar performance on the test data.
The findings indicate that the LR model
demonstrates superior overall performance in the
binary prediction task for stock price movements,
particularly regarding the balance of precision and
recall. In contrast, the SVM model performs better at
identifying majority class samples (negative
samples). However, it performs poorly when dealing
with minority class samples (positive samples) and
may not be suitable for cases of class imbalance. The
XGBoost model, although typically strong in dealing
with complex categorization tasks, performs slightly
less well than LR in this study, which may be due to
excessive model complexity and overfitting. These
results reveal that simple models such as LR may be
more effective for predicting stock price movements,
especially when the dataset is relatively balanced or
when balancing precision and recall is necessary. At
the same time, it also reminds researchers to consider
the attributes of the dataset and the flexibility of the
model when selecting the model to ensure optimal
prediction results.
4 CONCLUSIONS
Stock price forecasts are vital in financial markets,
aiding investors in making informed decisions,
mitigating risks, and enhancing returns on
investment. Understanding and managing market
volatility are also crucial for the stable growth of
financial markets. This research applies three models
- LR, SVM, and XGBoost - to predict Samsung’s
stock price fluctuations. The experimental results
demonstrate that LR provides the best performance in
binary classification tasks, particularly in terms of
balancing accuracy and recall. In contrast, the SVM
model shows proficiency in recognizing the majority
class (negative samples) but struggles with minority
class (positive samples) identification, making it less
effective in situations of class imbalance. The
XGBoost model, typically strong in complex
categorization tasks, slightly underperformed
compared to LR in this study, potentially due to
excessive model complexity leading to overfitting.
Overall, this paper underscores the importance of
model selection in stock price prediction by analyzing
the efficacy of different models. Future studies could
focus on optimizing model selection, exploring more
sophisticated and diverse data to improve the
accuracy and reliability of forecasting. The findings
of this study offer empirical evidence supporting
intelligent forecasting in financial markets and
suggest new directions for advancing machine
learning models within the financial sector.
REFERENCES
Cao, J., Lin, Z., 2015. Extreme learning machines on high
dimensional and large data applications: A survey.
Mathematical Problems in Engineering, 2015(1),
103796.
Carmona, P., Dwekat, A., Mardawi, Z., 2022. No more
black boxes! Explaining the predictions of a machine
learning XGBoost classifier algorithm in business
failure. Research in International Business and Finance,
61, 101649.
Jiang, Y. Q., Cao, S. E., Cao, S., Chen, J. N., Wang, G. Y.,
Shi, W. Q., Chen, G. H., 2021. Preoperative
identification of microvascular invasion in
hepatocellular carcinoma by XGBoost and deep
learning. Journal of Cancer Research and Clinical
Oncology, 147, 821-833.
Kumar, G., Jain, S., Singh, U. P., 2021. Stock market
forecasting using computational intelligence: A survey.
Archives of Computational Methods in Engineering,
28(3), 1069-1101.
Liu, C., Wang, J., Xiao, D., Liang, Q., 2016. Forecasting
S&P 500 stock index using statistical learning models.
Open Journal of Statistics, 6(6), 1067-1075.
Usmani, S., Shamsi, J. A., 2021. News sensitive stock
market prediction: Literature review and suggestions.
PeerJ Computer Science, 7, e490.
Wang, J., Cheng, Q., Dong, Y., 2023. An XGBoost-based
multivariate deep learning framework for stock index
futures price forecasting. Kybernetes, 52(10), 4158-
4177.
Yang, C., Chen, M., Yuan, Q., 2021. The application of
XGBoost and SHAP to examining the factors in freight
truck-related crashes: An exploratory analysis.
Accident Analysis & Prevention, 158, 106153.
Yelne, A., Theng, D. 2021. Stock prediction and analysis
using supervised machine learning algorithms. In 2021
International Conference on Computational
Intelligence.
Zhou, S., 2021. Sparse SVM for sufficient data reduction.
IEEE Transactions on Pattern Analysis and Machine
Intelligence, 44(9), 5560-5571.
ECAI 2024 - International Conference on E-commerce and Artificial Intelligence
238
