
Forecasting of Share Prices Based on Hybrid Model of CNN and
LSTM: A Multi-Factor Approach
Jialin Tian
a
Department of Beijing-Dublin International College, Beijing University of Technology, Beijing, China
Keywords: CNN-LSTM, Stock Price Prediction, Deep Learning, Financial Forecasting, Time Series Analysis.
Abstract: As a matter of fact, hybrid models are widely adopted in pricing models contemporarily. This study uses a
hybrid Convolutional Neural Network-Long Short-Term Memory (CNN-LSTM) model to investigate price
prediction for stocks, taking macroeconomic and technical indicator effects into account. The dataset includes
40 medical device firms' daily stock values from January 2022 to August 2024. Upon completing training and
optimization, the model demonstrated its ability to accurately identify brief variations in stock prices and
forecast the closing price of the stock market for the upcoming day by utilizing five days' worth of pertinent
data. The model's Mean Absolute Percentage Error (MAPE) is 6.53%, its Root Mean Square Error (RMSE)
is 4.95, and its Adjusted R² is 0.9968. However, when the model encounters an extremely high range of stock
prices (500-700), its accuracy decreases as the true stock price increases. Future research may aim to enhance
stock price prediction especially when experiencing very high share prices and expand the dataset in multiple
sections to improve generalizability. This research investigates the utility of CNN-LSTM models in guiding
investors to more accurately predict stocks in the healthcare sector (after epidemic), providing relevant
references for future research.
1 INTRODUCTION
Traditional approaches to stock price prediction
focused on statistical techniques like ARIMA and the
moving average method in time series analysis (Ma,
2020). These techniques were grounded in historical
price data and assumed that the market was stable
enough for price fluctuations to be forecasted through
linear regression and statistical methods. However,
the growing complexity and volatility of modern
financial markets have exposed the limitations of
these methods, which struggle to address nonlinear
relationships and sudden market shifts (Ma, 2020;
Sherstinsky, 2020).
With the progress of computer hardware and
software technologies, as well as the ongoing
enhancement of deep learning models, the
significance and reputation of deep learning models
in stock price forecasting have grown substantially
starting from the 1990s. The reason for this is because
these models have robust computational, data
processing, and forecasting skills, which allow them
to attain superior accuracy in time series forecasting
a
https://orcid.org/0009-0007-8222-2561
within the financial industry. Neural networks,
particularly multilayer perceptions (MLPs), were
among the first models used to capture nonlinearities
in the stock market. With the advancement of the
field, researchers acknowledged the constraints of
conventional feed-forward networks in time series
forecasting. This recognition prompted the
development of recurrent neural networks (RNN) and
long-short-term memory (LSTM) networks, which
are more effective in capturing long-term
relationships (Hochreiter & Schmidhuber, 1997).
Indeed, hybrid models that integrate
Convolutional Neural Networks (CNNs) and Long
Short-Term Memory (LSTMs) have garnered
significant attention and have found extensive use
within the domain of economic projections. They
have their own properties, with CNNs being good at
recognizing spatial patterns and LSTMs being
suitable for time series processing (Houdt et al.,
2020). The combination of the two models
complements each other, and researchers are
currently utilizing these combined models since their
222
Tian, J.
Forecasting of Share Prices Based on Hybrid Model of CNN and LSTM: A Multi-Factor Approach.
DOI: 10.5220/0013213700004568
In Proceedings of the 1st International Conference on E-commerce and Artificial Intelligence (ECAI 2024), pages 222-228
ISBN: 978-989-758-726-9
Copyright © 2025 by Paper published under CC license (CC BY-NC-ND 4.0)

objective is to enhance the precision and resilience of
financial market predictions (Wu et al., 2021).
Although a review study by Greg Van Houdt et al.
proposed the use of Vanilla LSTM, which is the basic
form of the LSTM, for time series tasks has the best
performance (Houdt et al., 2020). The fact is that the
CNN-LSTM model has been widely adopted and
researched for stock price forecasting and has
achieved an exceptional degree of precision. In the
study conducted by Lu et al., this integrated model
shown superior accuracy and performance compared
to other models including Recurrent Neural Network
(RNN), CNN, Multilayer Perceptron (MLP), LSTM,
and CNN-RNN (Lu et al., 2020). In addition to this,
Can Yang and colleagues have demonstrated that the
model also achieves better results after ranking stock
indices using the PPMCC (which is a statistical
measure called Pearson Product Moment Correlation
Coefficient) prior to training (Yang et al., 2020).
Firuz et al. used data from ten major U.S. companies
over a ten-year period, and Jimmy Ming-Tai Wu et al.
applied to ten stocks in the U.S. and Taiwan, and both
studies achieved good forecasting results (Kamalov et
al., 2021; Wu et al., 2021). Moreover, augmenting the
model by denoising historical stock data through
wavelet transform or integrating the attention
mechanism can further improve its ability to detect
key patterns, thereby increasing its accuracy (Qiu et
al., 2020). In addition, it has been shown that hybrid
models that incorporate both technical and
macroeconomic indicators tend to capture a wider
range of factors affecting stock prices, leading to
better results.
This paper is inspired by Widodo Budiharto's
research, which utilized R programming and LSTM
models to analyse stock price predictions in Indonesia
throughout the COVID-19 period (Widodo et al.,
2021). After the country’s first confirmed COVID-19
case on March 2, 2020, Indonesia's Benchmark Stock
Index dropped sharply by 28% before next year.
Widodo’s work employed big data provided by
Yahoo Finance, targeting major banks, specifically
Bank Central Asia (BCA) and Bank Mandiri. His
experiments showed that data science and LSTM
models were highly effective at predicting key market
prices, including the opening, highest, lowest, and
closing figures (OHLC), with an accuracy rate of
94.57%. Building on the demonstrated effectiveness
of LSTM models for short-term stock prediction, this
study seeks to apply a similar methodology in a
different context. The primary target is to predict the
next-day closing prices for 40 stocks in the medical
device sector, using data from yfinance started at
January 1, 2022, to the present (August, 2024). The
goal is to gain insight into stock price trends in a post-
pandemic market environment, particularly in an
industry that has been heavily impacted by pandemic.
The rest part of the paper is organized as follows. The
Sec. 2 covers the data collection process, stock
selection, preprocessing, and CNN-LSTM model
architecture. Sec. 3 displays the results of model
predictions, incorporating performance metrics and
contrasting them with other models. Sec. 4
summarizes key findings, conclusions, and directions
for further studies.
2 DATA AND METHOD
This study utilizes data from Yahoo Finance,
focusing on 40 companies in the medical device
sector. The records spans at January 1, 2022, to
August 25, 2024, offering an evaluation of stock
market movements in the aftermath of the COVID-19
crisis. The yfinance Python module was utilized to
acquire the data. It provides daily stock price
indications, such as open, high, low, close, volume,
and other financial-related details. Technical
indicators, including Stochastic Oscillator Indicator
(KDJ), Moving Average Convergence Divergence
(MACD), Relative Strength Index (RSI), Bollinger
Bands, and moving averages, were calculated through
the stockstats library.
The dataset comprises both independent variables
and a dependent variable (the stock's closing price).
The independent variables encompass a range of
stock-related data, including opening price, highest
and lowest price, as well as trading volume. In
addition, financial ratios such as market
capitalization, PB ratio, and PS ratio were considered.
Furthermore, the analysis included technical
indicators such as moving averages, RSI, and MACD.
All of these variables were employed in forecasting
the closing price for the following trading day.
To facilitate the development of the model, the
dataset was divided into three distinct segments: Only
70% of the dataset was allocated to the training set,
while the remaining 15% was reserved for validation,
and testing received the remaining 15%. The
validation dataset was utilised to fine-tune the
hyperparameters of the approach, while the training
phase facilitated the model's learning process. Lastly,
the test set served as a foundation for assessing the
model's overall effectiveness. The data were
standardized using the MinMaxScaler function to
increase the model's efficacy and prevent scaling
discrepancies. By combining stock prices, technical
indicators, and financial ratios, the dataset provides
Forecasting of Share Prices Based on Hybrid Model of CNN and LSTM: A Multi-Factor Approach
223
comprehensive input for this model, with the closing
price as the target variable.
This thesis uses a hybrid CNN-LSTM model to
forecast the precise increase and fall of healthcare
businesses' closing prices for the upcoming day. In
order to handle the historical data with extra
activation functions first, a convolutional layer is
added before the LSTM input layer, which is
commonly employed for long-term or short-term time
series prediction applications. While the LSTM layer
manages the temporal consistency of the stock price
and acquires knowledge of the relationships over time
in order to consistently generate an improved
prediction, the CNN component gathers relevant
features from the stock data.
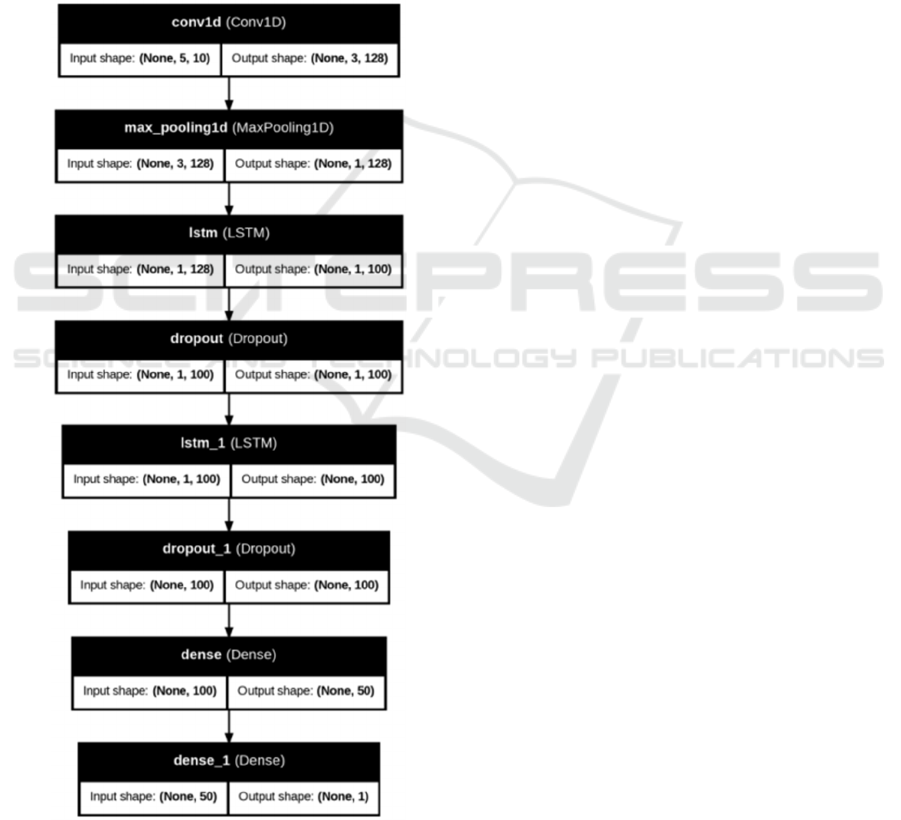
Figure 1: CNN-LSTM Model Architecture (Photo/Picture
credit: Original).
The ephemeral loss diagram (Fig. 1) illustrates
that the CNN-LSTM model architecture used in this
work is made up of a number of essential elements.
The Conv1D layer, which has 64 filters and a kernel
size of three, is the first layer in the model. Its job is
to extract localized patterns from the input data,
including short-term trends in stock prices. The
MaxPooling1D layer, which lowers the
dimensionality of the data while maintaining
important characteristics, comes next. Two stacked
LSTM layers are placed after this. The 50-cell first
LSTM layer sends its output sequence to the second,
likewise 50-cell LSTM layer. The purpose of these
layers is to extract long-term relationships from the
stock price data. An additional culling layer with a
culling rate of 0.5 is included after each LSTM layer
to enhance the model's generalisation and mitigate
overfitting. The final layer consists of two thick
layers: one with one unit for stock closing price
prediction and the other with 25 units triggered using
ReLU.
A number of crucial parameters were defined
during the construction of the model. The Adam
optimiser was employed to adaptively modify the
weights of the model during training, with a learning
rate of 0.00001. An optimal batch size of 32 was
selected to achieve a harmonious equilibrium
between the speed of training and the performance of
the model. In order to avoid overfitting, the model
was trained for a maximum of 100 epochs and early
stopping was implemented based on the validation
loss. Furthermore, a dropout rate of 0.5 was applied
to mitigate the potential for overfitting, a critical
concern for intricate models such as CNN-LSTM.
The performance of the CNN-LSTM model was
evaluated using many well-established metrics often
employed in regression tasks. The MSE was
employed as the loss function during training to
quantify the means squares differences between the
real and predicted stock prices. For enhanced
understanding of the model's performance, the Root
Mean Square Error (RMSE) was computed and
expressed in the same units as stock prices. The
accuracy of the predictions was evaluated using the
Mean Absolute Percentage Error (MAPE), which
quantifies the error as a percentage relative to the
actual data. Furthermore, the model's capacity to
elucidate fluctuations in stock prices was evaluated
using the R-squared (R²) measure; higher R² values
indicate a stronger correspondence. Using a different
test dataset, these measures were used to verify the
model. To provide further light on the accuracy and
resilience of the model, visual comparisons of actual
ECAI 2024 - International Conference on E-commerce and Artificial Intelligence
224
and projected stock prices, learning curves, and
residual analyses were also carried out.
3 RESULTS AND DISCUSSION
3.1 Model Performance
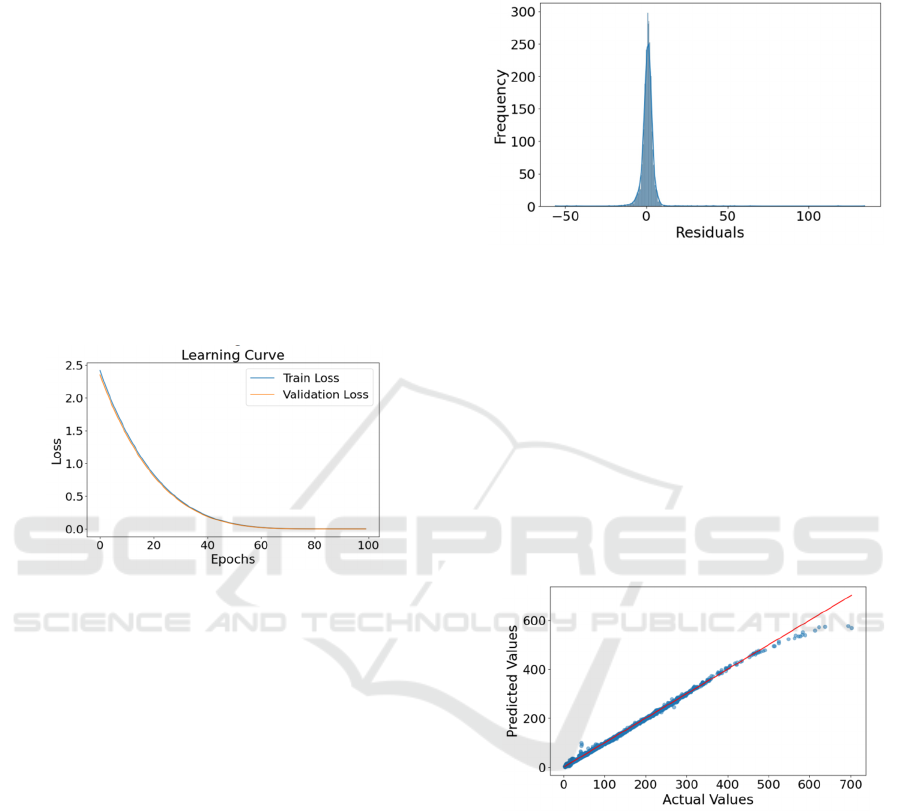
This study assessed the CNN-LSTM model's
forecasting capability using a number of indicators
and visualization tools. The training loss and
validation loss both exhibit a smooth and continuous
lower trend as the calendar time advances, as seen in
Fig. 2, indicating that the model has suitably
converged. By the 100th calendar element, the loss
value approaches zero; this is a good indication that
the model has effectively learned the basic patterns in
the dataset without overfitting.
Figure 2: Loss over epochs graph (Photo/Picture credit:
Original).
The average magnitude of the prediction error is
shown by the model's RMSE, which is 4.9518.
Furthermore, the Mean Percentage Error (MPE) of
2.4380 shows that there is not much of an absolute
difference between the actual and anticipated stock
values. Additionally, the model's MAPE reached
6.53% indicates that, on average, the model's
predictions deviate from the actual values by
6.53%—a relatively small amount for stock price
projections. The model's excellent prediction
accuracy is further supported by its high Adjusted R²
score is up to 0.9968, which indicates that practically
the model captures the entirety of the volatility in
stock prices.
Furthermore, it can be seen from the residual
distribution plot (shown in Fig. 3) that the majority of
the residuals are concentrated around zero,
demonstrating an adequate relationship among the
actual share prices and the projections made by the
model. A small number of residuals, on the other
hand, differ noticeably from zero, suggesting that
there may be some extreme situations or outliers
where the predictions of the model are relatively
inaccurate. However, the distribution as a whole
shows that the model works well throughout the full
dataset.
Figure 3: Residuals Distribution plot (Photo/Picture credit:
Original).
The scatter plot of anticipated against real values
(as illustrated in Fig. 4) illustrates the link between
expected and actual stock prices, which may be
employed to conduct an additional evaluation of the
model's precision. The diagonal reference line is
where the majority of the dots are closely packed,
suggesting a strong connection between the
anticipated and actual values. The plot's linearity
suggests that the system is capable of effectively
represent the general pattern of changes in stock
prices.
Figure 4: Scatter Plot of Predicted vs Actual Values
(Photo/Picture credit: Original).
In conclusion, the depiction of residuals vs
forecasts in Fig. 5 provides a more detailed
representation of the forecast errors. The residuals
stay around zero for lower expected stock prices.
Nonetheless, the residuals tend to become more
evenly distributed for higher anticipated values,
indicating a decline in the model's prediction
accuracy for higher stock prices. This observation
suggests a common problem with financial time
sequence information: the model's limited capacity to
extrapolate significant price fluctuations.
Forecasting of Share Prices Based on Hybrid Model of CNN and LSTM: A Multi-Factor Approach
225

Figure 5: Predicted vs Actual Values (Photo/Picture credit:
Original).
The model's accuracy of 75.20 percent within a
5% tolerance is established by the fact that over 75%
of the forecasts fall within a 5% range of the actual
stock price. This observation implies that the model
achieves consistent performance in most situations.
3.2 Explanation and Implication
The model's outcomes demonstrate how well the
hybrid CNN-LSTM architecture predicts stock
values, particularly in the healthcare industry. The
model's promise for short-term stock price prediction
is highlighted by its ability to decrease forecast error
while retaining high accuracy. The model's ability to
identify relevant patterns in stock price changes is
attributed to the seamless integration of CNN's spatial
feature extraction skills with LSTM's expertise in
continuous data processing. This makes the model an
effective tool for financial research. Specifically, the
model's remarkable RMSE and MAPE values suggest
that it is a good fit for situations requiring precise
short-term forecasting.
The residual distribution shows that the model
performs consistently over the majority of data
points, which is one of the analysis's most significant
conclusions. This consistency shows that the CNN-
LSTM model is successful in identifying regular price
trends in the dataset and accurately indicates the
fundamental patterns influencing stock prices. This
success is mostly attributable to the model's
architecture, which makes use of CNN's capacity to
recognize spatial characteristics in stock prices and
LSTM's potency in capturing long-term relationships.
As a consequence, the model functions admirably
under typical market circumstances and develops into
a trustworthy instrument for stock trend prediction.
However, the research also points to several
drawbacks. More specifically, at the high end of the
expected values, the residuals exhibit wider spreads,
indicating that the model has difficulty properly
capturing significant price fluctuations. This
weakness might be caused by a number of things. One
potential limitation of the algorithm is its confined
ability to generalise to significant price fluctuations if
the training data lacks enough instances of such
occurrences. Second, a wide range of unpredictably
occurring external variables can affect stock markets,
including shifts in investor attitude, changes in
economic policy, and international occurrences like
natural catastrophes or geopolitical conflicts. These
variables provide a level of unpredictability that is
challenging for any model to accurately forecast.
The model's incapacity to precisely represent the
sharp variations in the market offers a chance for
additional improvement. Forecast accuracy becomes
more crucial for traders and investors in extremely
turbulent markets since misjudging price changes can
result in large losses. On such situations, the
functioning of the mathematical framework can be
improved by incorporating supplementary
techniques. An attention mechanism, for instance,
might be used to assist the model in concentrating on
the most important aspects of the data, improving its
ability to handle times of extremely high or low price
volatility. The attention method helps the model
prioritize the elements most likely to create volatility
in stock prices by giving more weight to more
relevant data items. Furthermore, to offer a more
comprehensive knowledge of price volatility in the
model, more sophisticated volatility modeling
approaches like GARCH (which is as know as the
Generalized Autoregressive Conditional
Heteroskedasticity) or stochastic volatility models
can be incorporated. In turbulent markets, these
strategies are a perfect complement to the CNN-
LSTM framework since they are made to account for
the degree of volatility over time. The hybrid
architecture can become more beneficial for traders in
extremely volatile areas by including these models
and perhaps producing better predictions for extreme
market circumstances.
Practically speaking, the study's findings
demonstrate that while the CNN-LSTM model does a
great job of tracking ordinary stock price patterns,
more work is obviously required to solve the model's
shortcomings in harsh circumstances. Accurate
forecasting is essential in the quickly evolving
financial markets, particularly in those that are
extremely vulnerable to external shocks. Better
models that perform effectively in the face of
significant market disruptions as well as consistently
anticipating typical swings in stock prices would be
beneficial to traders and investors.
ECAI 2024 - International Conference on E-commerce and Artificial Intelligence
226

In summary, the CNN-LSTM model shows a lot
of promise for stock price prediction, particularly in
sectors like healthcare where regular patterns may be
noticed. However, the model would benefit from the
inclusion of more sophisticated strategies like
attention processes and volatility-specific models in
order to reach its full potential, particularly in
turbulent markets. Enhanced management of
challenging market conditions might enhance the
effectiveness of the model as a tool for buyers and
sellers, enabling them to more effectively mitigate
risk and make more informed decisions in volatile
market settings.
3.3 Limitation and Prospects
Future research must address several shortcomings of
the CNN-LSTM model despite its outstanding
prediction performance. First, although while the
model's modified R ² score of 0.9968 and decent
MAPE of 6.53% are remarkable, its accuracy falls to
75.20% within a 5% tolerance, suggesting that the
model has trouble with extremely high market
volatility. This is in line with the 4.9518 root mean
square error, which suggests a significant error rate in
outlier prediction. To better control abrupt market
spikes, future research should examine sophisticated
volatility modeling methods like GARCH or
stochastic volatility models. Furthermore, employing
hybrid models or ensemble techniques like XGBoost
or Random Forest may help increase the accuracy of
forecasts for turbulent markets.
Second, the study's dataset only covers the years
2022–2024, which would restrict how broadly the
model can be applied to other market scenarios or
longer time horizons. To enhance the testability of the
framework, it would be beneficial to broaden the
dataset to encompass a more extensive spectrum of
economic cycles, including both bullish and bearish
markets. Furthermore, the forecast accuracy of the
model may be increased by adding macroeconomic
data like inflation, interest rates, or global indices,
particularly for sectors like healthcare and real estate
that are sensitive to changes in the economy.
Ultimately, investigating other deep learning
architectures can enhance performance even more,
even though CNN-LSTM models are good at
identifying transient patterns. More intricate long-
term relationships that CNN-LSTM could overlook
might be captured by models like morphers or graph
neural networks (GNN). Furthermore, attention
methods may be employed to allow models to focus
on the key elements of the input procedure, thereby
improving performance in industries such as online
shopping where price fluctuations or non-linear
variations are frequent.
4 CONCLUSIONS
To sum up, an amalgamated CNN and LSTM model
is employed to forecast stock values within the
healthcare industry. Within a multifactor analysis, the
model takes into account both technical and
macroeconomic factors. The results showed that this
hybrid model effectively captures short-term stock
price fluctuations, the RMSE is 4.9518, MAE
reaching 2.4380, and MAPE stood at 6.53%. The
model also achieved an Adjusted R² score of 0.9968,
reflecting its strong predictive capability. The scatter
and residual plots demonstrated the performance of
tracking most price trends, showcasing its reliability
in managing regular stock market variations.
Nevertheless, the model's accuracy, at 75.20% within
a 5% margin, revealed challenges in predicting
extreme price shifts, highlighting the need for
improvements in volatility handling. Future research
could incorporate attention mechanisms and larger
datasets to improve the model’s performance in
volatile market environments. Ultimately, this work
improves financial forecasting by showcasing the
effectiveness of CNN-LSTM models in predicting the
future trajectory of stock values, therefore offering
precise value and significant insights to market
analysts and investors.
REFERENCES
Budiharto, W., 2021 Data science approach to stock prices
forecasting in Indonesia during Covid-19 using Long
Short-Term Memory (LSTM). Journal of Big Data, 8(1).
Hochreiter, S., Schmidhuber, J., 1997. Long short-term
memory. Computation MIT-Press.
Houdt, G. V., Mosquera, C., Nápoles, G., 2020. A review
on the long short-term memory model. Artificial
Intelligence Review, 53(8), 5929-5955.
Kamalov, F., Gurrib, I., Rajab, K., 2021. Financial
Forecasting with Machine Learning: Price Vs Return.
Journal of Computer Science, 17(3), 251-264.
Lu, W., Li, J., Li, Y., Sun, A., Wang, J., 2020. A CNN-
LSTM-Based Model to Forecast Stock Prices.
Complexity, 2020(1), 6622927.
Ma, Q., 2020. Comparison of ARIMA, ANN and LSTM for
Stock Price Prediction. E3S Web of Conferences, 218,
01026.
Qiu, J., Wang, B., Zhou, C., 2020. Forecasting stock prices
with long-short term memory neural network based on
attention mechanism. PLOSone, 15(1), e0227222.
Forecasting of Share Prices Based on Hybrid Model of CNN and LSTM: A Multi-Factor Approach
227

Sherstinsky, A., 2019. Fundamentals of recurrent neural
network (rnn) and long short-term memory (lstm)
network. Physica D: Nonlinear Phenomena, 404.
Wu, J. M., Li, Z., Herencsar, N., Vo, B., Lin, J. C., 2021. A
graph-based CNN-LSTM stock price prediction
algorithm with leading indicators. Multimedia
Systems, 29(3), 1751-1770.
Yang, C., Zhai, J., Tao, G., 2020. Deep learning for price
movement prediction using convolutional neural
network and long short
‐
term memory. Mathematical
Problems in Engineering, 2020(1), 2746845.
Zong, X., 2020. Mlp, cnn, lstm and hybrid svm for stock
index forecasting task to indu and ftse100. SSRN
Electronic Journal, available at SSRN 3644034.
ECAI 2024 - International Conference on E-commerce and Artificial Intelligence
228
