
Stock Price Prediction Based on LSTM-GBM: Evidence from Haier
Smart Home
Zimo Li
School of Mathematical Sciences, Ocean University of China, Qingdao, China
Keywords: Sock Price Prediction, Deep Learning, LSTM, GBM.
Abstract: In the past few years, stock prices forecasting has been a hot topic due to the non-linear relationships and the
uncertainty of the stock prices. In the meantime, machine learning, especially deep learning method, has made
great progress. More and more studies show that machine learning models might capture features that are
hard for traditional methods to observe, which means these models might be more apposite for forecasting
time series. A new model named LSTM-GBM is designed to forecast the share prices of Haier Smart Home.
The long short-term memory (LSTM) model is responsible for giving a specific prediction while the
Geometric Brownian Motion (GBM) model is in charge of adding uncertainties to the predictions. The final
prediction path will be generated through a filtrating mechanism, which makes a secondary screening of the
two models. In addition, a possible upgrading model named LSTM-GBM-LSTM is proposed which is adding
a LSTM model after the filtrating mechanism. This thesis compares the performances of LSTM-GBM model
with LSTM model, GBM model and LSTM-GBM-LSTM model. The results indicate that LSTM-GBM has
made the best prediction. These results suggest that it is feasible to project the stock price through LSTM-
GBM model. Besides, more effort is needed to improve the performance of LSTM-GBM-LSTM model.
1 INTRODUCTION
Equity price forecast is the process of making
judgement about future stock price movements based
on historical indices such as market data. Stock price
market is an essential component of the economy
(Zhang et al., 2023). Generally, stock prices are
influenced by company conditions, economic
environments, market situations and external events
(Ji et al., 2021). Due to the huge economic impact on
individuals and the challenge of processing non-
linear data, stock price prediction is a topic worth
discussing (Wang et al., 2021).
Contemporarily, a lot of methods are introduced
in the stock market, but many traders and researchers
mainly focus on machine learning method. Compared
with traditional approaches, using machine learning
methods is more likely to interpret the extract
information from the data (Mahesh, 2020), which is
adapted to the uncertainty of stock market. Therefore,
machine learning methods are able to assist traders to
make correct predictions (Obthong et al., 2020).
However, the machine learning method has gone
through a series of updates in a few decades.
Traditional machine learning approaches are
mainly applied in earlier years. Among those
practices, Naive Bayes, Support Vector Machine
(SVM), Random Forest (RF) and K-Nearest
Neighbour (KNN) are relatively representative (Soni
et al., 2022). Kumar et al. had made comparison
between the models above and observed that RF
made the most accurate prediction. Models at that
time are based on different but independent
algorithms, which means the frameworks are
relatively simple (Kumar et al., 2018).
With the appearance of advanced learning method,
neural networks are applied to forecast stock prices
(Nikou et al., 2019). The idea of neural networks is
originated from human brain, aiming to process and
identify complex information. Generally, a neural
network unit features an input layer, several hidden
layers, and an output layer. A neural network system
may consist of multiple such units. With the
cooperation of the nodes, neural networks are able to
process non-linear relationships through internal
structures and model the changes of stock price more
accurately (Rezaei et al., 2021). Some examples of
making stock price predictions through neural
networks will be presented subsequently.
214
Li, Z.
Stock Price Prediction Based on LSTM-GBM: Evidence from Haier Smart Home.
DOI: 10.5220/0013213200004568
In Proceedings of the 1st International Conference on E-commerce and Artificial Intelligence (ECAI 2024), pages 214-221
ISBN: 978-989-758-726-9
Copyright © 2025 by Paper published under CC license (CC BY-NC-ND 4.0)

Many methods of using neural networks have
been applied to predict the stock prices, including
using single neural network, composing multiple
neural networks and combining neural networks with
traditional models. Each method has distinct features,
contributing to make more accurate predictions.
Ghosh et al. designed a model that includes LSTM
(Long Short-Term Memory) to predict the closing
prices of 5 companies on Indian market (Ghosh et al.,
2019). After acquiring the predicted data of different
time spans, the thesis calculated the growth rates and
analysed the deviations of closing prices. At last, the
thesis found out that the deviations went down with
the growth of the time spans, which means the model
performed relatively well when predicting shared
prices over a long time period. Islam & Nguyen
compared the abilities of three models named
autoregressive integrated moving average (ARIMA),
artificial neural network (ANN), and stochastic
process-geometric Brownian motion (GBM) to
predict the stock prices (Islam & Nguyen, 2020). The
research analysed the residuals and calculated the
absolute percentage errors, the average absolute
errors, the average relative percentage errors, and the
root-mean-square errors of the models. The results
illustrated that both ARIMA model and the GBM
model were expert in analysing short time series
while fusing the existing model may improve the
ability of ANN. In other words, a possible way to
improve the ability of neural networks is combining
different neural network models. Rezaei et al.
developed two innovative models, CEEMD-CNN-
LSTM and EMD-CNN-LSTM, which combine the
deep learning capabilities with the efficiency of the
Empirical Mode Decomposition (EMD) and
Complete Ensemble Empirical Mode Decomposition
(CEEMD) techniques. Deep learning methods and
frequency decomposition algorithms were used in the
experiment, and performances of those models were
evaluated through calculating relevant metrics. The
research stated that CEEMD-CNN-LSTM model
performs more exact than EMD-CNN-LSTM model.
Lu et al. introduced the CNN-BiLSTM-AM
framework to project the share prices and compared
the performance of the proposed model with other
frameworks including MLP, CNN, RNN, LSTM,
BiLSTM, CNN-LSTM, and CNN-BiLSTM. After
comparing the indexes, the research found that CNN-
BiLSTM-AM made the most accurate prediction (Lu
et al., 2021). Johansson considered three recurrent
neural networks named LSTM-SDE, ESN-SDE and
LS-ESN-SDE to predict financial time series. The
three proposed model contain parametric neural
SDEs, which are the combinations of neural networks
and stochastic differential equation (SDE) models.
Compared with traditional LSTM model and
geometric Brownian motion model, three
experimental models have made more precise
predictions (Johansson, 2022).
Throughout the experiments, scientists adopted
diverse methods based on the significant advantages
of neural networks and the ability of traditional
algorithms. The models designed have achieved
impressive results in predicting time series. Inspired
by the previous progress, this thesis presented a fresh
model that combined a recurrent neural network and
geometric Brownian motion model. The aim and the
framework of this thesis will be presented in next part.
This thesis aims to forecast the share prices of
Haier Smart Home via the new framework named
LSTM-GBM and discuss a possible direction of
improving this model. In order to state the
experiment comprehensively, different contents will
be presented in different sessions. Section 2 will
introduce the basic information, which includes the
data, models in need, the way to improve the model
and the loss function of this experiment. The results
of the research and discussions will be demonstrated
in Section 4. Eventually, the conclusion of this
experiment will be proposed in Section 4.
2 DATA AND METHOD
2.1 Data
According to the data requirements and variables
used in this research, the primary variable is the
closing prices of Haier Smart Home each day from
2019-8-13 to 2024-8-12, which contain 1211 pieces.
Therefore, the amount of data is large enough to train
the model to make reliable predictions. Besides, the
data used in this thesis is up to date, which is able to
describe the latest stock movement. In the data, trade
date is characteristic variable and daily closing price
is object variable. In order to ensure adequate training
as well as provide stable evaluation results, the first
80% of the data is allocated to the training set while
the remaining 20% is allocated to the test set. To
achieve efficient model training, all data is
normalized before training LSTM models and
denormalized after the training process. This thesis
adopts Min-Max Normalization to convert the dataset
between 0 and 1 (Johansson, 2022). Through this
method, the data is normalized as:
𝑁𝑜𝑟𝑚
𝑋
=
()
(
)
()
(1)
Stock Price Prediction Based on LSTM-GBM: Evidence from Haier Smart Home
215
In addition, to fit the input shape of LSTM models,
the normalized data are sliced with the time span of
60 days, which means the LSTM models will learn to
predict the price of next day by processing the prices
from previous 60 days. Therefore, the test set will
cover 230 nodes.
2.2 Models
After processing the data, four models are adopted to
forecast the share prices. This section, this thesis will
introduce those models, including motivations,
frameworks and methods within this section. The
models are designed by Python. In addition, it is
necessary to introduce the loss function of the
experiment. LSTM model is one of the variants of
RNN (Recurrent Neural Network), designed to
address the vanishing error problem (Ta et al., 2020).
Through special gating mechanism, LSTM is able to
add new information and forget previous information
selectively. According to Hao & Gao, it is feasible
that time dependencies in the financial sequence are
able to be extracted by this model, which means
LSTM has significant advantage in processing time
series data like stock prices (Hao & Gao, 2020). The
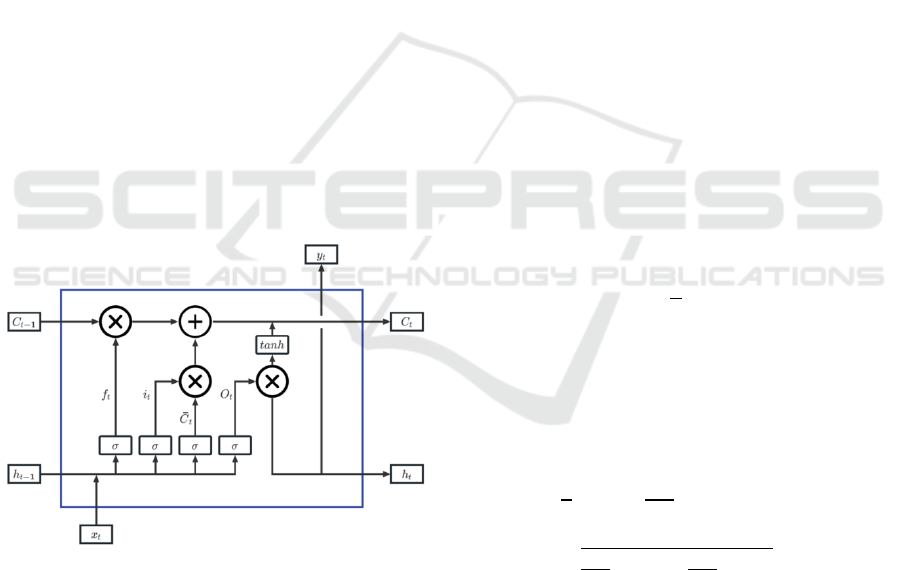
framework of a cycle unit of LSTM can be seen in
Fig. 1. It features three gate systems (input, forget,
output), cell states, input block, output block and
activation functions (Sherstinsky, 2020).
Figure 1: The Organization of a LSTM Cycle Unit
(Photo/Picture credit: Original).
It is assumed that in time step 𝑡, the input and
output of the unit are 𝑥
and 𝑦
. The forget gate
system settles what details will be discarded from the
cell state and input gate determines what details will
be updated. 𝑦
is mainly affected by the output gate,
which contains a 𝑠𝑖𝑔𝑚𝑜𝑖𝑑 layer and a 𝑡𝑎𝑛ℎ layer.
The 𝑠𝑖𝑔𝑚𝑜𝑖𝑑 layer is able to describe ingredients that
pass through by outputting numbers between 0 and 1.
The 𝑡𝑎𝑛ℎ layer is responsible for integrating
information through transferring numbers between -1
and 1. Concrete expressions of other functions in need
will be presented in Fig. 1. In the experiment, founded
on the learning results of the training set data, LSTM
outputs a specific target path 𝐿
∗
on the test set.
Stochastic Differential Equations (SDEs) are
mathematical methods used to simulate changes
affected by random factors (Särkkä & Solin, 2019).
Since stock price fluctuations are relatively uncertain,
SDE models are suitable for describing the changes
of stock market. An SDE consists of a certain part and
a random part, which is featured in Eq. (2):
𝑑𝑋
= 𝜇
(
𝑋
, 𝑡
)
𝑑𝑡+ 𝜎
(
𝑋
, 𝑡
)
𝑑𝑊
(2)
where 𝑋
is a stochastic process; 𝜇
(
𝑋
, 𝑡
)
is the drift
term; 𝜎
(
𝑋
, 𝑡
)
is the diffusion term; 𝑊
is a standard
Brownian motion. In financial field, another type of
SDE called GBM (Geometric Brownian Motion) is
the typical simulation in financial modeling due to its
concise mathematical model and high prediction
accuracy. The general form of a GBM is as follows.
𝑑𝑆
= 𝜇𝑆
𝑑𝑡+ 𝜎𝑆
𝑑𝑊
(3)
where 𝑆
is asset price; 𝜇 is the drift term; 𝜎 is the
diffusion term; 𝑊
is a standard Brownian motion.
The analytical solution of GBM is:
𝑆
= 𝑆
exp 𝜇−
1
2
𝜎
𝑡+ 𝜎𝑊
(4)
where 𝑆
is the initial asset price. The experiment
uses Eq. (3) as the iterative formula and assumes that
𝜇 and 𝜎 is equal to the mean and standard deviation
of the logarithmic return on the stock price of the
training set.
𝜇 =
∑
ln (
)
(5)
𝜎 =
∑
[ln
− 𝜇]
(6)
The experiment uses the initialized vector 𝑍 to
store stock prices simulated by GBM. Besides, this
thesis assumes that 𝑍
is the last data in the training
set. Through solving the equations iteratively, a
simulated path 𝑍
can be drawn. In the experiment,
100 paths will be generated. The process of GBM is
displayed in Fig.2.
ECAI 2024 - International Conference on E-commerce and Artificial Intelligence
216
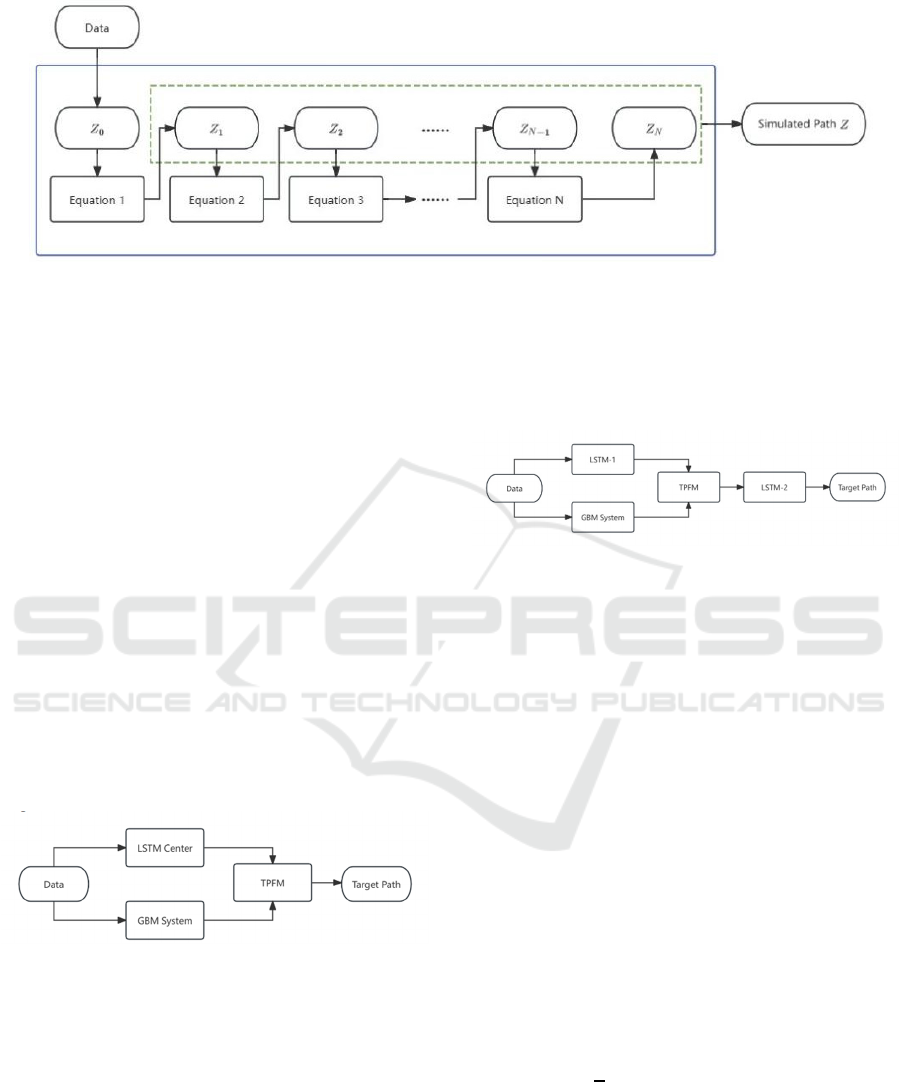
Figure 2: The Flow of GBM Model (Photo/Picture credit: Original).
Considering that LSTM is good at dealing long-
time dependence in stock prices and GBM is good at
dealing with the potential randomness behind stock
prices, this thesis adopts LSTM-GBM model as the
experimental model. This model includes a LSTM
center, a GBM system and a target path filtering
module (TPFM). LSTM center is responsible for
generating a prediction path 𝐿
∗
and GBM system
simulates 𝑖 paths 𝑍
,∗
through iteration. TPFM fits
the final path 𝑃
∗
through filtering the path
generated by GBM system based on 𝐿. For each time
point 𝑡, TPFM first calculates the distance between 𝐿
and every path generated by GBM system 𝑑
,
, then
chooses the minimum value of 𝑑
,
as the point of 𝑃
.
All 𝑃
constitute the final path 𝑃.
𝑑
,
= 𝑚𝑖𝑛𝑍
,
− 𝐿
(
7
)
Eq. (6) represents the screening mechanism of TPFM
and the process of LSTM-GBM model is displayed in
Fig. 3.
Figure 3: The Flow of LSTM-GBM Model (Photo/Picture
credit: Original).
In order to strengthen the performance of the
model, this thesis attempts to add a LSTM model after
the GBM system, trying to forecast the share prices
through LSTM-GBM-LSTM model. In this model,
the front LSTM is named as LSTM-1 while the latter
is called LSTM-2. On the basis of LSTM-GBM,
LSTM-2 mainly responsible for generating a
prediction path 𝐷
∗
based on learning from LSTM-
1 predicted path 𝐿 and LSTM-GBM generated path 𝑃.
Since the dataset of LSTM-2 is from both training set
and 𝑃, LSTM-2 predicted path 𝑇
∗
is not able to
cover the test set. Therefore, the part that cannot be
covered is replaced by the corresponding part of 𝐷 in
this experiment. Fig. 4 presents the process of LSTM-
GBM-LSTM.
Figure 4: The Process of LSTM-GBM-LSTM Model
(Photo/Picture credit: Original).
2.3 Models Parameters and
Evaluations
In terms of model training, both training times and
learning rate are considered in this experiment.
LSTM-1 is trained for 50 times and LSTM-2 is
trained for 30 times. Both LSTM-1 and LSTM-2
uses ’adam’ booster and the learning rate is 0.001. To
evaluate the models, this thesis uses the evaluation
metrics as detailed in Tabel 1. Mean Squared Error
(MSE), Root Mean Squared Error (RMSE), Mean
Absolute Error (MSE) and 𝑟
score are included in
the matrix, which allows this thesis to
comprehensively assess accuracy of the
predictions.This experiment compares the target path
generated by the four models above with true prices
on test set. As a result, this experiment uses MSE as
the loss function (Hodson, 2022). The equation of
MSE is as follows.
𝑀𝑆𝐸 =
∑
(𝑦
− 𝑦
)
(8)
where 𝑦
is true stock price; 𝑦
is predicted stock
price; 𝑁 is total forecast time. In the experiment, a
smaller MSE represents the better performance of the
model. The MSE of four models above are calculated
in this experiment and the result will be presented in
Section 4.
Stock Price Prediction Based on LSTM-GBM: Evidence from Haier Smart Home
217
3 RESULTS AND DISCUSSION
After using LSTM, GBM, LSTM-GBM and LSTM-
GBM-LSTM to forecast the share prices, the result of
each model will be presented in this section. This
thesis will evaluate the results and analyze the
possible reasons, therefore discuss the feasibility of
making predictions by LSTM-GBM and LSTM-
GBM-LSTM. Finally, limitations of this study will be
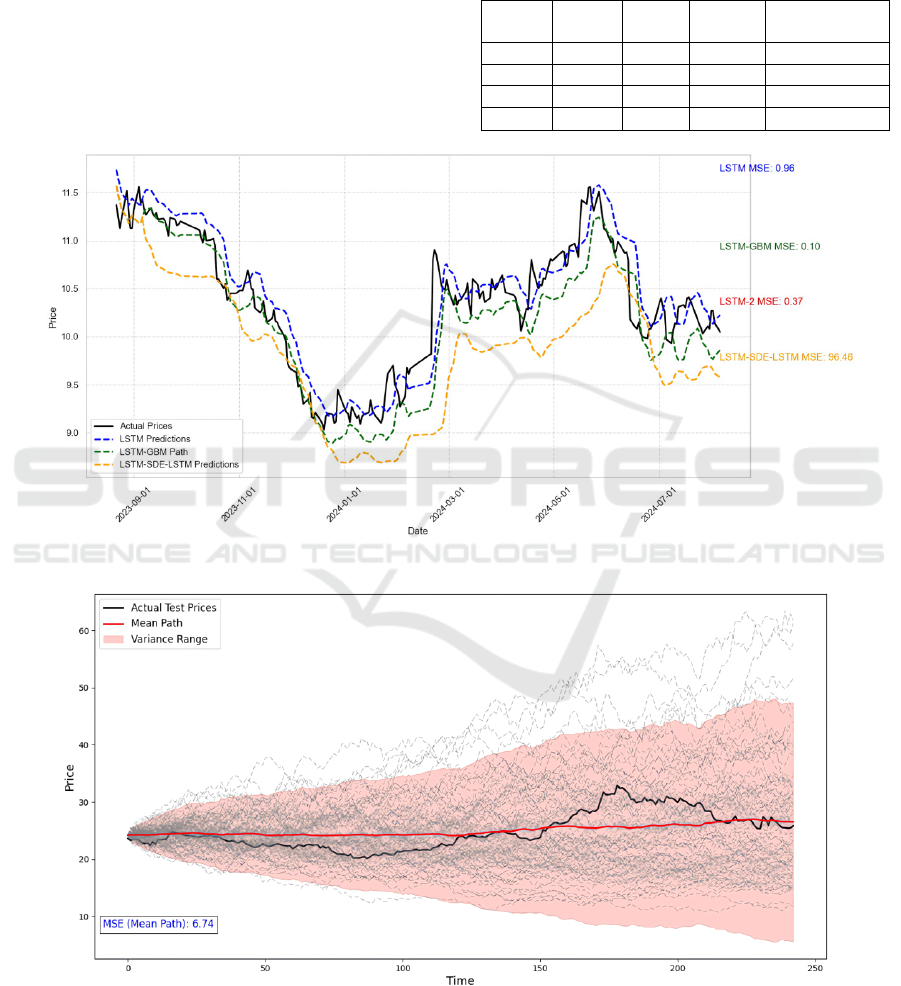
analyzed and future prospects will be proposed. Fig.
5 contains true prices, LSTM predicted paths, LSTM-
GBM simulated path, LSTM-GBM-LSTM predicted
path and MSE of each model. The comparison of
those three models can be drawn from Fig. 5. For the
readability of the results, the results of GBM will be
presented separately in Table 1.
Table 1: Evaluation Metrics of Each Model.
Index LSTM GBM LSTM-
GBM
LSTM-GBM-
LSTM
MSE 0.96 7.46 0.10 96.46
RMSE 0.98 2.73 0.31 9.82
MAE 0.21 2.22 0.23 9.80
𝑟
0.84 0.26 0.79 -53402.69
Figure 5: Stock Price Prediction Comparison (Photo/Picture credit: Original).
Figure 6: Stock Price Prediction Using GBM (Photo/Picture credit: Original).
ECAI 2024 - International Conference on E-commerce and Artificial Intelligence
218
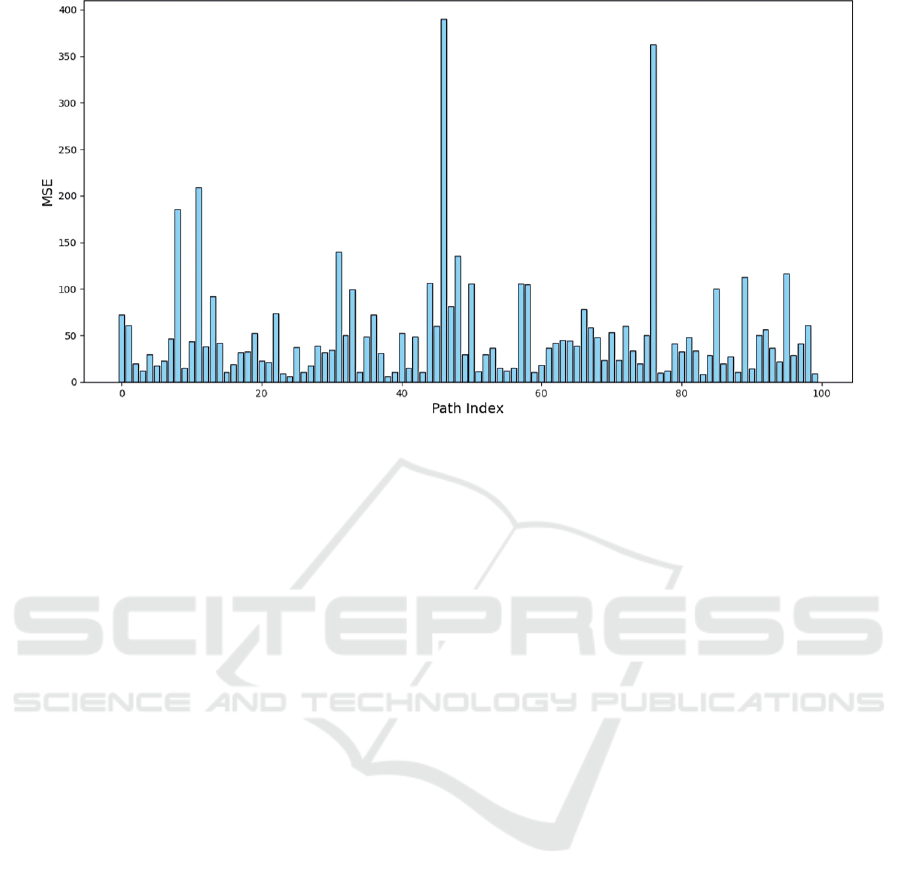
Figure 7: Histogram of MSE for Each Path (Photo/Picture credit: Original).
According to Fig. 5, the MSE of LSTM is 0.96,
which is much higher than LSTM-GBM (will be
presented later). It seems unsuitable for LSTM alone
to forecast the share prices. On the other hand, LSTM
seems to perform better with GBM model. Both Fig.
6 and Fig. 7 present the result of GBM model. Fig. 6
contains all simulated path by GBM, the mean path,
the variance range and average MSE of GBM model.
Fig. 7 presents the MSE of each path. Fig. 6 implies
that GBM model may be inappropriate to forecast the
share price because the MSE of this model is
relatively high. Meanwhile, Fig. 7 demonstrates that
different path has distinct MSE, which illustrates the
randomness of GBM. The results prove that the GBM
model might need some restrictions to perform better.
According to Fig. 5, LSTM-GBM model seems to
perform best in this experiment because the MSE of
this model is the lowest. In addition, the path seems
able to describe fluctuations in originate share prices.
Founded on the ability of LSTM to simulate the share
price data, LSTM-GBM adds possible changes.
Besides, the standard of fitting the path seems
appropriate. However, in terms of the latter part of the
prediction, LSTM-GBM seems to deviate more from
the true prices compared with LSTM. It might imply
that the long-term forecasting ability of LSTM-GBM
needs to be improved. In conclusion, LSTM-GBM is
more suitable for predicting stock prices compared
with LSTM and GBM, but the model is able to
perform better with some improvements.
Although the MSE of LSTM-2 is relatively low,
the MSE of LSTM-GBM-LSTM is the highest, which
implies that LSTM-GBM-LSTM performs the worst
among the four models. Besides, the prediction is
generally lower than the actual prices. There are a
number of possible reasons for the results. On the one
hand, it is difficult for LSTM to learn effective
features that contains randomness. On the other hand,
Eq. (7) declines the expectation of the prediction. In
addition, after adding LSTM-2, original standard may
no longer be appropriate. New ways to generate target
paths need to be discovered. Last but not least, the
stacking of multi models may lead to overfitting
problems. In general, several factors may lead to the
bad performance of LSTM-GBM-LSTM. Much more
effort needs to be paid to improve the model.
Despite the best performance of LSTM-GBM,
there are still limitations to this experiment. Firstly,
due to time constraints, this experiment was not able
to explore all possible parameters for the models.
Better performance of the models may not be
presented. Secondly, GBM model makes predictions
based on only the last value of training set, which
means the model has no idea of historical stock price
movements. In this case, simulated path has to limited.
Further studies need to make greater efforts in
improving methods that allow GBM to learn the
whole historical data. Thirdly, there may be more
standards rather than Eq.7, which is likely to lead
LSTM-GBM to make predictions with low
expectations. Further studies could try to find other
standards that are more suitable. Lastly, there might
be other methods to design LSTM-GBM-LSTM
model to make more accurate predictions. Future
researches could focus on better ways to combine
LSTM and GBM.
Stock Price Prediction Based on LSTM-GBM: Evidence from Haier Smart Home
219

4 CONCLUSIONS
In order to make more accurate stock price
predictions, this thesis offers a novel model named
LSTM-GBM, which combines LSTM’s ability to
forecast time series and GBM’s skill to capture and
simulate possibility in the stock market. To assess the
capability of this model, this thesis compared LSTM-
GBM with LSTM model and GBM model. Besides,
this thesis proposed a possible lifting scheme which
is adding a LSTM system after the LSTM-GBM
model. This model is named LSTM-GBM-LSTM.
The performance of LSTM-GBM is also compared
with the performance of LSTM-GBM-LSTM in the
experiment. The results clearly state that LSTM-
GBM is most capable of making predictions among
the four models because LSTM-GBM has made the
most accurate forecast. The MSE of LSTM-GBM is
the lowest while the MAE and the 𝑟
score of LSTM-
GBM is closely similar to the result of LSTM. Those
data shows that LSTM-GBM model is able to make
compelling predictions. Therefore, this model might
assist traders and investors to predict stock prices in
stock market. In terms of future works, both LSTM-
GBM and LSTM-GBM-LSTM have the potential to
perform better. For LSTM-GBM, more parameters
are able to be adjusted and more standards of
selecting the target paths are able to be adopted.
Besides, the GBM system might learn more historical
data through some possible improvement. In addition,
the model tends to make predictions of low
expectations due to the design of TPFM and it is able
to make the forcast prices’ expectation close to the
real data. For LSTM-GBM-GBM, the high MSE and
negative 𝑟
score both imply that this model has a
large space for improvement. For example, potential
methods of combining LSTM and GBM are able to
be applied. Those improvements may promote the
ability of the models. Besides, the data may state that
LSTM-GBM-LSTM model has the problem of
overfitting. Therefore, adopting regularization
method or other methods for solving the overfitting
problem may increase the performance of LSTM-
GBM-LSTM model. The problem may be solved by
reducing the complexity of the model as well. A
number of methods are feasible to increase the
performance of LSTM-GBM-LSTM so that the
improvement of this model may be an optional topic
for further studies. In conclusion, LSTM-GBM model
performs the best and it is recommended to adopt this
framework to forecast the share prices in reality.
Meanwhile, greater effort in the future is needed for
reducing the MSE and solving the possible overfitting
problem of LSTM-GBM-LSTM model.
REFERENCES
Ghosh, A., Bose, S., Maji, G., Debnath, N., Sen, S., 2019.
Stock price prediction using LSTM on Indian share
market. Proceedings of 32nd international conference
63, 101-110.
Hao, Y., Gao, Q., 2020. Predicting the trend of stock market
index using the hybrid neural network based on
multiple time scale feature learning. Applied Sciences,
10(11), 3961.
Hodson, T. O., 2022. Root mean square error (RMSE) or
mean absolute error (MAE): When to use them or not.
Geoscientific Model Development Discussions, 2022,
1-10.
Islam, M. R., Nguyen, N., 2020. Comparison of financial
models for stock price prediction. Journal of Risk and
Financial Management, 13(8), 181.
Ji, X., Wang, J., Yan, Z., 2021. A stock price prediction
method based on deep learning technology.
International Journal of Crowd Science, 5(1), 55-72.
Johansson, O., 2022). Stochastic modeling using machine
learning and stochastic differential equations.
Kumar, I., Dogra, K., Utreja, C., Yadav, P., 2018. A
comparative study of supervised machine learning
algorithms for stock market trend prediction. 2018
Second International Conference on Inventive
Communication and Computational Technologies
(ICICCT), 1003-1007.
Lu, W., Li, J., Wang, J., Qin, L., 2021. A CNN-BiLSTM-AM
method for stock price prediction. Neural Computing and
Applications, 33(10), 4741-4753.
Mahesh, B., 2020. Machine learning algorithms-a review.
International Journal of Science and Research (IJSR),
9(1), 381-386.
Nikou, M., Mansourfar, G., Bagherzadeh, J., 2019. Stock
price prediction using DEEP learning algorithm and its
comparison with machine learning algorithms.
Intelligent Systems in Accounting, Finance and
Management, 26(4), 164-174.
Obthong, M., Tantisantiwong, N., Jeamwatthanachai, W.,
Wills, G., 2020. A survey on machine learning for stock
price prediction: Algorithms and techniques. Eprints,
437785.
Rezaei, H., Faaljou, H., Mansourfar, G., 2021. Stock price
prediction using deep learning and frequency
decomposition. Expert Systems with Applications, 169,
114332.
Särkkä, S., Solin, A., 2019. Applied stochastic differential
equations. Cambridge University Press.
Sherstinsky, A., 2020. Fundamentals of recurrent neural
network (RNN) and long short-term memory (LSTM)
network. Physica D: Nonlinear Phenomena, 404,
132306.
Soni, P., Tewari, Y., Krishnan, D., 2022. Machine learning
approaches in stock price prediction: a systematic
review. Journal of Physics: Conference Series, 2161(1),
012065.
Ta, V. D., Liu, C. M., Tadesse, D. A., 2020. Portfolio
optimization-based stock prediction using long-short
term memory network in quantitative trading. Applied
Sciences, 10(2), 437.
ECAI 2024 - International Conference on E-commerce and Artificial Intelligence
220

Wang, H., Wang, J., Cao, L., Li, Y., Sun, Q., Wang, J., 2021.
A stock closing price prediction model based on CNN
‐
BiSLSTM. Complexity, 2021(1), 5360828.
Zhang, J., Ye, L., Lai, Y., 2023. Stock price prediction
using CNN-BiLSTM-Attention model. Mathematics,
11(9), 1985.
Stock Price Prediction Based on LSTM-GBM: Evidence from Haier Smart Home
221
