
Stock Price Prediction Based on SDE and LSTM: Evidence from BYD
Yaling Xu
a
School of International Education, Guangdong University of Technology, Guangzhou, China
Keywords: Long Short-Term Memory, Stochastic Differential Equation, Stock Market, Price Prediction.
Abstract: With the increasing complexity and dynamism of the stock market, traditional forecasting methods make it
difficult to accurately capture market fluctuations. In recent years, deep learning models have gradually been
applied to the stock market, demonstrating superior research results. This article investigates a stock price
prediction model based on the combination of Long Short-Term Memory (LSTM) and Stochastic Differential
Equations (SDE). The model utilizes the excellent time series processing capability of LSTM and the
advantage of SDE in describing stochastic processes, which can improve the prediction accuracy of stock
prices. This article concludes that by introducing SDE, the model can better simulate the randomness and
volatility of stock prices, while LSTM effectively captures long-term and short-term dependencies in
historical data. With machine learning models can be explored to enhance the real-time performance and
adaptability of the models. In addition, this study only considered the price prediction and simulation of a
single stock, the experimental results show that the LSTM-SDE model has good predictive performance in
stock price prediction and can provide investors with more reliable decision support.
1 INTRODUCTION
Stock price prediction is a complex and dynamic
research field that covers multiple disciplines such as
economics, finance, statistics, and computer science.
Researchers hope to use scientific research methods
to predict the price trends of stocks. Stock price
prediction, as one of the core issues in financial
market analysis, has gone through multiple stages of
development. The research on stock price prediction
has undergone an evolution from classical theory to
modern data-driven models.
In the early days of the stock market, Graham and
Dodd analyzed the reasons for the 1929 US stock
market price crash in their book "Securities Analysis"
and believed that stock price fluctuations were based
on the "intrinsic value" of stocks. This viewpoint
provided an important theoretical basis for later stock
price predictions.
At the beginning of the 20th century, stock price
prediction mainly relied on fundamental analysis,
which evaluated the intrinsic value of stocks by
analyzing factors such as a company's financial
statements, industry position, management team,
market competitiveness, and macroeconomic
a
https://orcid.org/0009-0007-1913-3611
indicators. Investors would decide whether to invest
based on these fundamental analyses. The early
research on the stock market was mainly based on the
Random Walk Theory. Fama discussed the theory of
random walks and believed that the price level of
future path securities is not easy to predict, and
market price changes are unpredictable (Fama, 1965).
In 1970, Fama proposed the Efficient Market
Hypothesis, which states that the good functioning,
competitive nature, and high profits of the stock
market allow everyone to try to predict stock prices,
and all valuable information can be reflected in stock
price trends in a timely, accurate, and sufficient
manner, which also means that stock prices are
difficult to predict (Fama, 1970).
With the advancement of technology and the
improvement of data processing capabilities,
researchers have begun to search for more complex
models to predict stock prices. Since the 1970s,
research methods have gradually shifted towards time
series analysis, machine learning, and deep learning.
Box and Jenkins proposed the Autoregressive
Integrated Moving Average (ARIMA) model, which
can be used for predicting time series data (Box &
Jenkins, 2015). Bollerslev introduced the Generalized
Xu, Y.
Stock Price Prediction Based on SDE and LSTM: Evidence from BYD.
DOI: 10.5220/0013213100004568
In Proceedings of the 1st International Conference on E-commerce and Artificial Intelligence (ECAI 2024), pages 209-213
ISBN: 978-989-758-726-9
Copyright © 2025 by Paper published under CC license (CC BY-NC-ND 4.0)
209

Autoregressive Conditional Heteroskedasticity
(GARCH) model for handling volatility in financial
data (Bollerslev, 1986). Entering the 21st century,
with the rise of machine learning and artificial
intelligence technologies, new tools have been
provided for stock price prediction. Kim introduced
SVM into financial market forecasting,
demonstrating the potential of the model in nonlinear
data processing and prediction (Kim, 2003). Deep
learning models have gradually been applied to
financial markets. Fischer and Krauss (2018) used
Long Short-Term Memory networks (LSTM) to
predict financial markets, demonstrating the
application ability of deep learning models in
complex time series (Fischer & Krauss, 2018).
In recent years, Zhang combined neural networks
with ARIMA models to propose a hybrid model for
predicting stock prices, which significantly improved
prediction accuracy (Zhang, 2003). Dang applied
reinforcement learning (RL) to optimize trading
strategies in dynamic environments, demonstrating
good adaptability (Dang, 2019). In addition,
researchers combined Convolutional Neural
Networks (CNN) with LSTM, utilizing the advantage
of CNN in extracting local features from time series,
and processed these features with LSTM to generate
prediction results (Eapen et al., 2019).
With the development of natural language
processing technology, Vaswani applied the
Transformer model to stock price prediction and
found that it can further improve the ability to capture
complex data patterns (Vaswani, 2017). More
cutting-edge applications include Graph Neural
Networks (GNNs), which can effectively capture the
relationships between stocks and improve market
prediction accuracy (Chen et al., 2023).
2 DATA AND METHOD
To analyse the actual performance of the LSTM-SDE
model in stock prediction, daily individual stock
return data of BYD from August 26, 2019, to August
23, 2024, were downloaded from CSMAR, and daily
closing prices for the past five years were extracted
from it.
2.1 Data
The data for this analysis is sourced from the China
Stock Market & Accounting Research Database
(CSMAR), which has authoritative sources including
the Hong Kong Stock Exchange, China International
Capital Exchange, the State Administration of
Foreign Exchange, and so on, ensuring the accuracy
and authority of the data.
The dependent variable is the dependent variable
is BYD's daily closing price while independent
variables are predicts future prices, predicting the
daily closing price for a certain period. The collected
dataset is separated into training and testing sets to
ensure the model's generalization ability. The training
set is used for the model's training process, that is, to
learn the inherent rules and patterns of the data; The
test set is used to appraise the final performance of the
model, ensuring that it can perform well on unseen
data. Therefore, the top 80% of the overall data will
be used as the training set, which includes data from
August 26, 2019, to August 23, 2023; The remaining
20% of the data will be used as the test set from
August 24, 2023 to August 23, 2024. In the data
preprocessing stage, the closing price-related data of
the corresponding time and date of the stock were
extracted. After normalizing the data, it was separated
into training and testing sets. At the same time, the
data was processed accordingly, such as processing
the text or missing values in the closing price and
extracting the remaining readable data to provide
correct data for subsequent model training and
prediction.
2.2 Models
In the BYD stock prediction task, this article uses the
LSTM model and SDE model. The LSTM model is
used for time series prediction to obtain the initial
intermediate variable z_0, which is used in the SDE
model to simulate the path of stock prices. The
process includes Data normalization and extraction of
closing price features; Slice the data into training and
testing sets; Extract data that can be read correctly
from the data. For LSTM model training, in the first
half of the process, an LSTM network was
constructed to process sequence data, initial
intermediate variables were obtained through inverse
normalization, and mean square error was collected.
Train the model by providing training set data,
training epochs, batch size, and validation set
segmentation ratio to minimize the mean square error
between predicted and actual values. As for model
validation, one uses 10% of the training set as the
validation set to evaluate its performance and prevent
overfitting. Regarding to SDE model design, based on
the initial intermediate variable z-0 predicted by
LSTM, multiple stock price paths were simulated
using the SDE model, and the drift term μ and
diffusion term σ were calculated in the model for
subsequent SDE model construction. For model
ECAI 2024 - International Conference on E-commerce and Artificial Intelligence
210
evaluation, this study will calculate the root mean
square error (RMSE) between the actual price and the
predicted price (LSTM) and the SDE simulation path.
For LSTM model parameters, this study designed
two layers of LSTM. The number of LSTM units per
layer is 50; Using optimizer Adam, it can be used to
adjust the learning rate automatically; using mean
square error as the loss function. The entire dataset
has 50 training epochs. Each gradient update will use
32 samples for calculation. This study set aside 10%
of the training data as the validation set for evaluating
model performance during the training process. For
SDE model parameters, one designed a drift term (μ)
for the logarithmic rate of return calculation.
Diffusion term (σ) is used for calculating the standard
deviation of logarithmic returns. The time step (dt) is
1 day and one designs 10 simulated paths (sim_time).
The project uses Model Discussion Root Mean
Square Error (RMSE) to evaluate the quality of the
model. Used to evaluate the difference between
LSTM model predicted prices and actual prices, as
well as the difference between SDE simulated path
mean and actual prices. The smaller the RMSE value,
the better the model's prediction or simulation
performance.
3 RESULTS AND DISCUSSION
3.1 Model Performance
This study combined the LSTM neural network and
stochastic differential equation (SDE) model to
predict stock prices and conducted a detailed analysis
of the results. The LSTM model has demonstrated
strong capabilities in capturing complex dynamic
features of time series data, especially when dealing
with nonlinear and non-stationary data such as stock
prices. By setting appropriate time steps
(time_step=60) and training parameters (such as
epochs=50, batch_2=32), the LSTM model
successfully learned patterns in the stock price
sequence and provided relatively accurate predictions
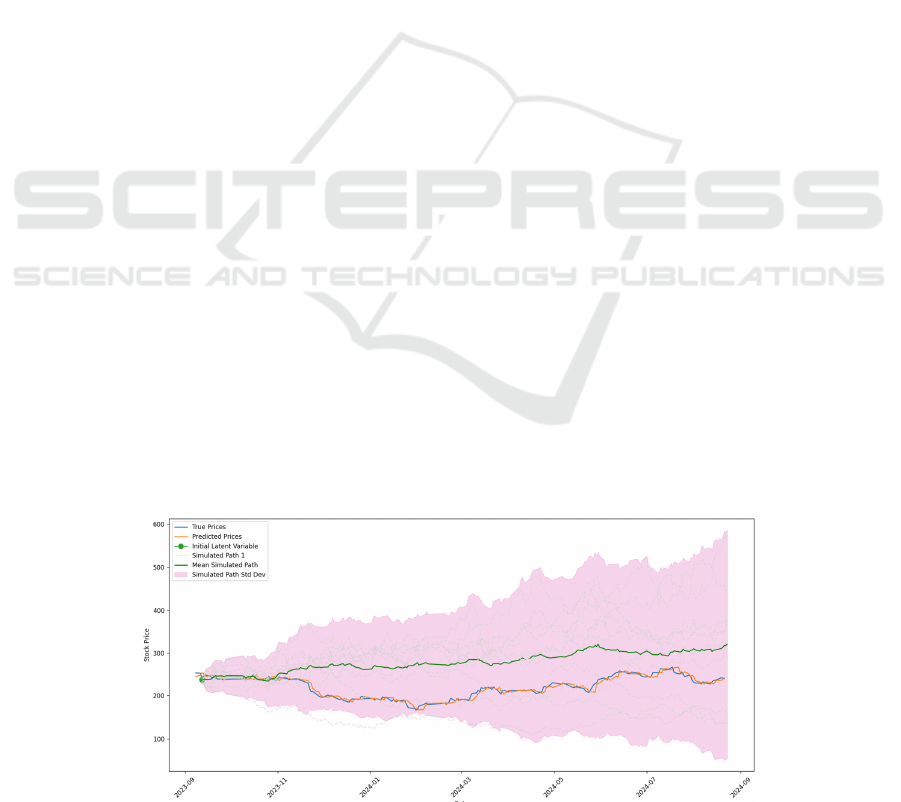
on the test set. The prediction results are shown in Fig.
1.
Specifically, the continuous decrease in the loss of
LSTM models on the training and validation sets
indicates that the model is learning the intrinsic
patterns of the data. After 50 training cycles, the
LSTM model's predicted stock price trend maintained
good consistency with the real stock price, especially
in capturing trends accurately. However, in predicting
short-term fluctuations and extreme values, the
performance of the LSTM model is slightly
inadequate. This may be because of the complexity
and uncertainty of the stock market, which is
influenced by various external factors including
policy changes, market sentiment, etc. These factors
are difficult to fully quantify and incorporate into the
model. Therefore, there is still a certain degree of
error in the prediction results of the LSTM model.
Compared with the LSTM model, the SDE model
exhibits unique advantages in simulating the long-
term dynamics and uncertainty of stock prices and
provides multiple possible paths for future price
trends. The SDE model simulates the stochastic
process of stock prices, displays the possible range of
stock price fluctuations, and quantifies uncertainty by
calculating the mean path and standard deviation. In
the visualization results, one can see that the average
path simulated by SDE is consistent with the real
price trend, indicating that the SDE model has certain
effectiveness in capturing the long-term trend of stock
prices. At the same time, the setting of confidence
intervals also provides us with a visual understanding
of prediction uncertainty. However, the predictive
ability of SDE models for short-term fluctuations is
relatively weak, which may be due to the deviation
between their assumptions based on statistical
distribution and the actual situation.
Figure 1: The prediction results (Photo/Picture credit: Original).
Stock Price Prediction Based on SDE and LSTM: Evidence from BYD
211

3.2 Explanation
The LSTM model performs well in stock price
prediction, mainly due to the design of its internal
loop unit (LSTM unit), which enables LSTM to
selectively retain and forget information. These
mechanisms effectively capture long-term
dependencies in time series data and control the flow
of information through mechanisms such as forget
gates, input gates, and output gates. In this study, by
setting appropriate time steps and number of neurons,
the LSTM model successfully extracted useful
features from historical price data, continuously
learned patterns from historical stock price data, and
gradually developed the ability to predict stock price
trends. However, stock prices are not only influenced
by historical data in real life but also by many
unpredictable external factors. These external factors
may cause significant fluctuations in stock prices in
the short term, exceeding the prediction range of the
LSTM model. In the stock market, it is influenced by
numerous macro and micro factors, and the
interaction between these factors makes the changes
in stock prices highly complex and uncertain.
Therefore, even if the LSTM model can capture some
historical patterns, it is difficult to accurately predict
future stock prices. In addition, LSTM models may
overfit the noise in the training data during the
training process, which can affect their performance
on the test set.
The SDE model predicts future trends by
simulating the stochastic process of stock prices. In
this study, the drift term (μ) and diffusion term (σ)
were calculated based on historical price data. In the
SDE model, the drift term represents the expected
trend of stock prices, while the diffusion term
represents the magnitude of price fluctuations. By
adjusting these two parameters, the SDE model
generated multiple simulated paths and quantified
uncertainty by calculating the average path and
standard deviation. The characteristic of the SDE
model gives it a unique advantage in handling
financial time series data with uncertainty. However,
the prediction accuracy of the SDE model is also
affected by various factors, such as the accuracy of
parameter estimation, the rationality of model
assumptions, and changes in the market environment.
3.3 Limitations and Prospects
Although this study has shown good performance in
combining LSTM and SDE models for stock price
prediction, the model still has some limitations. Due
to limitations in model structure and training data,
LSTM models have limited ability to capture short-
term fluctuations and extreme values. In the future,
more feature variables such as trading volume and
market sentiment can be considered to strengthen the
predictive ability of the model.
Although the SDE model can simulate the
uncertainty of stock prices, its parameters, namely
drift and diffusion terms, depend on the statistical
characteristics of historical data, and are trained and
predicted based on historical data. It may not fully
capture the changes in the market environment and
the impact of unexpected events on stock prices in the
future market. Therefore, in future research, more
flexible and dynamic parameter estimation methods
can be attempted to improve the prediction accuracy
of SDE models, or methods that combine real-time
data, news sentiment analysis, and other technologies
with machine learning models can be explored to
enhance the real-time performance and adaptability
of the models. In addition, this study only considered
the price prediction and simulation of a single stock,
and in practical applications, investors may be more
concerned with the performance of multiple stocks or
the entire market combination, as well as other factors
that may affect stock price changes, such as
macroeconomic indicators, company financial
conditions, etc. Therefore, in the future, this research
method can be extended to areas such as correlation
analysis in multi-asset or multi-market situations, or
more related variables can be introduced as feature
inputs. This will help to comprehensively understand
the operating rules of the stock market, improve the
prediction accuracy and generalization ability of the
model, provide more comprehensive and practical
prediction results, and provide investors with more
accurate and valuable decision support.
As a result of the progression of the continuous
development of artificial intelligence and big data
technology, more advanced algorithms and
technologies can be considered to be introduced into
the field of stock price prediction in the future. For
example, attention mechanisms in deep learning can
be utilized to strengthen the model's focus on
important information; Or use reinforcement learning
to optimize trading strategies to achieve higher
investment returns. The application of these new
technologies is expected to further enhance the
accuracy and practicality of stock price forecasting.
4 CONCLUSIONS
To sum up, this study delves into the application of
the LSTM-SDE model in stock price prediction and
ECAI 2024 - International Conference on E-commerce and Artificial Intelligence
212

verifies its effectiveness and superiority through
empirical analysis. Research has found that the
LSTM-SDE model can fully utilize historical data in
the stock market, and capture market trends through
the memory mechanism of LSTM, and the
introduction of SDE further enhances the model's
ability to capture random fluctuations in stock prices.
Compared to a single LSTM model, LSTM-SDE
performs well in both prediction accuracy and
stability. However, this article also points out the
limitations of the model in practical applications,
such as the need to rely more on historical data and
introduce more feature variables. Future research can
further explore how to optimize model structure,
improve computational efficiency, and consider
introducing more external factors to further enhance
prediction performance. In summary, the LSTM-SDE
model provides a new approach and method for stock
price prediction, with high potential for application
and research value.
REFERENCES
Bollerslev, T., 1986. Generalized Autoregressive
Conditional Heteroskedasticity. Journal of
Econometrics, 31(3), 307-327.
Box, G. E., Jenkins, G. M., Reinsel, G. C., Ljung, G. M.,
2015. Time series analysis: forecasting and control.
John Wiley & Sons.
Chen, Z., Huang, Z., Zhou, Y., 2023. Predicting Stock
Trend Using GNN. Highlights in Science, Engineering
and Technology, 39, 816-822.
Dang, Q. V., 2019. Reinforcement learning in stock trading.
International conference on computer science, applied
mathematics and applications 311-322.
Eapen, J., Bein, D., Verma, A., 2019. Novel deep learning
model with CNN and bi-directional LSTM for improved
stock market index prediction. 2019 IEEE 9th Annual
Computing and Communication Workshop and
Conference (CCWC), 264-270.
Fama, E. F., 1965. The Behaviour of Stock-Market Prices.
The Journal of Business, 38(1), 34–105.
Fama, E. F., 1970. Efficient Capital Markets: A Review of
Theory and Empirical Work. The Journal of Finance,
25(2), 383–417.
Fischer, T., Christopher, K., 2018. Deep learning with long
short-term memory networks for financial market
predictions. European Journal of Operational Research,
270(2), 654-669.
Kim, K. J., 2003. Financial time series forecasting using
support vector machines. Neurocomputing, 55(1-2),
307-319.
Vaswani, A., 2017. Attention is all you need. Advances in
Neural Information Processing Systems.
Zhang, G. P., 2003. Time series forecasting using a hybrid
ARIMA and neural network model. Neurocomputing,
50, 159-175.
Stock Price Prediction Based on SDE and LSTM: Evidence from BYD
213
