
Prediction of DOGE Based on Random Forest, Long Short-Term
Memory and Transformer
Shengjie Yu
Department of Computer Science and Technology, Nanjing University, Nanjing, China
Keywords: Dogecoin Price Prediction, Machine Learning, Random Forest, LSTM, Transformer.
Abstract: As cryptocurrencies have surged in value and importance in recent years, Dogecoin has been increasingly
regarded as an investment asset. Due to its high volatility, the demand to forecast Dogecoin prices using
machine learning techniques is rising. This study explores the application of four models, i.e., Linear
Regression, Random Forest, Long Short-term Memory (LSTM), and Transformer, in forecasting the hourly
prices of Dogecoin. Through comprehensive experiments, using MAE, MSE, and R-squared data as test
standards, the LSTM model demonstrated superior performance, achieving the lowest error rates compared
to the other models, followed by the linear regression model. The Random Forest model also performed
reasonably well but fell short of the linear regression model. The Transformer model, despite its advanced
architecture, delivered the poorest performance, highlighting its limitations in this specific time series
forecasting task. These findings suggest that LSTM models may be more effective for time series prediction
tasks in the cryptocurrency market, highlighting the need for further research into advanced machine learning
techniques for financial forecasting.
1 INTRODUCTION
Cryptocurrency traces its origins back to 2008 when
a developer under the pseudonym Satoshi Nakamoto
published the white paper. In 2009, the Bitcoin
network was officially launched, marking the birth of
the world's first decentralized cryptocurrency. In
addition to reducing transaction fees,
cryptocurrencies aim to provide consumers with more
control over their finances (Sridhar & Sanagavarapu,
2021). These currencies' high accessibility which
prevents the publication of private information and
allows for traceability has allowed them to flourish
over time. Cryptocurrencies went from relative
obscurity to a peak worldwide market value of over
$3 trillion in the previous ten years (Singla et al.,
2024). Dogecoin is one such cryptocurrencies that has
gained growing popularity.
Dogecoin, created by Billy Markus and Jackson
Palmer, is a cryptocurrency that originated as a
derivative of Bitcoin and was introduced on
December 6, 2013, as a joke or meme currency
(Sridhar & Sanagavarapu, 2021). Technically,
Dogecoin shares many similarities with Bitcoin, but
its inflationary mechanism is different. As opposed to
the limited supply of Bitcoin, Dogecoin was designed
to have an unlimited supply, allowing new Dogecoins
to be continuously generated (Chohan, 2021). Like
other cryptocurrencies, Dogecoin has proven to be
highly volatile (Zhang and Mani, 2021). In 2021,
Dogecoin's market capitalization surpassed $88
billion due to a further internet-driven price surge,
with each DOGE coin valued at more than 70 cents
(Nani, 2022). As of August 12, 2024, Dogecoin's total
market capitalization has reached $14.808 billion
(Dogecoin, 2024).
Due to the significant investment value of
cryptocurrencies, there has already been extensive
research on cryptocurrency price prediction.
Aravindan et al. used the moving average to eliminate
short-term fluctuations in cryptocurrency prices,
while employing various models, including Decision
Tree, Random Forest, Extra-Tree Regressor to predict
the closing prices of cryptocurrencies (Aravindan &
Sankara, 2022). Dhande et al. estimated the values of
Bitcoin, Dash currency, Lite coin, Dogecoin,
Ethereum, and Monero, using LSTM by introducing
the "memory cell" and three gating mechanisms
(Dhande et al., 2024). Wallbridge utilized a
Transformer model to predict price movements. The
transformer model does not rely on the order of
sequential data. Instead, the model employs a
188
Yu, S.
Prediction of DOGE Based on Random Forest, Long Short-Term Memory and Transformer.
DOI: 10.5220/0013212500004568
In Proceedings of the 1st International Conference on E-commerce and Artificial Intelligence (ECAI 2024), pages 188-194
ISBN: 978-989-758-726-9
Copyright © 2025 by Paper published under CC license (CC BY-NC-ND 4.0)

sophisticated mechanism known as self-attention,
which is designed to effectively capture and analyze
dependencies within the data (Wallbridge, 2020). A
better PSO technique and the XGBoost method,
based on the gradient boosting framework were
integrated by Srivastava et al. to optimize the optimal
hyper-parameters (Srivastava, et al., 2023).
In this article, the author used a variety of models
to predict the price of Dogecoin. With linear
regression model as a comparison, an in-depth study
on the prediction effects of three types of models,
random forest, LSTM and transformer, was
conducted. In the process of research, MAE, MSE
and R-square were used as evaluation criteria. This
study aims to verify and improve the existing time
series forecasting model by predicting the price of
Dogecoin and use the data in this field to optimize and
adjust the model to improve the model's adaptability
to high volatility and uncertainty markets. At the
same time, by predicting the prices of
cryptocurrencies such as Dogecoin, researchers can
better understand the dynamic behavior of the
financial market and explore how to use forecasting
models for hedging, risk avoidance, and asset
allocation optimization. The rest of the paper is
organized in this manner. Particular models are
introduced and the data sources and analysis
techniques are described in the second section. The
experiment's results are presented in the third part,
which also delves further into them and discusses the
study's shortcomings as well as potential future
directions. The fourth section summarizes the whole
article.
2 DATA AND METHOD
For the research, this study utilized data from
2019/7/5 12:00:00 to 2024/8/6 16:00:00, concerning
the hourly prices of Dogecoin in USD and were
divided into a training set consisting of data from
2019/7/5 12:00:00 to 2023-08-01 22:00:00 (32552
values) and a testing set from 2023-08-01 23:00:00 to
2024/8/6 16:00:00 (8139 values). All of the data is
downloaded from the API endpoint provided by
Binance for retrieving hourly candlestick data for
cryptocurrency markets. Candlestick data displays
the open, high, low, and close prices and the trading
volume over the required time period.
To confirm that the model works as intended, it is
necessary to use appropriate testing methods to
examine the predicted results. The results are tested
with the below evaluation metrics. The average of the
absolute discrepancies between the expected and
actual values is known as the mean absolute error, or
MAE. It functions as a gauge for how closely forecast
results match actual results. Here, y represents the
actual value, 𝑦
refers to the predicted value by the
model and n is the number of observations:
MAE =
∑ |
𝑦
−𝑦
|
(1)
The average of the squared discrepancies between
the expected and actual values is known as the mean
squared error, or MSE. MSE quantifies the average
size of the prediction mistakes in a model. Larger
errors are given more weight, which makes them
stand out more when evaluating the model:
MSE =
∑
𝑦
−𝑦
(2)
The percentage of the dependent variable's
variance that can be predicted from the independent
variables is expressed statistically as R-squared (R²):
𝑅
=1−
∑
∑
(3)
Linear regression presupposes a linear
relationship between the independent and dependent
variables, which can be represented by a hyperplane
in the case of several predictors or a straight line in
the case of one predictor. By using the least squares
method, one can discover the best-fitting line or
hyperplane in linear regression. In this set of
experiments, the linear regression model was used as
the control group.
Random Forest operates by constructing many
decision trees and making predictions based on output
of these trees. By averaging the predictions of many
trees, random forest becomes a more generalized
model. In this experiment, after repeated optimization,
the parameters are set as follows:
max_depth=8,n_estimators=90,min_samples_split=1
6,min_samples_leaf=6,oob_score=True,max_feature
s=15.
LSTM was created to solve the problems with
vanishing and exploding gradients that arise in
ordinary RNNs while working with lengthy data
sequences. It introduces three gating units (input gate,
forget gate, and output gate) and these gates help
LSTM decide which information should be
remembered, which should be forgotten, and how the
information influences the output: Input Gate
determines if the memory cell should be updated with
the current input data.
𝑖
= 𝜎
𝑊
⋅
ℎ
, 𝑥
+ 𝑏
(4)
Here, 𝑖
is the output of the input gate, 𝑊
is the
input gate's weight matrix, and 𝑏
is the input gate
bias, ℎ
is the previous hidden state, 𝑥
is the
current input. Forget Gate determines whether the
information previously stored in the memory cell
should be forgotten:
Prediction of DOGE Based on Random Forest, Long Short-Term Memory and Transformer
189

𝑓
= 𝜎𝑊
⋅
ℎ
, 𝑥
+ 𝑏
(5)
Here, 𝑓
is the forget gate output, 𝑊
is the weight
matrix and 𝑏
is the forget gate bias. Candidate
Memory Cell can be described as:
𝐶
=tanh
𝑊
⋅
ℎ
, 𝑥
+ 𝑏
(6)
Here, 𝐶
is the candidate memory cell value, 𝑊
is
the weight matrix, and 𝑏
is the bias. Update Cell
State:
𝐶
= 𝑓
⋅𝐶
+ 𝑖
⋅𝐶
(7)
Here, 𝐶
is the current cell state, and 𝐶
is the
previous cell state. Output Gate:
𝑜
= 𝜎
𝑊
⋅
ℎ
, 𝑥
+ 𝑏
(8)
Here, 𝑜
is the output of output gate, 𝑊
is the
output gate's weight matrix, and 𝑏
is the output gate
bias. Update Hidden State:
ℎ
= 𝑜
⋅ tanh
𝐶
(9)
The purpose is to create the output of the LSTM
model, preserving useful information while
suppressing irrelevant information.
The self-attention mechanism of Transformer
model makes it well-suited for handling time series
data. This mechanism calculates a set of attention
weights for each input vector, focusing attention on
the sections of the sequence that matter the most. In
this experiment, a custom multi-head attention layer
was used. Multi-head attention splits the input into
multiple subspaces and performs attention
calculations independently, then combines the results.
Following the multi-head attention layer, the model
includes a dense layer with 32 units. The dense layer
further processes the output from the multi-head
attention and compresses it into a lower-dimensional
feature representation. Then, the global average
pooling layer is used to convert the sequence of
feature vectors into a single scalar by taking the
average across all time steps in the sequence. This
layer improves training efficiency and stability. It
also helps to prevent overfitting by reducing
redundant features. Finally, the model outputs a
single value through a dense layer, which represents
the predicted value for the time series. In time series
forecasting tasks, this output could be the predicted
price, temperature, or any other continuous variable
for a future time point.
3 RESULTS AND DISCUSSION
3.1 Feature Engineering
The data includes five items: opening, highest, lowest,
closing price and trading volume. The author
conducted a correlation analysis on these five items.
The Figure. 1 displays the findings. Seen from the
results, the Open, High, Low, and Close prices all
have a correlation coefficient of 1 with each other.
This indicates a perfect positive correlation among
these four variables, meaning that these price data
points move in tandem.
On the other hand, Volume has a lower correlation
with the price data, with correlation coefficients
ranging between 0.15 and 0.17. This shows that the
price and trading volume have a poor correlation,
meaning that there is only a weak association between
price fluctuations and trading volume in this dataset.
Since the correlation coefficients of opening,
highest, lowest and closing price are all 1, the author
deleted the three columns of opening, highest and
lowest price. Then, daily closing prices and trading
volumes are normalized to transform the time series
data into the form of a supervised learning set. For the
purpose of prediction, use 80% of the samples as the
training set and 20% as the test set.
Figure 1: Correlation analysis of DOGE Data (Photo/Picture credit: Original).
ECAI 2024 - International Conference on E-commerce and Artificial Intelligence
190
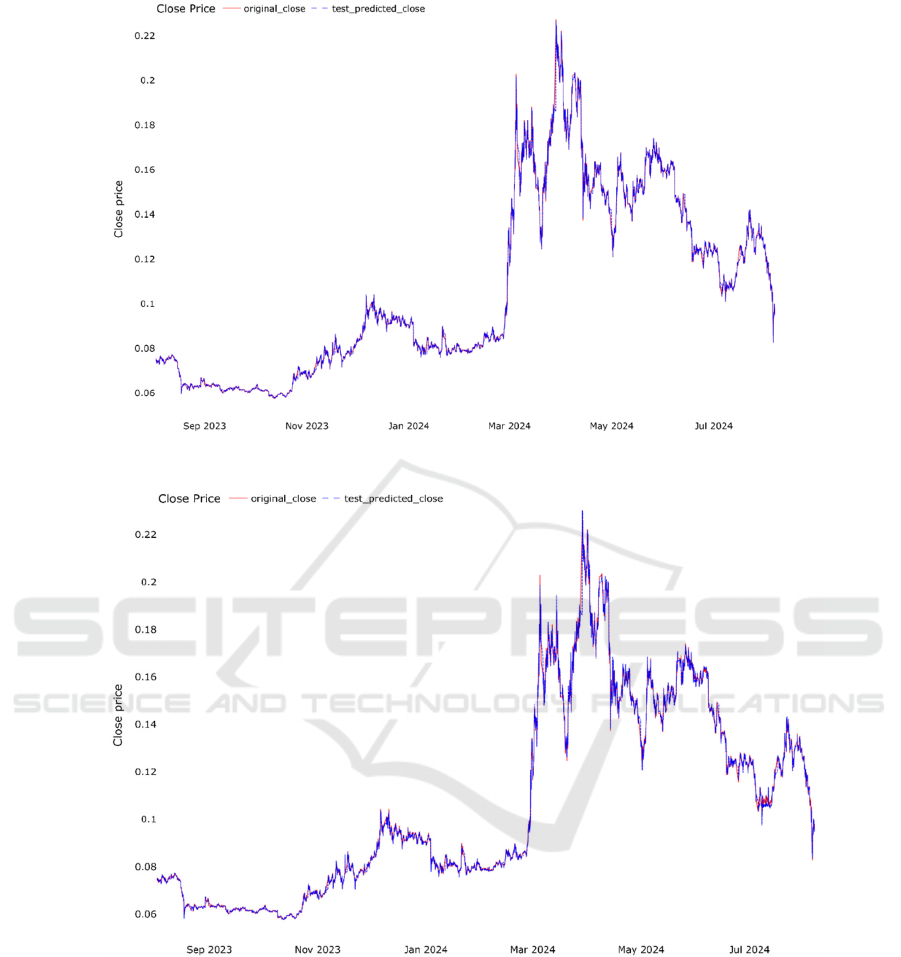
Figure 2: Prediction results of linear regression model (Photo/Picture credit: Original).
Figure 3: Prediction results of random forest model (Photo/Picture credit: Original).
3.2 Model Performance
The Figure. 2 shows the prediction results of the
linear regression model. The MAE value of the model
is 0.0009766767, the MSE value is 0.0000035667,
and the R-squared value is 0.9988252299. Figure. 3
shows the prediction results of random forest model.
The MAE value is 0.0011575186, the MSE value is
0.0000040188, and the R-squared value is
0.9986762996. Figure. 4 depicts the prediction results
of LSTM model. The MAE value of the model is
0.0009608147, the MSE value is 0.0000035197, and
the R-squared value is 0.9989077614. Figure. 5
presents the prediction results of Transformer model.
The MAE value of the model is 0.0027048813, the
MSE value is 0.0000180260, and the R-squared value
is 0.9940644514. Table 1 summarizes the test results
of the trained linear regression model and random
forest model. The indicators of the test model are
MAE, MSE, R
2
.
Prediction of DOGE Based on Random Forest, Long Short-Term Memory and Transformer
191
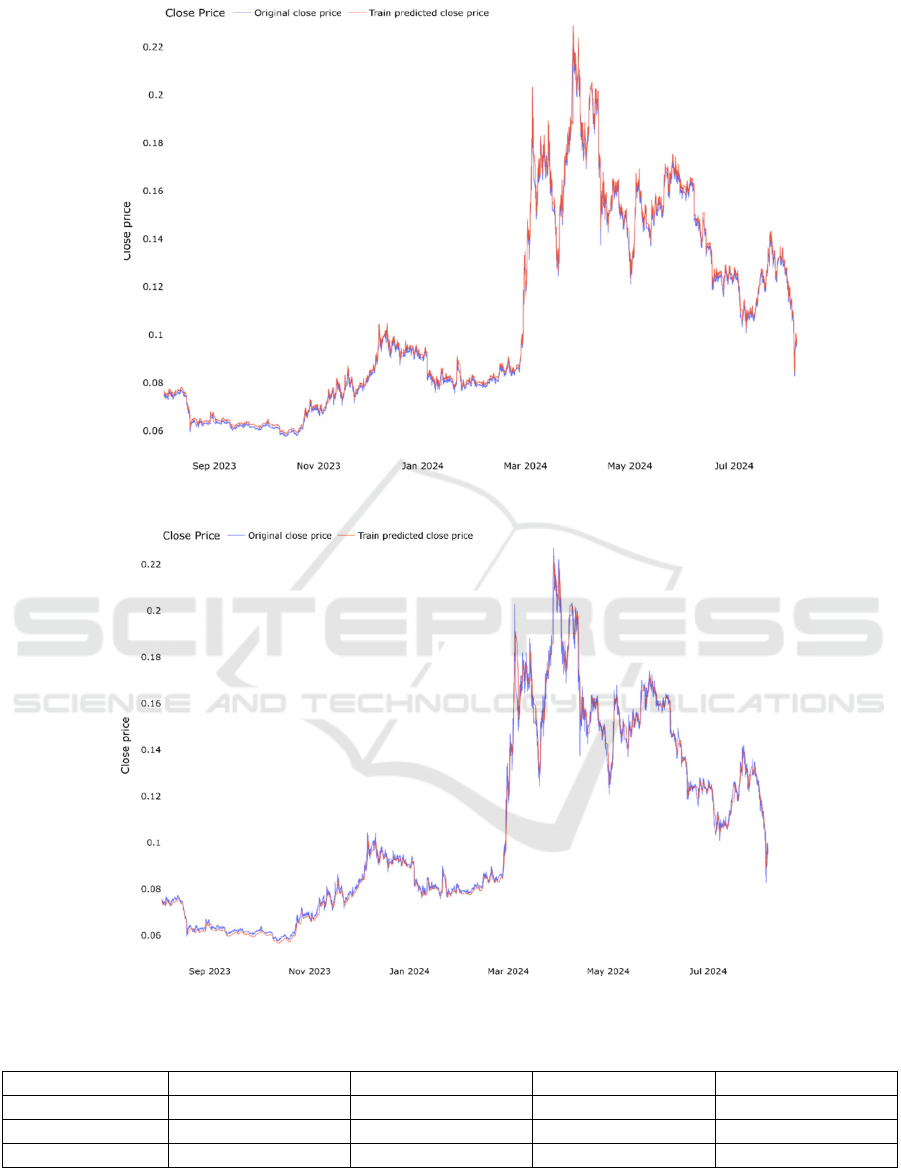
Figure 4: Prediction results of LSTM model (Photo/Picture credit: Original).
Figure 5: Prediction results of Transformer model (Photo/Picture credit: Original).
Table 1: The test results of the models.
Linear re
g
ression Random fores
t
LSTM Transforme
r
MAE 0.0009766767 0.0011575186 0.0009608147 0.0027048813
MSE 0.0000035667 0.0000040188 0.0000035197 0.0000180260
R
2
0.9988252299 0.9986762996 0.9989077614 0.9940644514
ECAI 2024 - International Conference on E-commerce and Artificial Intelligence
192

3.3 Explanation and Implications
Table 1 summarizes the performance of the four
models concerning for the Dogecoin 1-hour interval
price. As shown, The LSTM model performed the
best with an MSE of only 0.0000035197, followed
closely by the linear regression model
(0.0000035667). The random forest model is worse in
terms of mean squared error performance
(0.0000040188), while the Transformer model
performs the worst, with an MSE value of
0.0000180260. The result shows that the LSTM
model is particularly good at capturing temporal
dependencies in sequential data., which is crucial for
time series prediction tasks. The LSTM model was
designed to remember long-term dependencies while
efficiently ignoring irrelevant information, making
them well-suited for predicting short-term trends and
fluctuations in DOGE prices.
LSTM has several advantages over linear
regression and random forest in terms of time series
forecasting. First and foremost, Time series data
including both short- and long-term dependencies
may be precisely captured using LSTM for it has the
ability to store data from earlier time steps and utilize
it to make predictions in the future. In contrast, linear
regression only captures linear relationships between
variables and cannot handle complex temporal
dependencies. Random forest, while capable of
handling nonlinear relationships, is based on decision
trees and is not inherently designed to process
sequential data with time dependencies. Meanwhile,
LSTM can naturally handle nonlinear relationships in
time series. Last but not least, the unique feature of
LSTM is its built-in memory units and forget gates,
which can selectively remember or forget information,
effectively filtering out noise and retaining useful
information. This mechanism allows LSTM to excel
in handling long sequences. Linear Regression and
Random Forest do not have this memory and
selective forgetting mechanism, so their ability to
capture patterns in long time series data is limited.
The transformer model, however, while highly
effective in tasks like natural language processing,
may not be as naturally suited to the time series
prediction task here. Transformers rely on self-
attention mechanisms, which, although excellent at
handling long-range dependencies, may struggle with
capturing the short-term dynamics typical in time
series data. Moreover, the dataset of Dogecoin is
relatively small, the Transformer model can’t learn
the patterns in the time series effectively, leading to
poorer performance.
This experiment explored the accuracy of four
models in predicting the price of Dogecoin and found
a better way to predict the price of Dogecoin. To go
further, some new laws or patterns discovered in the
experiment can become the basis for future research
on time series problems or provide new research
directions for such tasks. At the same time, for
investors, this experiment can help them better
understand the virtual currency represented by
Dogecoin and make profits from investment. Thus,
they can better understand market behavior and
market rules in complex changes, and then explore
how to use predictive models for investing and risk
aversion.
3.4 Limitations and Prospects
This study still has certain limitations. In terms of
data, the hourly price frequency of Dogecoin is too
low, and the price every 5 seconds may help the
model predict more accurately. At the same time, the
number of features of Dogecoin is too small, and
higher-dimensional data can be further collected. In
terms of models, due to limitations of experimental
conditions, the author cannot explore all models, but
there are indeed many valuable models that can be
explored in terms of price prediction of Dogecoin. To
improve this research, the author intends to examine
more methods, such as CNN or the Diffusion model.
At the same time, the author plans to collect more
frequent and more dimensional price data for further
research.
4 CONCLUSIONS
To sum up, this study investigates machine learning
techniques based on sample characteristics of
samples and dimensions to predict Dogecoin prices.
This paper compares the performance of four models,
i.e., Linear Regression, Random Forest, LSTM, and
Transformer, in predicting Dogecoin prices, and finds
that the LSTM model delivers the best results. The
results show that the LSTM model performs much
better than the others because of its robustness in
handling nonlinear interactions and capturing
temporal dependencies. Linear Regression and
Random Forest models underperformed in dealing
with complex time series data, while the Transformer
model also did not meet expectations in this task. The
limitation of this article is that the data volume and
feature dimensions of the sample are small, which
affects the prediction effect of the model. Future
research could focus on optimizing hyperparameters
Prediction of DOGE Based on Random Forest, Long Short-Term Memory and Transformer
193

and exploring larger datasets or more sophisticated
feature engineering methods. The importance of this
research lies in providing a valuable model
comparison for cryptocurrency price prediction in
financial markets, especially highlighting the
potential of the LSTM model in such tasks.
REFERENCES
Aravindan, J., Sankara, R. K. V., 2022. Parent Coin based
Cryptocurrency Price Prediction using Regression
Techniques. In 2022 IEEE Region 10 Symposium
TENSYMP pp. 1-6.
Chohan, U. W., 2021. A history of Dogecoin. Discussion
Series: Notes on the 21st Century, 11.
Dhande, A., Dhani, S., Parnami, S., Vijayakumar, K. P.,
2024, Cryptocurrency Price Prediction Using Linear
Regression and Long Short-Term Memory LSTM.
Academia, 12.
Dogecoin, 2024: Retrieved from https://dogecoin.com/
Nani, A., 2022. The doge worth 88 billion dollars: A case
study of Dogecoin. Convergence, 286, 1719-1736.
Singla, M., Gill, K. S., Chauhan, R., Pokhariya, H. S.,
Lande, J., 2024. Dogecoin price prediction–Through
Utilization of XGBoost Model GridSearchCV
Classification Technique. In 2024 IEEE 9th
International Conference for Convergence in
Technology I2CT pp. 1-6.
Sridhar, S., Sanagavarapu, S., 2021. Multi-head self-
attention transformer for dogecoin price prediction. In
2021 14th International Conference on Human System
Interaction HSI pp. 1-6.
Srivastava, V., Dwivedi, V. K., Singh, A. K., 2023.
Cryptocurrency price prediction using enhanced PSO
with extreme gradient boosting algorithm. Cybernetics
and Information Technologies, 232, 170-187.
Wallbridge, J., 2020. Transformers for limit order books.
arXiv preprint arXiv:2003.00130.
Zhang, S., Mani, G., 2021. Popular cryptoassets Bitcoin,
Ethereum, and Dogecoin, Gold, and their relationships:
Volatility and correlation modeling. Data Science and
Management, 4, 30-39.
ECAI 2024 - International Conference on E-commerce and Artificial Intelligence
194
