
Prediction of Bitcoin Daily Returns Based on OLS, XGBoost,
and CNN Machine Learning Models
Ye He
Faculty of Business and Economics, The University of Hong Kong, Hong Kong, China
Keywords: Bitcoin, Machine Learning, Ordinary Least Squares (OLS), XGBoost (Extreme Gradient Boosting),
Convolutional Neural Network (CNN).
Abstract: This study seeks to predict Bitcoin's daily return through a comparison of three machine learning models:
Ordinary Least Squares (OLS), XGBoost (Extreme Gradient Boosting), and Convolutional Neural Network
(CNN). To assess the effectiveness of these models in capturing Bitcoin market fluctuations, the relevant
market data is first cleaned and standardized, followed by training and testing with the three models. The
findings reveal that the OLS model excels in stable market conditions, exhibiting a smaller prediction error.
Meanwhile, the XGBoost model shows promise in handling nonlinear relationships and market fluctuations,
albeit with a larger prediction error. Unfortunately, the CNN model did not meet expectations, struggling to
effectively capture the market's complex characteristics. According to the analysis, this research highlights
that various machine learning models demonstrate differing applicability for predicting Bitcoin returns across
diverse market environments. Future studies could enhance prediction accuracy by optimizing model
parameters and incorporating additional feature variables.
1 INTRODUCTION
Bitcoin first emerged in 2009 as a digital asset
constructed on the concept of blockchain which is the
inception of the decentralised economy (Mulligan et
al., 2020). By employing a decentralized distributed
ledger and complex encryption algorithms it
guarantees the openness, safety and non-alterability
of the transactions (Benos et al., 2019). Following the
emergence of Bitcoin, blockchain technology has
been gradually introduced into several various
industries of service industry including financial
services, supply chain industry, smart contracts and
so on which has greatly driven the progress of
blockchain technology (Hughes et al., 2019).
However, with the development of Bitcoin. Its huge
energy consumption problem has become one of the
main concerns, the computational process in the
mining of the Bitcoin consumes a lot of energy, and
this leads to high energy consumption issues (Gad et
al., 2022). Furthermore, the problem of forks is also
haunting Bitcoin, which mainly arises due to the
discord in the community regarding formation of new
chains and market fluctuations (Kumari et al., 2023).
These technical and market uncertainties have
exacerbated the market risks of Bitcoin, especially in
the absence of a clear regulatory framework (Tripathi
et al., 2023).
In the last few years with the emergence of
Bitcoin and other cryptocurrencies the prediction of
their price movements has become an important area
of interest in both academia and financial markets.
Previous research employed conventional
econometric models including time series, and linear
regression models to forecast the Bitcoin prices,
however, because of the high fluctuation and non-
linearity of the Bitcoin market, these conventional
techniques provide less accurate prediction (Chen,
2023). For this purpose, the growing number of
studies has adopted machine learning process to
predict the Bitcoin price because these models can
learn the complex patterns and non-linearity in the
market (Ho et al., 2021). For instance, the models
employed include support vector machines (SVM),
random forests as well as the long short-term memory
networks (LSTM); and these models yield high
accuracy in the context of Bitcoin price prediction
(Ampountolas, 2023). Besides, some studies have
also used enhanced models like Gated Recurrent
Units (GRU) and Deep Neural Networks (DNN) for
enhancing the Bitcoin price prediction system (Seabe
et al., 2023). These models hold the following
He, Y.
Prediction of Bitcoin Daily Returns Based on OLS, XGBoost, and CNN Machine Learning Models.
DOI: 10.5220/0013212400004568
In Proceedings of the 1st International Conference on E-commerce and Artificial Intelligence (ECAI 2024), pages 181-187
ISBN: 978-989-758-726-9
Copyright © 2025 by Paper published under CC license (CC BY-NC-ND 4.0)
181

advantages in capturing market changes by handling
features and complex relations between the features.
Despite advancement of machine learning models
in the Bitcoin price prediction, there are some
limitations and future research gaps in the study. For
instance, some studies have directly fed data into the
model without taking into consideration factors such
as data frequency, sample dimension and feature
selection which leads to overfitting of the model or
unstable prediction (Khedr et al., 2021). The
development of future research can enhance the data
preprocessing and feature engineering steps and can
investigate the way of enhancing the performance and
stability of the model under more frequent and
different sample data (Ji et al., 2019).
The motivation of this study arises from the fact
that the market of Bitcoin is highly unpredictable and
has a lot of uncertainties and the daily returns of
Bitcoin is a difficult task but it is very important due
to the fluctuating nature of the Bitcoin market. First,
the context of the Bitcoin market and the role of return
forecasting are discussed, and then the source and
features of the data set used, and finally the
theoretical foundation and concrete implementation
steps of the three models are explained and
introduced. Subsequently, through the process of
training and testing the models, the accuracy of the
models in estimating the returns of Bitcoin daily, the
error analysis and the strengths and weaknesses of the
models in the sense of capturing the market dynamics
are presented.
2 DATA AND METHOD
The data for this research is therefore obtained from
the investment platforms investing. com and Yahoo
Finance. The sample includes over 1,000 trading days
of Bitcoin. These data include the following main
variables: These are Date, Open, High, Low, Close,
Adjusted Close, Volume, and Return. Among them,
the return is the main dependent variable of this study.
First, this study started with data cleansing and after
deleting all the missing values, outliers for the sake of
data integrity and data consistency. All numerical
variables were normalized and this helps to avoid
problems associated with differing feature
magnitudes which in turn stabilizes the model
training. Likewise, this study also computed
correlation matrix to have more insight on the co-
relation among the different features.
This study employed three forms of regression
models in order to forecast the daily return of Bitcoin.
The three machine learning models are Ordinary
Least Squares (OLS), XGBoost (Extreme Gradient
Boosting), and Convolutional Neural Network
(CNN).
This research selected the Ordinary Least Squares
(OLS) model, which is the simplest linear model, as
the basic model for predicting the daily return of
Bitcoin. OLS model retains that there is a straight line
relationship between the target variable and the input
features and seeks for the best line that would bring
out the least mean squared error. This method of
linear regression is very useful for initial analysis of
the data for the presence of linear relations and serves
as a basis for subsequent more complex models. This
study separated the whole data set into training data
and testing data in the proportion of 7:3. This division
makes it possible for the model to learn on enough
data as well as make a proper performance evaluation
on the unseen data. In training phase, the weights are
updated iteratively to estimate a straight line which
minimizes the sum of squared errors between
predicted and actual value. Such a process helps the
model to learn the correlation between the input
features and the yields in Bitcoins.
XGBoost is based on the gradient boosting
decision trees and has high nonlinear modeling
abilities. While compared with simple linear models,
XGBoost can learn deeper and more complex
relationships between input features and target
variables, which will make XGBoost better than the
others when dealing with data contains nonlinear
features. In case of using the XGBoost model, it is
important to standardize the input features so that the
features are in the same units. To achieve better
results of the model, this study applied the grid search
and cross-validation to adjust the parameters of the
model. These hyperparameters include learning rate,
maximum tree depth and others which define the
capability of the model on prediction. Once optimized
the parameter tuning, then this paper proceeded to
train the XGBoost model using the training data set.
XGBoost constructs a series of decision trees and
with the new tree trying to minimize the prediction
error of the previous tree and hence, achieving
improvement in the efficiency of the model.
CNN is a machine learning model that is typically
employed for the processing of images, however for
this particular research, this study trained it on time
series data. CNN models enable the learner to learn
complex patterns and nonlinear relationships in the
data and therefore have an added advantage in
estimating Bitcoin’s daily return. First, in view of the
CNN model input format, this study enlarged the data
from two-dimensional format to three-dimensional
tensor. Subsequently, one developed a CNN model
ECAI 2024 - International Conference on E-commerce and Artificial Intelligence
182
with more than one convolutional, pooling and fully
connected layers. The convolutional layer performs
feature extraction of the data locally while the pooling
layer reduces the dimension of features and also
offers protection against overfitting of the data; full
connection layer establishes the connection between
the high dimensional features and the output layer to
produce the final prediction.
In order to assess the performance of each model
more comprehensively this study used the same
metrics to compare the OLS, XGBoost, and CNN
models on the test set. This was made possible by the
use of additional model evaluation metrics including
the R-squared (R²), mean absolute error (MAE), and
the mean squared error (MSE). The nearer the value
of R² to 1, the better the fitting of the model to the
data; the smaller the MAE, the smaller is the
prediction error of the model and the MSE is another
measure which is more sensitive to large errors.
3 RESULTS AND DISCUSSION
3.1 Correlation Analysis
In this study, for the purpose of determining the
feature variables with the highest correlation to
Bitcoin’s daily yield, this study ran a correlation
analysis on the data set and depicted it with the help
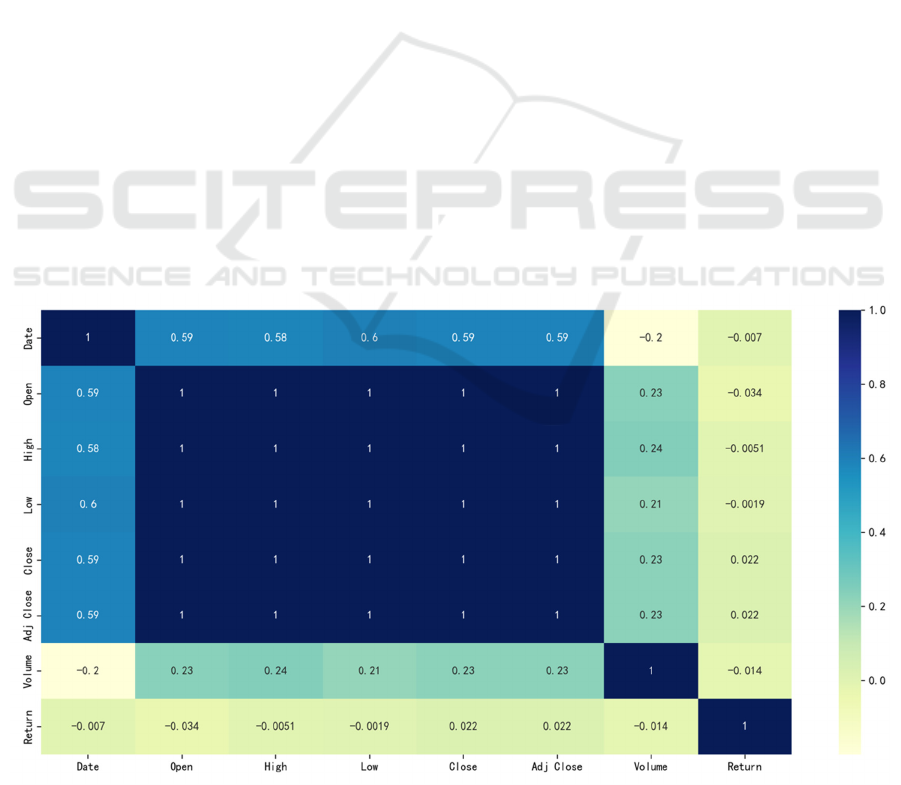
of a heat map (seen from Fig. 1).
From the heat map, the five price-related variables,
namely the Open, High, Low, Close and the Adj
Close, have almost perfect positive relationship and
the coefficient of correlation is also close to 1. Since
these variables are highly correlated, this has to
screen among them in a way to prevent
multicollinearity from affecting the model’s ability to
predict. In light of this, it decided to use only the
variables with the highest correlation to the yield
while excluding those which are redundant and might
add more noise to the model. In fact, return has a
much weaker relationship with each variable, with
correlation coefficients at -0.034 with opening price.
The correlation between 014 with Volume is 0.022
with adjusted closing price.
When choosing features, this study was concerned
with those that are most related to yield. However, it
is clear from the heat map that these variables are not
very much correlated with the yield; still, this
researcg chose Open, Volume, Close, and Adj Close
as the independent variables of the model. Despite the
fact that Open has a rather low coefficient of
dependence, it plays a significant role in prediction,
as it is the initial price of the market (as depicted in
Fig. 2). Volume shows the operation of the market
and has influence on yield in potential. Although
Close and Adj Close have a very low association with
yield, they still have some predictive value for the
change in yield, hence they are added into the model
equation.
Figure 1: Heat Map of Five Price-Related Variables (Photo/Picture credit: Original).
Prediction of Bitcoin Daily Returns Based on OLS, XGBoost, and CNN Machine Learning Models
183
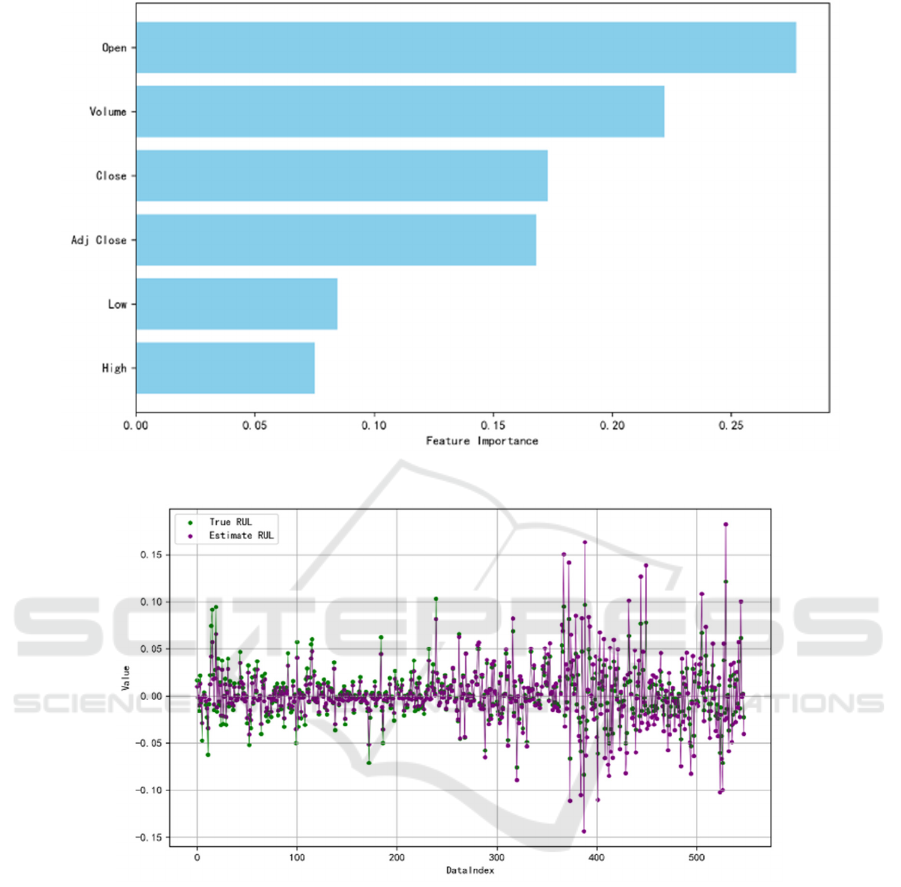
Figure 2: Feature Importance in Financial Model (Photo/Picture credit: Original).
Figure 3: OLS Model Performance (Photo/Picture credit: Original).
3.2 Performance of the Models
As shown in Fig. 3, the values predicted by the OLS
model are highly correlated to the actual values. First,
the coefficient of determination, R² is 0.7499, which
means that the accuracy of the model is about 75%
that is a high level in the financial time series
forecasting. This study also obtained the MSE and
MAE which is 0.000164 and 0.0076 respectively. The
value of MSE is low, which suggests that the total
error of the model is low in the forecast of daily
returns; while the value of MAE also shows that the
average error of the model is also small in the forecast
of daily returns. According to the evidence provided
in the graph, it is clear that the OLS model which is
relatively easy to use has great predictive power for
the trend of Bitcoin daily yield.
However, for periods of high turbulence in the
market, the prediction error is higher than has been in
other cases. This means that the OLS model might not
be so effective in the analysis of extremely nonlinear
or turbulent periods in history. For this reason, it is
important to incorporate other methods that might
help remedy the weaknesses of the OLS analysis,
hence the need to further consider XGBoost and CNN
models in this study.
ECAI 2024 - International Conference on E-commerce and Artificial Intelligence
184
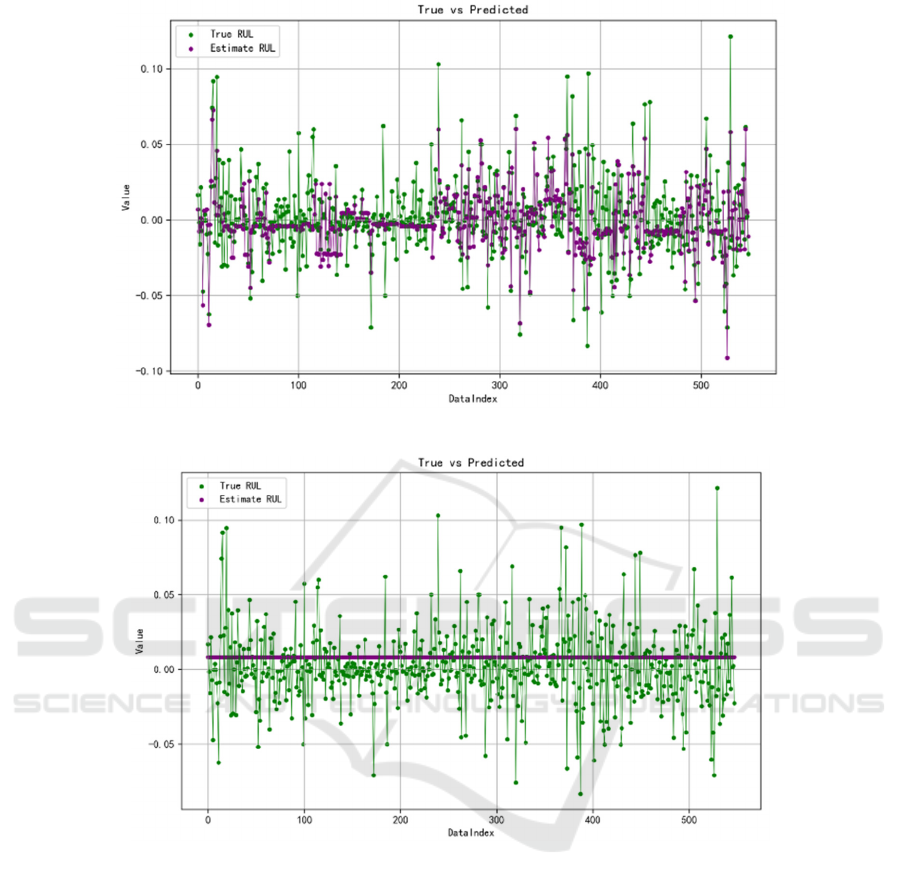
Figure 4: XGBoost Model Performance (Photo/Picture credit: Original).
Figure 5: CNN Model Performance (Photo/Picture credit: Original).
As shown in Fig. 4, the model records an R2 value
of 0.5291 meaning that it is possible to capture only
slightly more than half of the variations in the data by
employing XGBoost. Despite this R
2
value which
makes room for more complexities by XGBoost, the
explanatory power of the XGBoost model is
compromised against the OLS model. This could be
because in the time series of Bitcoin’s daily return
data, linear features are quite powerful and ordinary
structures do not work for such data but XGBoost
excels in nonlinearities. Thus, regarding this portion,
there remains little scope in using XGBoost to
improve upon the performance level of OLS. In
addition, the MSE of the XGBoost model is 0.00031,
which is significantly higher than the 0.000164 of the
OLS model, indicating that the overall prediction
error of the model is large. The MAE is 0.0123, which
is also higher than the 0.0076 of the OLS model,
further confirming that XGBoost is not as stable as
OLS on the current dataset.
Therefore, it can be stated that while using the
XGBoost model one can solve complex patterns to a
certain extent; however, its performance in terms of
predicting Bitcoin’s daily yield is lower than the OLS
model. This may mean that while XGBoost has an
edge of capturing intricate non-linear patterns, some
of these non-linear features are not very important in
today’s data set, or that because of the model’s
complexity, it over trains during the training phase
and thus has poor performance in the test data.
Prediction of Bitcoin Daily Returns Based on OLS, XGBoost, and CNN Machine Learning Models
185

In theory, CNN works quite well in capturing
patterns; however, its performance in the present
study is not very impressive as clearly deduced from
Fig. 5. To be specific, the coefficient of determination
(R²) of the CNN model is -0.0369, which is dwarfed
by the OLS and XGBoost models, most likely
because the model has been able to capture very little
useful information. What this demonstrates is that the
OLS outperforms R² of these models where R²
approaches the range of zero or thereabouts are rare.
This shows the limitation of this CNN in such,
Keywords: R², degeneracy, prediction accuracy,
convolution neural networks.
In addition, it should be mentioned that the
performance of the CNN model is disappointing
when measured by MSE or MAE metrics. The MSE
was recorded at 0.000682, almost four times the
shagger OLS model, which implied an even larger
difference between the predicted and the actual
outcome. The MAE is 0.0179, which as well fixed the
high value and cannot be related to OLS models and
XGBoost models. Such high error indicators imply
that the CNN model is not very reliable in making
predictions of Bitcoin per day yield and predictions
made have fairly conspicuous bias.
In light of these results, it can be inferred that the
CNN model could be deficient for many reasons. First,
even though CNN is well-established and enjoyed
great advances in image processing, its convolution
operation may not be sufficient for forecasting, and
capturing the complex dependencies of time-series
financial data. More particularly, with regards to
financial assets like Bitcoin which tend to be very
volatile as well as nonlinear in nature, learning useful
patterns from sparse training data can be a daunting
task for CNN. Second, the model design and
parameterization of the CNN may also be prohibitive.
3.3 Discussion and Recommendations
The OLS model is satisfactory, evidenced by R² value
of 0.7499 meaning the model is capable of explaining
around 75% of the variability of such data.
Additionally, both MSE and MAE's mean square
error recording low figures of 0.000164 and 0.0076
respectively. This preliminary finding serves to
confirm that the daily return on Bitcoin can be
modelled with a certain degree of stability linearity
which the OLS can model more correctly when it is
not in a volatile market.
However, in complex and volatile environments,
additional knowledge is rendered from the XGBoost
model. It indicates that the R-squared measure
(0.52891) among considered XGBoost approaches is
not especially impressive, although it does indicate
some potential in a nonlinear modeling context. Due
to the ensemble approach employed by XGBoost,
various decision trees that the algorithm contains,
XGBoost is more adaptive to abrupt changes in the
market. Despite the fact that XGBoost has an MSE of
0.00031 and a MAE of 0.0123, both higher than the
OLS model, such errors seem to be typical for such
types of models, 'XGBoost' may be useful in targeting
reversals and abnormal returns.
On the other hand, the accuracy of the CNN model
leaves much to be desired. The R-squared figure for
the CNN model can be calculated at -0.0369, where
all other external models that have OLS and XGBoost
have fared better, which means that CNN has almost
closed out on viable market data. Its MSE is 0.000682
and MAE is 0.0179, which are not promising results
compared with any reasonable prediction in this task.
From the insights provided through the above
discussion, this study obtained several key
investment suggestions. First, in a less favorable
market, passive investments using statistical linear
models based on OLS may be efficient and would
stabilize returns, which is quite useful for low-risk
individuals. Second, when volatile, an investor can
seek complex relations based on nonlinear models
such as XGBoost, though this has its limitations as
there are large prediction errors that come with such
models. However, while parts of deep learning
models like CNN are efficient in other areas like
image classification, in the treatment of daily yield of
Bitcoin, where there is financial time series data is
high volatility and complex, their merits do not shine
as they should, thus a combination with other
approaches focusing on reducing errors is required.
3.4 Limitations
However, this study has some shortcomings and
defetcs. First, the dataset do not include certain
phenomena for which many experts seek correlation
with the price of bitcoin, such as macroeconomic
variables or voting behavior of the market; secondly,
hyper-parameter tuning of XGBoost and CNN is also
not sufficiently addressed. This could be a limitation
on the maximum ability of these models; furthermore,
this study has not examined the use of combined
models and their predictive enhancement. Future
studies in this area may be directed to the broadening
intensity of the data set scope, further focusing on the
model parameters, employing less rigid data layer
segmentation strategies, and assessing the potential of
hybrid models in enhancing the prediction effect.
ECAI 2024 - International Conference on E-commerce and Artificial Intelligence
186

4 CONCLUSIONS
To sum up, this paper aims to investigate the
predictive capacity of OLS, XGBoost, and CNN
decision-making models on the daily return of Bitcoin
and study the performance of various models with
time series of financial data. The findings state that
the econometric OLS model is reliable under low
market volatility and offers reasonable level
inaccuracies of predictions; the XGBoost model
possesses high potential in nonlinear and even
cyclical relationships and variations of the market,
although its inaccuracies are high always; and state
the goal of the CNN model for this study was
overstated as it was unable to appropriately track the
diverse movements of bitcoin price ranges. The
shortcomings of this paper include the scope of the
data set, the lack of thorough consideration of
macroeconomic factors to examine their effects on
the bitcoin prices and the model parameters tuning
that could have been enhanced. It would also be
necessary to advance the level of parameter masking
and look for more accurate models that can withstand
the ups and downs of the price.
REFERENCES
Ampountolas, A., 2023. Comparative Analysis of Machine
Learning, Hybrid, and Deep Learning Forecasting
Models: Evidence from European Financial Markets
and Bitcoins. Forecasting, 52, 472–486.
Benos, E., Garratt, R., Gurrola-Perez, P., 2019. The
Economics of Distributed Ledger Technology for
Securities Settlement. Ledger, 4.
Chen, J., 2023. Analysis of Bitcoin Price Prediction Using
Machine Learning. Journal of Risk and Financial
Management, 161, 51.
Dutta, A., Kumar, S., Basu, M., 2020. A Gated Recurrent
Unit Approach to Bitcoin Price Prediction. Journal of
Risk and Financial Management, 132, 23.
Gad, A. G., Mosa, D. T., Abualigah, L., Abohany, A. A.,
2022. Emerging Trends in Blockchain Technology and
Applications: A Review and Outlook. Journal of King
Saud University - Computer and Information Sciences,
349, 6719–6742.
Ho, A., Vatambeti, R., Ravichandran, S. K., 2021. Bitcoin
Price Prediction Using Machine Learning and
Artificial Neural Network Model. Indian Journal of
Science and Technology, 1427, 2300–2308.
Hughes, A., Park, A., Kietzmann, J., Archer-Brown, C.,
2019. Beyond Bitcoin: What blockchain and distributed
ledger technologies mean for firms. Business Horizons,
623, 273–281.
Ji, S., Kim, J., Im, H., 2019. A Comparative Study of Bitcoin
Price Prediction Using Deep Learning. Mathematics,
710, 898.
Khedr, A. M., Arif, I., P V, P. R., El-Bannany, M.,
Alhashmi, S. M., Sreedharan, M., 2021.
Cryptocurrency price prediction using traditional
statistical and machine
‐
learning techniques: A
survey. Intelligent Systems in Accounting, Finance and
Management, 281, 3–34.
Kumari, V., Pradip Kumar Bala, Chakraborty, S., 2023. An
Empirical Study of User Adoption of Cryptocurrency
Using Blockchain Technology: Analysing Role of
Success Factors like Technology Awareness and
Financial Literacy. Journal of Theoretical and Applied
Electronic Commerce Research, 183, 1580–1600.
Mulligan, C., Godsiff, P., Brunelle, A., 2020. Boundary
Spanning in a Digital World: The Case of Blockchain.
Frontiers in Blockchain, 3.
Seabe, P. L., Moutsinga, C. R. B., Pindza, E., 2023.
Forecasting Cryptocurrency Prices Using LSTM,
GRU, and Bi-Directional LSTM: A Deep Learning
Approach. Fractal and Fractional, 72, 203.
Tripathi, G., Ahad, M. A., Casalino, G., 2023. A
Comprehensive Review of Blockchain technology:
Underlying Principles and Historical Background with
Future Challenges. Decision Analytics Journal, 91,
100344.
Prediction of Bitcoin Daily Returns Based on OLS, XGBoost, and CNN Machine Learning Models
187
