
Novel Portfolio Construction Based on Stocks, Traditional Stock
Indices, Futures and Cryptocurrencies
Chang Su
Department of Commerce, Macau University of Science and Technology, Macau, China
Keywords: Mean-Variance Model, Maximum the Sharpe Ratio, Minimum the Risk.
Abstract: As emerging assets continue to develop, they are increasingly integrated into traditional portfolio construction.
Given that these new asset classes often exhibit low correlation with traditional assets, their inclusion can
enhance overall portfolio performance. This study, based on Markowitz's mean-variance theory, utilizes five
years of historical data to construct a portfolio consisting of six assets, including stocks, traditional stock
indices, futures, and cryptocurrencies. Two objective functions are applied: maximum the Sharpee ratio and
minimum variance. According to the analysis, the results demonstrate that the portfolio optimized for the
maximum Sharpee ratio achieves the highest returns, while the portfolio optimized for minimum variance
shows better stability. By comparing asset weights and cumulative net value chart, the effectiveness of these
objective functions in portfolio optimization is validated. This research contributes to the literature by
illustrating how Modern Portfolio Theory (MPT) can be used to combine traditional and new asset classes to
meet diverse investment objectives.
1 INTRODUCTION
Since its introduction in the mid-20th century,
portfolio theory has undergone significant
development. In 1952, Harry Markowitz introduced
the mean-variance optimization framework, which
laid the foundation for modern portfolio theory
(Markowitz, 1952). Markowitz’s theory emphasized
reducing risk and optimizing returns through the
construction of diversified portfolios with assets that
are not perfectly correlated.
Following Markowitz, William Sharpee's Capital
Asset Pricing Model (CAPM), proposed in 1964,
extended this theory by introducing the concept of the
Security Market Line, which establishes the
relationship between risk and expected return,
assisting investors in evaluating asset performance
under market equilibrium (Sharpee, 1964). Eugene
Fama's Efficient Market Hypothesis (EMH),
proposed in 1970, challenged the traditional
assumptions of market rationality and impacted
portfolio management (Fama, 1970). Behavioral
finance and risk factor models further enriched
portfolio theory. Others’ prospect theory revealed
common irrational behaviors in investor decision-
making (Kahneman & Tversky's, 1979), while Fama
and French's three-factor and five-factor models
advanced the understanding of risk premiums and
returns (Fama & French, 1993).
With technological advancements, the integration
of big data and machine learning has provided new
tools for portfolio optimization. Others found that
deep learning and reinforcement learning algorithms
can enhance the accuracy and efficiency of
investment decisions (He & Liao, 2021). Additionally,
the rise of high-return cryptocurrencies offers new
perspectives for portfolio development (Chen & Liu,
2022). In recent years, research on portfolio
construction has increasingly incorporated emerging
asset classes and advanced technologies to improve
traditional optimization methods.
When integrating futures into traditional
portfolios, scholars analysed the role of commodity
futures (Gorton & Rouwenhorst, 2021). Their study
indicates that commodity futures, due to their low
correlation with traditional assets, can effectively
hedge against inflation and market volatility (Gorton
& Rouwenhorst, 2021). Similarly, Szymanowski
(2021) explored the role of commodities in portfolios,
finding that they offer distinct risk-return
characteristics compared to traditional financial
assets, thereby enhancing overall portfolio
performance (Szymanowski, 2021).
Cryptocurrencies, as a new asset class, are
Su, C.
Novel Portfolio Construction Based on Stocks, Traditional Stock Indices, Futures and Cryptocurrencies.
DOI: 10.5220/0013208700004568
In Proceedings of the 1st International Conference on E-commerce and Artificial Intelligence (ECAI 2024), pages 175-180
ISBN: 978-989-758-726-9
Copyright © 2025 by Paper published under CC license (CC BY-NC-ND 4.0)
175
increasingly being added to traditional portfolios.
Some researchers discovered that cryptocurrencies,
with their low correlation and high return potential,
effectively diversify traditional portfolio risks and
improve risk-adjusted returns (Chen & Liu, 2022).
Some advanced technologies also promote the
development of portfolio research. The introduction
of machine learning techniques has provided new
methods for portfolio optimization. He and Liao
explored the application of deep learning and
reinforcement learning in portfolio management,
showing that these algorithms can identify market
patterns, refine investment strategies, and enhance
prediction accuracy (He & Liao, 2021). The role of
big data analysis has also been widely studied. Guo
and Lin found that sentiment analysis and market data
can enhance market trend forecasting and improve
risk management (Guo & Lin, 2022). Blockchain
technology further improves transparency and
efficiency in portfolio management. Zhang and Liu
noted that blockchain technology, through smart
contracts, automates transactions, reduces
intermediary costs, and enhances data security
(Zhang & Liu, 2023). Additionally, ESG
(Environmental, Social, and Governance) factors
have become a significant aspect of portfolio
management. Sullivan and Mackenzie found that
incorporating ESG standards not only improves
social responsibility performance but also generates
long-term financial returns (Sullivan & Mackenzie,
2021). These studies emphasize that integrating
emerging assets and technologies provides new
perspectives and tools for portfolio construction.
Although traditional portfolio theory offers
effective risk management tools, it encounters
limitations when dealing with emerging assets such
as cryptocurrencies. Introducing cryptocurrencies
into the portfolio provides new development
opportunities. The low correlation and high return of
cryptocurrencies compared to traditional stock
indices and futures give them unique value in asset
allocation. This study selects six assets and uses five
years of data to construct the portfolio based on
Markowitz's mean-variance theory, applying two
objective functions: maximizing the Sharpee ratio
and minimizing variance. Subsequently, by
comparing the asset weights and cumulative net value
charts of portfolios optimized with these two
objective functions, it is found that the portfolio
optimized for maximizing the Sharpee ratio achieves
the highest returns, while the minimum variance
portfolio maintains better stability, thus validating the
effectiveness of the model.
2 DATA AND METHOD
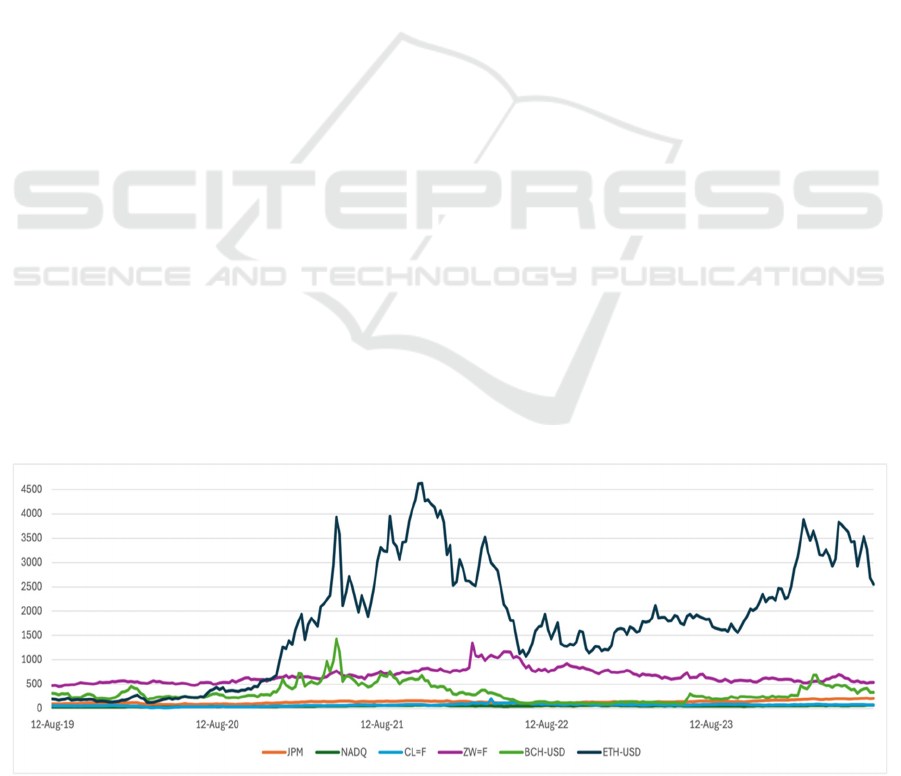
The data for six assets of the portfolio in the paper
comes from Yahoo Finance (Yahoo Finance, n.d.). As
shown in Figure. 1, these assets are JPMorgan Chase
& Co., NASDAQ, Crude Oil Futures, Wheat Futures,
Bitcoin Cash to US Dollar and Ethereum to US Dollar.
To ensure the validity of the portfolio, this paper uses
weekly data for five years from August 2019 to
August 2024. The six asset types selected are stocks,
traditional stock indices, futures and cryptocurrencies.
As a financial instrument, stocks are an indispensable
part of every portfolio. The traditional stock index has
low volatility, which provides the basic risk
protection for this portfolio. In addition, commodity
futures often move differently from stock prices,
which can hedge portfolio risk. Cryptocurrencies as a
new asset can add overall returns to the portfolio with
their high risk and high returns. Therefore, these four
different types of assets were chosen.
Figure 1: price change curves for six assets (Photo/Picture credit: Original).
ECAI 2024 - International Conference on E-commerce and Artificial Intelligence
176

Figure 2: Efficient frontier retrieved by Excel (Photo/Picture credit: Original).
This paper use Excel to construct the portfolio.
Mean-variance model proposed by Markowitz is the
basis of portfolio construction in this paper. The
mean-variance model indicates that investors define
the standard deviation as the risk of the portfolio, and
the expected return is defined as the return of the
portfolio. This theory helps investors maximize
returns or minimize risks under different portfolio
risks. Based on the hypothesis that investors are
rational economic people, investors will adjust their
portfolios according to the behavior of the mean-
variance. When the expected return rate is the same,
the low-risk portfolio will be chosen. Additionally,
when the risks are the same, they will choose the high
return portfolio. According to Mean-variance model,
Using the Eq. (1) to achieve theExpected return of
portfolio:
𝑅
= 𝑊
∗𝜇 (1)
Here, 𝑅
is expected return of portfolio return, and 𝑊
is the weight of the selected asset. 𝜇 is expected
return of selected asset. Eq. (2) is used to calculate the
risk of the portfolio return:
𝜎
=
√
𝑊
∗𝛴∗𝑊 (2)
where 𝜎
is the standard deviation of the portfolio and
𝛴 is the covariance matrix of selected asset return
This paper utilizes two objective functions to
optimize the portfolio return and illustrates in the
Figure. 2. The first objective is to minimize the
standard deviation of portfolio. This approach focuses
on reducing portfolio risk by minimizing standard
deviation. Investors are risk averse, therefore
undoubtfully they choose the portfolio with lower risk
under the same expected return. The Eq. (3) of this
objective function is shown as:
𝑚𝑖𝑛𝜎
= 𝑚𝑖𝑛
√
𝑊
∗𝛴∗𝑊 (3)
It is limited by the following constraints.
∑
𝜔
=1 (4)
𝜔
≥ 0 𝑓𝑜𝑟 𝑎𝑙𝑙 𝑖 (5)
The second objective is to maximum the Sharpee
ratio of the portfolio. The Sharpe ratio is used to
measure the excess return of each unit of risk. A
higher Sharpe ratio means that the investment
portfolio can obtain higher excess returns after taking
certain risks. Thus, investors can use the Sharpee ratio
to select the portfolio that receives the highest excess
return for the same level of risk. The objective
function is illustrated following:
𝑀𝑎𝑥 𝑆ℎ𝑎𝑟𝑝𝑒 𝑟𝑎𝑡𝑖𝑜 = 𝑀𝑎𝑥
(
)
(6)
Here, 𝐸𝑅
is the expected return of portfolio, 𝑅
is
the risk-free interest rate, 𝜎
is the standard deviation
of the portfolio.
3 RESULTS AND DISCUSSION
3.1 Effective Frontier
The paper is based on these six assets using Excel to
simulate 50000 times of portfolio with different
weights. As illustrated in the Figure. 2, the shadow
formed by the blue scatter is the feasible set of this
portfolio. The upper boundary of the feasible set is the
efficient frontier. Under the certain risk, the points on
the efficient frontier are the portfolios that bring the
highest returns to investors, so these portfolios can
attract more investors to invest. The investment
portfolio studies in this paper are the minimum risk
portfolio and the maximum Sharpe ratio portfolio.
Both are portfolios that ultimately achieve the best
returns through asset allocation.
3.2 Model Performance
In the maximum Sharpe ratio portfolio (as shown in
Table 1), Ethereum has the largest weight, which is
41.24%. The asset with the smallest weight is Bitcoin
Cash at -10.58%, which indicates that Bitcoin Cash is
short. Maximizing the Sharpe ratio indicates the
highest excess return per unit risk. This portfolio buys
and holds the most Ethereum, illustrating that
investors are optimistic about the development
prospects of cryptocurrencies. In this portfolio,
cryptocurrencies can bring high return (Corbet et al.,
2018). Ethereum is a more flexible decentralized
application app. Compared with the digital currency
-0,05
0
0,05
0,025 0,075 0,125 0,175 0,225 0,275 0,325 0,375 0,425 0,475
Portfolio return
Portfolio risk
Efficient frontier
Novel Portfolio Construction Based on Stocks, Traditional Stock Indices, Futures and Cryptocurrencies
177
Bitcoin, it has a wider range of uses, such as providing
infrastructure for decentralized finance, non-fungible
tokens, and other blockchain application (VanEck,
n.d.). Therefore, Ethereum is more innovative and has
great room for development, which bring more return
to the portfolio. Shorting Bitcoin is to hedge the risks
of the cryptocurrency market. When the price of
Ethereum falls, part of the loss will be offset by
shorting Bitcoin Cash, thereby reducing the volatility
of the portfolio.
In the minimum risk portfolio, the Nasdaq index
has the largest weight, 48.05%, and Ethereum has the
smallest weight, -2.52%, indicating shorting
Ethereum. Since the portfolio seeks to minimize the
risk of the portfolio, the largest asset weight is placed
on the Nasdaq index. The index represents many
technology stocks that have strong profitability and
low volatility. Shorting high-yield and high-risk
Ethereum helps reduce the volatility of the entire
portfolio.
Comparing the two portfolios, JPMorgan Chase is
a large financial institution, which leads to more
stable stocks, so it accounts for a small proportion in
the maximum Sharpe ratio portfolio, and the risk is
higher in the portfolio that pursues the lowest risk, but
the difference in the proportion of JPMorgan Chase
in the two portfolios is not large, indicating that
JPMorgan Chase can play a stable market
performance in both asset portfolios. Crude oil
futures and wheat futures are commodities with high
volatility and are affected by various economic
factors such as exchange rates and supply and
demand. Therefore, the proportion of futures in the
two portfolios is quite different. The maximum
Sharpe ratio portfolio uses two futures to increase the
return of the portfolio, while another portfolio uses
less asset weight allocation to reduce risk.
Table 1: Asset weights of selected portfolio.
Weights
Maximum
Sharpe ratio
Minimum risk
JPM 0.2171687 0.257923747
NADQ 0.2632056 0.48055297
CL=F 0.1022184 0.029643431
ZW=F 0.1108830 0.029643431
BCH_USD -0.1058841 0.010999937
ETH_USD 0.4124083 -0.025222376
Table 2: Performance of two selected portfolio.
Portfolio risk
Portfolio
return
Sharpe
ratio
Maximum
Shar
p
e ratio
0.047 0.008 0.163
Minimum ris
k
0.028 0.003 0.097
As shown in Table 2, the portfolio risk, portfolio
return, and Sharpe ratio of the minimum risk portfolio
and the maximum Sharpe ratio portfolio are
calculated. As can be seen from the table, the
maximum Sharpe ratio portfolio has a higher return
and a higher risk. On the contrary, the minimum risk
portfolio has a lower return and a lower risk.
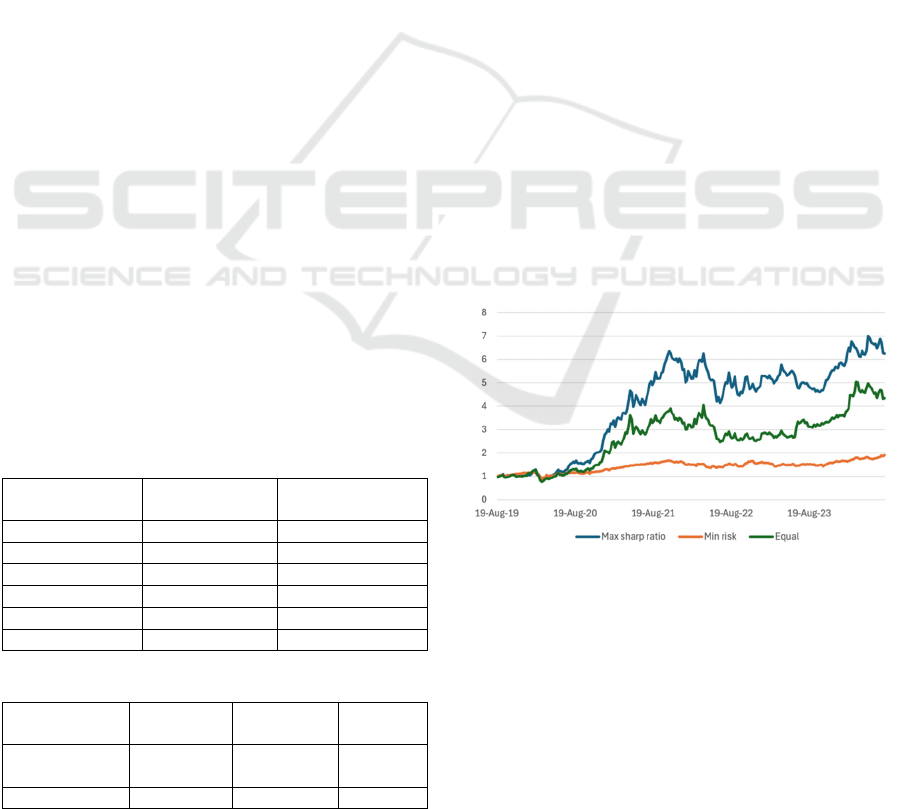
Figure. 3 is the cumulative net value chart of
portfolio, showing the performance of three different
investment portfolios from August 2019 to August
2024. The three investment portfolios are the
maximum Sharpe ratio portfolio, the minimum risk
portfolio and the equal asset weight portfolio. In
Figure. 3, the maximum Sharpe ratio portfolio has the
largest volatility in five years, but its growth rate is
also the highest, and the final cumulative net asset
value is 6.25. The cumulative net asset value of the
equal weight investment portfolio is less than that of
the maximum Sharpe ratio investment portfolio,
which is 4.35. Although the return performance of
this strategy is relatively good, this portfolio does not
have special measures to avoid market risks, which
means that if the market goes down or fluctuates
violently, the entire investment portfolio may suffer a
comprehensive loss. The minimum risk investment
portfolio has the lowest cumulative net asset value,
which is 1.90. All in all, this graph shows that the
maximum Sharpe ratio investment portfolio has the
best return, and the minimum risk investment
portfolio has a lower return, even lower than the equal
weight portfolio.
Figure 3: Cumulative net value chart of portfolio
(Photo/Picture credit: Original).
In summary, the investment portfolio constructed
by maximum Sharpe ratio selects assets with higher
returns to pursue a higher Sharpe ratio, even if it is
accompanied by greater market risks. Therefore, this
portfolio will perform better in a bull market and is
suitable for investors who pursue high returns and are
able to bear risks. The minimum risk investment
portfolio will perform better when the market
ECAI 2024 - International Conference on E-commerce and Artificial Intelligence
178

volatility is high, and the uncertainty is large.
Therefore, this portfolio is more suitable for risk-
averse investors, with lower investment risks and
stable returns.
3.3 Limitations and Prospects
The five-year data period used in this paper includes
the COVID-19 epidemic period. During this period,
there is a significant increase in the volatility of
different financial assets, and even anomalies such as
plummeting. The cryptocurrencies and futures in this
portfolio are less liquid, especially during times of
high market volatility or even liquidity depletion (Liu
& Tsyvinski, 2021). Therefore, extreme changes in
asset prices during an epidemic may affect the market
performance of the assets, while model results that
include this period may not be applicable to other
periods. The construction of portfolio in this paper is
based on the underlying mean-variance model, which
assumes that the expected returns of the assets follow
a normal distribution. However, new asset
cryptocurrencies are highly volatile in price, and the
distribution of returns does not always show a normal
distribution, but may be skewed and thick tailed, so
that a normal distribution tends to underestimate the
risks associated with extreme variations. (Klein et al.,
2018). Plus, the mean-variance model assumes that
the covariance matrix between assets is stable. In the
real market, covariances always change constantly,
especially during the epidemic period, so using a
simple covariance matrix to construct the portfolio is
not an accurate assessment of market performance. In
addition, the model building tool used in this paper is
Excel, not Python. large-scale data models are more
accurately and efficiently constructed in Python. And
the effective frontier graph which is showed does not
show in detail the changes in the Sharpe ratio of the
weights of the various assets, which is the limit of
Excel. As for the future research, it is a good attempt
to expand the data range to improve model accuracy
and explore the use of machine learning, artificial
intelligence, or tail risk management algorithms for
optimizing portfolios with new assets to address
market volatility.
4 CONCLUSIONS
To sum up, this study evaluates portfolio construction
using Markowitz's mean-variance theory, applying
two optimization objectives: maximizing the Sharpee
ratio and minimizing variance. The results indicate
that the portfolio optimized for maximizing the
Sharpee ratio can achieve the highest returns,
demonstrating its effectiveness in enhancing return
potential. In contrast, the minimum variance portfolio
provided greater stability, highlighting its advantage
in risk management. However, the study's limitations
include reliance on historical data and the omission of
new asset market impact, which may affect real-
world applicability. This research not only
demonstrates optimization methods for traditional
assets but also provides empirical support for
including new asset cryptocurrency in the portfolio. It
reveals how mean-variance theory can be applied to
diverse asset allocations to achieve higher risk-
adjusted returns, offering valuable insights for
investors navigating complex financial markets.
REFERENCES
Chen, J., Liu, Y., 2022. The Role of Cryptocurrencies in
Modern Portfolio Theory. Journal of Financial
Innovation, 9(3), 89-105.
Corbet, S., Meegan, A., Larkin, C., Lucey, B., Yarovaya, L.,
2018. Cryptocurrencies as a financial asset: A
systematic analysis. Journal of International Financial
Markets, Institutions & Money, 56, 1-22.
Fama, E. F., 1970. Efficient capital markets: A review of
theory and empirical work. Journal of Finance, 25*2,
383-417.
Fama, E. F., French, K. R., 1993. Common risk factors in
the returns on stocks and bonds. Journal of Financial
Economics, 33(1), 3-56.
Gorton, G., Rouwenhorst, K., 2021. Facts and Fantasies
about Commodity Futures. Financial Analysts Journal,
77(4), 40-54.
Guo, S., Lin, T., 2022. Big Data and Sentiment Analysis in
Portfolio Management. Financial Analysts Journal,
78(4), 102-118.
He, X., Liao, J., 2021. Machine learning for portfolio
optimization: An empirical study. Journal of Financial
Data Science, 3(1), 16-28.
Kahneman, D., Tversky, A., 1979. Prospect theory: An
analysis of decision under risk. Econometrica, 47(2),
263-292.
Klein, T., Thu, H. P., Walther, T., 2018. Bitcoin is not the
new gold – A comparison of volatility, correlation, and
portfolio performance. International Review of
Financial Analysis, 59, 105-116.
Liu, Y., Tsyvinski, A., 2021. Risks and returns of
cryptocurrency. The Review of Financial Studies, 113.
Markowitz, H. M., 1952. Portfolio selection. Journal of
Finance, 71, 77-91.
Sharpee, W. F., 1964. Capital asset prices: A theory of
market equilibrium under conditions of risk. Journal of
Finance, 19(3), 425-442.
Sullivan, R., Mackenzie, C., 2021. Sustainable Investing:
ESG Factors in Portfolio Construction. Global Finance
Journal, 50, 100-115.
Novel Portfolio Construction Based on Stocks, Traditional Stock Indices, Futures and Cryptocurrencies
179

Szymanowski, M., 2021. Commodities and Portfolio
Management: An Updated Analysis. Journal of
Commodity Markets, 15, 52-66.
VanEck. Bitcoin vs. Ethereum in 2024: Comparison &
outlook. VanEck. Retrieved from:
https://www.vaneck.com
Yahoo Finance. (n.d.). Yahoo Finance.
https://finance.yahoo.com/
Zhang, X., Liu, Z., 2023. Blockchain technology and its
implications for portfolio management. Journal of
Blockchain Research, 5(2), 45-62.
ECAI 2024 - International Conference on E-commerce and Artificial Intelligence
180
