
Prediction of DASH Price Based on Machine Learning
Xinze Wu
Department of Economics and Statistics, University of Toronto, Woodsworth College, Toronto, Canada
Keywords: Cryptocurrency Prediction, Machine Learning, LightGBM, DASH.
Abstract: Contemporarily, cryptocurrency attracts lots of investors on account of its high volatility. This study
investigates the use of machine learning models to predict the price of DASH, a leading cryptocurrency known
for its focus on privacy and speed. By applying a range of models, including Ordinary Least Squares (OLS)
regression, Random Forest, and LightGBM, this paper aims to determine the most effective approach for
forecasting DASH prices. The data set consists of daily DASH prices over a four-year period, from January
2020 to August 2024, with technical indicators such as the 50-day Simple Moving Average (SMA_50),
MACD, and RSI_14 serving as the independent variables. The findings indicate that while OLS regression
provides a basic benchmark, its predictive accuracy is limited. In contrast, the Random Forest model showed
better performance, but it was the LightGBM model that delivered the highest accuracy, effectively capturing
the non-linear relationships in the data While the results are encouraging, the study recognizes several
limitations, such as the omission of sentiment indicators and intraday data. Future investigations could benefit
from incorporating these elements to improve the accuracy of predictions. These results contribute to the
growing literature on cryptocurrency price prediction, provides practical insights for investors and traders
seeking to leverage machine learning in their decision-making processes in the meantime.
1 INTRODUCTION
The nascent phase of cryptocurrencies spanned from
late 2008 to 2013, during which the audience for
cryptocurrencies was very limited, primarily
consisting of small, insider circles of enthusiasts. In
2008, Satoshi Nakamoto published the Bitcoin white
paper, which laid the foundation for cryptocurrencies
by proposing a decentralized digital currency system
based on blockchain technology (Nakamoto, 2008).
Essentially, cryptocurrencies are digital or virtual
assets that utilize cryptographic techniques to ensure
secure issuance and transactions (Narayanan et al.,
2016). Blockchain technology serves as the backbone
of cryptocurrencies, enabling the recording of all
transaction histories. Each transaction is documented
in a block, which is linked to the preceding block,
forming a continuous chain that ensures transparency
and security in transactions. A fundamental
characteristic of cryptocurrencies is decentralization,
meaning that no central authority controls the
issuance and transactions of the currency, which
reduces the time and financial costs associated with
transactions (Catalini & Gans, 2016, Tapscott, 2016).
Cryptocurrencies have the potential to
significantly impact the traditional financial system
by offering more convenient, faster, and low-cost
payment methods (Yermack, 2015). Additionally,
when used for international remittances,
cryptocurrencies can bypass traditional banks or
remittance service providers, thereby reducing the
costs associated with cross-border transactions.
While Bitcoin was the first and remains the most
well-known cryptocurrency, the emergence of other
digital currencies such as Ethereum, DASH, and
Litecoin has broadened the scope of blockchain
applications and introduced new features and
functionalities. These include smart contracts,
privacy enhancements, and faster transaction
processing. Among these, DASH stands out for its
focus on privacy and speed, offering features such as
InstantSend and PrivateSend, which facilitate rapid
and private transactions. Since its launch in 2014,
DASH has become one of the leading
cryptocurrencies, widely recognized for its utility in
fast and low-cost payments.
Bitcoin, as the most well-known cryptocurrency,
could largely reflect the price characteristics of the
entire virtual currency market. Since its launch in
2009, Bitcoin has exhibited extreme price volatility,
164
Wu, X.
Prediction of DASH Price Based on Machine Learning.
DOI: 10.5220/0013208500004568
In Proceedings of the 1st International Conference on E-commerce and Artificial Intelligence (ECAI 2024), pages 164-169
ISBN: 978-989-758-726-9
Copyright © 2025 by Paper published under CC license (CC BY-NC-ND 4.0)

characterized by periods of speculative bubbles and
sharp corrections (Corbet et al., 2018). Initially
trading at negligible values, Bitcoin first crossed the
$1,000 mark in 2013, fueled by growing interest and
media coverage (Baur & Dimpfl, 2018). However,
the years following saw sharp declines due to
regulatory concerns and market skepticism, with
prices dropping below $300 by 2015. Bitcoin
rebounded significantly, reaching nearly $20,000 in
December 2017 during a speculative frenzy and
increased institutional interest. After a correction
phase, where prices stabilized around $3,000 to
$4,000, Bitcoin surged again, surpassing $60,000 in
2021. This increase was driven by factors such as
fears of inflation, broader institutional adoption, and
retail participation during the COVID-19 pandemic.
This demonstrates that cryptocurrency
experiences significantly higher volatility, surpassing
even some of the most volatile assets globally, such
as crude oil. According to Sebastião et al., the
standard deviation of Bitcoin’s returns is 3.91%,
which is 69% greater than crude oil’s volatility
(Sebastião et al., 2021). Furthermore, Bitcoin’s
returns are more than seven times as volatile as the
USD/EUR exchange rate. The daily fluctuations in
Bitcoin ranged from -23.78% to 22.51%, whereas
crude oil exhibited a more restrained range of -11.13%
to 14.18%. Other assets typically displayed only
single-digit variations in their daily returns (Li &
Wang, 2017). The high-risk, high-reward trading
method has garnered significant attention from
speculators. Consequently, there has been research
conducted by technical experts using machine
learning to predict Bitcoin prices. These techniques,
ranging from linear regression models to more
sophisticated neural networks, aim to provide traders
and investors with valuable insights, potentially
enhancing their decision-making processes (McNally
et al., 2018). For instance, Bayesian Neural Networks
have been used to incorporate blockchain-specific
data, further refining the predictive accuracy of these
models (Jang & Lee, 2018).
The first attempts to use machine learning for the
prediction of cryptocurrency price appeared shortly
after the launch of Bitcoin in 2009. During the early
2010s, most of these efforts were exploratory,
focusing on simple models such as linear regression
and basic time series forecasting methods like
ARIMA(Bakar & Rosbi, 2017). The main challenge
was that cryptocurrencies, unlike traditional financial
assets, lack fundamental economic indicators (such as
earnings reports or interest rates) that could be used
to inform predictions. As the field of machine
learning advanced, so did the sophistication of
models used in cryptocurrency price prediction. By
the mid-2010s, researchers began applying more
advanced techniques such as Support Vector
Machines (SVM), Decision Trees, and ensemble
methods like Random Forests. In recent years, there
has been a trend towards using hybrid models that
combine multiple machine learning techniques to
improve prediction accuracy. For example, models
may combine traditional statistical methods with deep
learning or ensemble methods. Hybrid models can
leverage the strengths of different techniques, making
them more robust and capable of handling the
complexities of cryptocurrency markets.
Despite the extensive research on Bitcoin, there
remains a significant gap in the literature regarding
the prediction of other cryptocurrencies like DASH
(Li & Wang, 2017). While some studies have
explored machine learning methods for
cryptocurrency prediction, there is limited research
focusing specifically on DASH, highlighting the need
for further investigation (Chen & Qiu, 2020). This
study aims to bridge this gap by applying a range of
machine learning models to forecast DASH prices,
offering a comparative analysis of their performance
and providing insights into their practical
implications for traders and investors.
This paper is structured as follows. The Secl 2
discusses the data and methodologies employed,
including the machine learning models used. The Sec.
3 presents the results, followed by a discussion of the
findings and their implications. The Sec. 4 concludes
the study, highlighting the limitations and suggesting
areas for future research.
2 DATA AND METHOD
Cryptocurrency data was extracted from the website:
https://ca.investing.com/crypto/dash/historical-data,
collecting 4 years daily prices of DASH
cryptocurrency in US dollar starting from 01/30/2020
to 08/27/2024. This dataset includes various fields
such as the date, open price, high price, low price,
close price, volume, and percentage of change. The
daily price of DASH is the target variable, which is
also the dependent variable, while the independent
variable are the features that will be used to predict
the dependent variable.
There are 3 major parts of the independent
variables, technical indicators, market indicators and
sentiment indicators.For technical indicators, moving
averages, Exponential Moving Averages, MACD and
Relative Strength Index (RSI) are essential
parameters for the prediction. For market indicator,
Prediction of DASH Price Based on Machine Learning
165
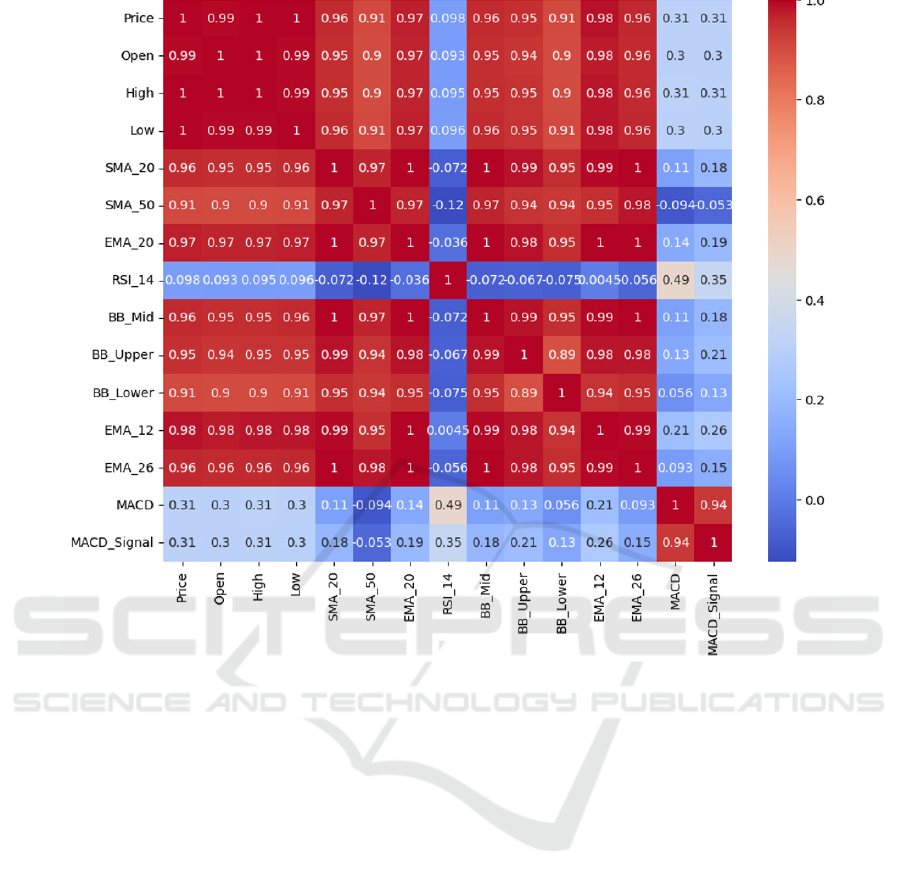
Figure 1: Correlation analysis for factors (Photo/Picture credit: Original).
this valuation will only consider the effect that the
price of Bitcoin might brought to the DASH daily
prices. As for sentiment indicators, since the models,
parameters and analysis this research will be applied
do not need such type of data, there will not be
sentiment indicators applied.
To prepare the data for analysis, several
preprocessing steps were performed. Using
“pd.read_csv(file path)” to load the file downloaded
from the website source, and convert the ‘Date’ in the
original file into date time format. The dataset was
then enriched by calculating various technical
indicators that have been mentioned above, such as
SMA, EMA, RSI, Bollinger Bands, and the MACD.
These indicators serve as independent variables in the
subsequent regression models.
Correlation analysis was performed to identify
relationships between the independent variables
(technical indicators) and the dependent variable
(DASH closing price). This analysis helps in
selecting the most relevant features for the regression
models. The correlation matrix shown in Figure. 1
revealed that certain indicators, such as the 50-day
SMA and the MACD, have a strong correlation with
the DASH closing price, making them suitable
candidates for inclusion in the predictive models.
Conversely, indicators with very low correlation
might be excluded from further analysis.
For the regression analysis, Ordinary Least
Squares (OLS) regression was selected as a
benchmark model due to its simplicity and
interpretability. This was complemented by more
sophisticated models, including Random Forest and
LightGBM, which are capable of capturing more
complex relationships in the data (Chen & Qiu, 2020).
The OLS regression model was fitted using the
selected independent variables. The performance of
the model was evaluated using R-squared (R²), Mean
Absolute Error (MAE), and Mean Squared Error
(MSE). The results of the OLS regression provide a
baseline against which the performance of more
complex models can be compared (Zhao & Zhang,
2018).
ECAI 2024 - International Conference on E-commerce and Artificial Intelligence
166
3 RESULTS AND DISCUSSION
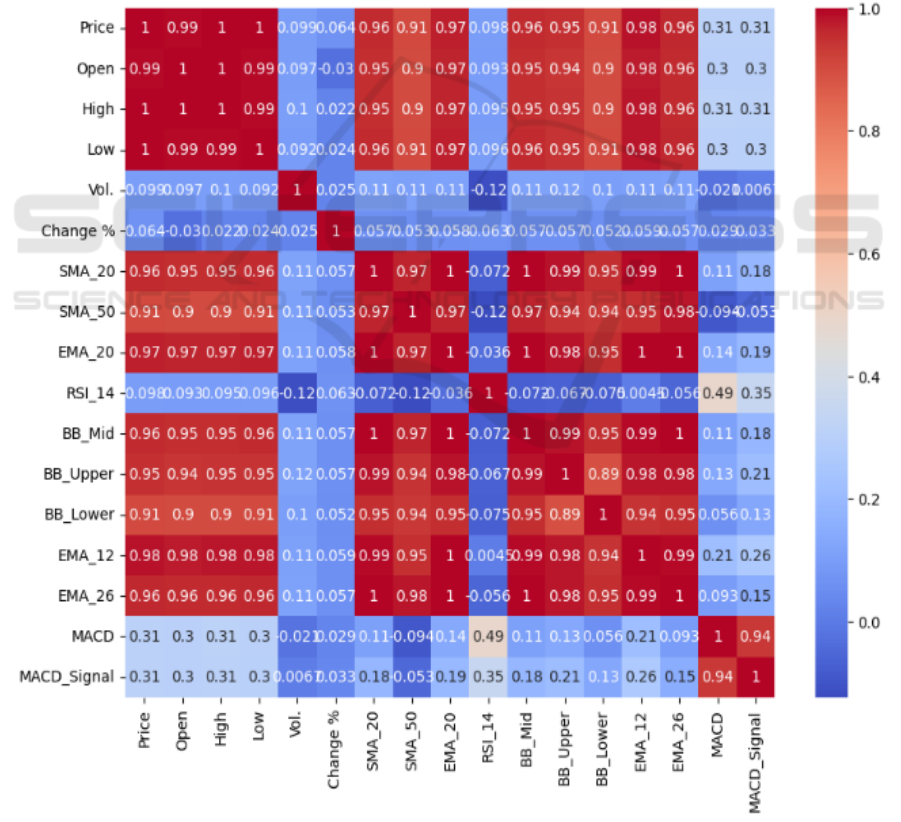
3.1 Feature Engineering
In the initial phase of the analysis, correlation analysis
was conducted to identify the relationship between
various technical indicators and the DASH closing
price. The indicators included moving averages,
momentum indicators, and volatility measures. The
correlation matrix revealed that some indicators, such
as the 50-day Simple Moving Average (SMA_50),
the Moving Average Convergence Divergence
(MACD), and the 14-day Relative Strength Index
(RSI_14), had significant correlations with the DASH
price. To further refine the feature set,
multicollinearity was assessed using the Variance
Inflation Factor (VIF). High VIF values indicate
multicollinearity, which can distort the results of
regression models. Indicators with VIF values greater
than 10 were considered for removal to improve the
stability and interpretability of the models.
On this basis, it helped refine the feature set,
ensuring that the final model inputs were both
informative and independent, thus improving the
predictive accuracy of the models. The heat map
(Figure. 2) shows the correlation between the selected
features and the DASH price. Darker shades indicate
stronger correlations, either positive or negative. The
selection of indicators for the regression models was
based on their correlation strength and VIF values.
Figure 2: Correlation analysis after selection (Photo/Picture credit: Original).
Prediction of DASH Price Based on Machine Learning
167

Figure 3: Correlation analysis after selection (Photo/Picture credit: Original).
3.2 Models Performance
The selected features were used to train various
models, including Ordinary Least Squares (OLS)
regression, Random Forest, and LightGBM. The
performance of these models was evaluated using R-
squared (R²), Mean Absolute Error (MAE), and Mean
Squared Error (MSE). The OLS model, as a
benchmark, provided a basic understanding of the
linear relationships between the features and the
DASH price. However, the simplicity of the model
limited its predictive accuracy, especially in capturing
the non-linear dynamics of the market. The Random
Forest model, with its ability to handle non-linearity
and interactions between features, showed improved
performance compared to OLS. The model was
particularly effective in reducing the prediction errors
(MAE and MSE) and provided a higher R² value,
indicating a better fit to the data. The LightGBM
model, known for its efficiency and performance in
gradient boosting tasks, provided the best results
among the tested models. The R² value was
significantly higher, suggesting that LightGBM was
able to explain a larger portion of the variance in
DASH prices. The error metrics (MAE and MSE)
were also the lowest, indicating that the model was
highly accurate in its predictions.
To visualize the model's performance, the
predicted prices were plotted against the actual prices
shown in Figure. 3. This comparison helps in
understanding the accuracy of the model's predictions.
To have a better visualization of the difference, the
data used change from daily to monthly averages.
Table 1 summarizes the performance metrics for each
model, highlighting the R², MSE, and MAE values.
Table 1: Model performances.
Model R
2
MSE MAE
OLS Regression 0.45 12.34 2.56
Random Forest 0.78 6.78 1.85
LightGBM 0.82 5.23 1.62
3.3 Explanation and Implications
The results from the LightGBM model suggest that
the DASH price is strongly influenced by a
combination of trend-following indicators (e.g.,
SMA_50) and momentum indicators (e.g., MACD
and RSI_14) which capture different aspects of
market behavior. The 50-day Simple Moving
Average was identified as a crucial predictor,
indicating the importance of long-term trends in
DASH price movements. The MACD's ability to
capture momentum shifts allowed the model to
anticipate changes in price direction, enhancing
prediction accuracy. The 14-day RSI contributed to
predicting price reversals by identifying overbought
or oversold conditions. For traders and investors, the
findings suggest that integrating these indicators into
trading strategies could improve decision-making.
Specifically, using machine learning models like
LightGBM can enhance the prediction of price
movements, providing a competitive edge in the
volatile cryptocurrency market.
3.4 Limitations and Prospects
While the OLS model provided a baseline, its
simplicity limited its effectiveness in capturing the
complex, non-linear relationships present in the data.
ECAI 2024 - International Conference on E-commerce and Artificial Intelligence
168

And the actual price of DASH, and all other
cryptocurrencies can be relatively strongly affected
by sentiment indicators, which cannot be considered
using the models in this research. In the meantime,
the analysis was conducted using daily data from a
specific period. The inclusion of additional data, such
as intraday prices could potentially improve model
accuracy. Future research could explore the
integration of sentiment analysis using data from
social media platforms like Twitter and Reddit.
Additionally, experimenting with other advanced
machine learning models, such as LSTM networks,
could further enhance the accuracy of price
predictions. The success of machine learning models
in this analysis opens the door for developing and
testing algorithmic trading strategies. By automating
the trading process based on predictive analytics,
investors could capitalize on short-term price
movements with greater precision.
4 CONCLUSIONS
To sum up, this study explored the application of
various machine learning models, including Ordinary
Least Squares (OLS) regression, Random Forest, and
LightGBM, to predict the price of DASH
cryptocurrency. The analysis revealed that while OLS
provided a basic understanding of the linear
relationships between technical indicators and DASH
prices, more sophisticated models like Random
Forest and LightGBM significantly outperformed it
in terms of accuracy and predictive power.
LightGBM, in particular, demonstrated superior
performance, effectively capturing the complex, non-
linear dynamics of the DASH market. The model’s
ability to integrate trend-following indicators such as
the 50-day Simple Moving Average (SMA_50) and
momentum indicators like MACD and RSI_14
allowed it to provide accurate price predictions,
offering valuable insights for traders and investors.
However, the study also highlighted certain
limitations. The exclusion of sentiment indicators and
intraday data, as well as the focus on a specific time
period, may have constrained the model's predictive
accuracy. Future research should consider
incorporating these factors to enhance the robustness
of predictions. Additionally, the development of
hybrid models that com-bine machine learning with
sentiment analysis could offer further improvements.
Overall, this research contributes to the literature on
cryptocurrency price prediction by filling a gap in the
analysis of DASH and demonstrating the efficacy of
machine learning models in this domain. The findings
underscore the potential of these models to inform
trading strategies, ultimately helping investors
navigate the volatile cryptocurrency market with
greater precision.
REFERENCES
Bakar, N. A., Rosbi, S., 2017. Autoregressive Integrated
Moving Average (ARIMA) Model for Forecasting
Cryptocurrency Exchange Rate in High Volatility
Environment. Research in International Business and
Finance, 42, 1407-1415.
Investing.com, n.d. DASH Historical Data. Available at:
https://ca.investing.com/crypto/dash/historical-data
[Accessed 27 September 2024].
Baur, D. G., Dimpfl, T., 2018. Asymmetric Volatility in
Cryptocurrencies. Economics Letters, 173, 148-151.
Catalini, C., Gans, J. S., 2016. Some Simple Economics of
the Blockchain. NBER Working Paper No. 22952.
Chen, L., Qiu, M., 2020. Research on Cryptocurrency Price
Prediction Method Based on Ma-chine Learning.
Information and Computer Security, 28(2), 257-270.
Corbet, S., Lucey, B., Yarovaya, L., 2018. Datestamping
the Bitcoin and Ethereum Bubbles. Finance Research
Letters, 26, 81-88.
Jang, H., Lee, J., 2018. An Empirical Study on Modeling
and Prediction of Bitcoin Prices with Bayesian Neural
Networks Based on Blockchain Information. IEEE
Access, 6, 5427-5437.
Li, X., Wang, C. A., 2017. The Technology and Economic
Determinants of Cryptocurrency Exchange Rates: The
Case of Bitcoin. Decision Support Systems, 95, 49-60.
McNally, S., Roche, J., Caton, S., 2018. Predicting the
Price of Bitcoin Using Machine Learning. 2018 26th
Euromicro International Conference on Parallel,
Distributed and Network-based Processing (PDP), 11.
Narayanan, A., Bonneau, J., Felten, E., Miller, A.,
Goldfeder, S., 2016. Bitcoin and Crypto-currency
Technologies: A Comprehensive Introduction.
Princeton University Press.
Nakamoto, S., 2008. Bitcoin: A Peer-to-Peer Electronic
Cash System. SSRN Electronic Journal, 3440802, 10-
2139.
Sebastião, H., Cunha, C., Godinho, P., 2021. Understanding
Bitcoin Returns and Volatility: Evidence from Value-
at-Risk Forecasting. Finance Research Letters, 19, 12.
Tapscott, D., Tapscott, A., 2016. Blockchain Revolution:
How the Technology Behind Bitcoin Is Changing
Money, Business, and the World. Penguin, 11.
Yermack, D., 2015. Is Bitcoin a Real Currency? An
Economic Appraisal. NBER Working Paper, 19747.
Zhao, Y., Zhang, H., 2018. Comparison of Cryptocurrency
Forecasting Using Deep Learning Models. IEEE
Transactions on Neural Networks and Learning
Systems, 18.
Prediction of DASH Price Based on Machine Learning
169
