
LSTM-Based Stock Price Prediction: Comparison between NSE
Bank and S&P 500 Index
Shensong Lyu
a
Nottingham University Business School, University of Nottingham Ningbo, Ningbo, China
Keywords: LSTM, Prediction, NSE, S&P 500.
Abstract: This paper explores the application of Long Short-Term Memory (LSTM) networks for predicting the closing
prices of the NSE Bank Index and the S&P 500 Index. The study was begun by preprocessing historical price
data, which involves normalization and sequence creation to prepare it for model training. An LSTM model
is then constructed and optimized using Keras Tuner to find the best hyperparameters. The analysis
demonstrates that the LSTM model significantly outperforms traditional forecasting methods in terms of
prediction accuracy. By evaluating the model's performance through mean squared error and visual
comparisons of predicted versus actual prices, that LSTM captures complex patterns in time series data more
effectively was founded. This study highlights the LSTM model's superior ability to forecast stock prices,
making it a powerful tool for financial predictions. The results suggest that LSTM networks should be
increasingly utilized in future market forecasting research to achieve more accurate and reliable predictions,
providing valuable insights for investors and market analysts.
1 INTRODUCTION
Predicting stock market prices remains a challenging
endeavor due to the complex and dynamic nature of
financial markets. The inherent volatility and the
multitude of factors influencing stock prices, such as
market sentiment, economic indicators, and investor
behavior, make accurate forecasting a significant
challenge.
Recent advancements in Machine Learning (ML)
have provided new tools for addressing this
challenge, with Long Short-Term Memory (LSTM)
networks emerging as a particularly promising
approach. Nelson, Pereira, and De Oliveira (2017)
demonstrated the effectiveness of LSTM networks in
predicting stock prices by utilizing historical data and
technical indicators, achieving an average prediction
accuracy of 55.9%. Their study highlighted LSTM’s
ability to capture temporal dependencies and patterns
in financial data, showcasing its potential for
enhancing forecasting accuracy. Building on this,
Bhandari et al. (2022) focused on the S&P 500 index,
comparing single-layer and multilayer LSTM
models. Their research found that single-layer LSTM
models outperformed multilayer models in terms of
a
https://orcid.org/ 0009-0007-6263-4155
prediction accuracy, underscoring the efficiency of
LSTM in capturing market volatility. Ghosh et al.
(2019) extended LSTM applications to the Indian
stock market, demonstrating its ability to surpass
traditional forecasting methods and handle complex
time series data effectively. Similarly, Liu, Liao, and
Ding (2018) applied LSTM to stock transactions,
emphasizing its suitability for modeling non-linear
and dynamic market behaviors. LSTM was explored
for predicting stock returns in the Chinese market,
showing significant improvements in prediction
accuracy over random methods (Chen et al, 2015).
However, there are still some deficiencies in relevant
experimental studies.
This body of work collectively supports the
effectiveness of LSTM networks in financial
forecasting, highlighting their ability to analyze
historical price data and technical indicators to
provide more accurate predictions. Although LSTM
model still has certain limitations in predicting stock
price trends, such as prediction delay (Wei, 2019),
These studies illustrate the transformative potential of
LSTM networks in stock market prediction, offering
a robust framework for improving forecasting
accuracy amidst the inherent complexities of
148
Lyu, S.
LSTM-Based Stock Price Prediction: Comparison between NSE Bank and S&P 500 Index.
DOI: 10.5220/0013208200004568
In Proceedings of the 1st International Conference on E-commerce and Artificial Intelligence (ECAI 2024), pages 148-153
ISBN: 978-989-758-726-9
Copyright © 2025 by Paper published under CC license (CC BY-NC-ND 4.0)

financial markets. Therefore, this study aims to
forecast the closing prices of two pivotal financial
indices: the NSE Bank Index from the National Stock
Exchange of India, representing the Indian banking
sector, and the S&P 500 Index, a benchmark
reflecting the performance of 500 major U.S.
companies. Analyzing these indices offers insights
into the banking sector's trends within India and
broader market dynamics in the United States. The
proposed approach not only aims to improve the
precision of stock price predictions but also
contributes to the broader understanding of advanced
forecasting techniques in financial markets.
2 DATA
The data used in this study came from Yahoo
Finance(https://finance.yahoo.com/?guccounter=1),
a widely used website for financial data. Yahoo
Finance provides historical data on multiple stock
markets around the world, including important
metrics such as daily closing price, opening price,
high price, low price, and trading volume. The data
was selected covering the period from August 29,
2023, to August 29, 2024. The data in this time range
can effectively reflect the long-term trend and
volatility of the market, which is helpful for the
training and prediction of the model. Among the
many available data, the study focuses on “Closing
Price” as the main indicator of analysis. Closing price
refers to the transaction price of the last transaction of
the securities in the trading day, which is the final
reflection of the market's trading activities in the day,
so it is a common indicator for trend analysis and
prediction. Before model training on the data,
descriptive statistical analysis was performed on the
selected data. Below are the basic statistical
characteristics of selected NSEBANK and S&P 500
index data, including mean, standard deviation,
minimum, maximum, and quartile ranges. Table 1
shows that the average value of NSEBANK Index is
significantly higher than that of S&P 500 index. The
average value of the former is 47,365.64, while the
average value of the latter is 4959.79. This difference
indicates that the overall level of the NSEBANK
index was much higher than the S&P 500 index
during the study period. In addition, the comparison
of the maximum values reflects a similar trend: the
maximum value of the NSEBANK index is 53,103.70,
which is significantly higher than the maximum value
of the S&P 500 index of 5667.20. These values reflect
differences in size and volatility between the two,
which may be related to the market structure,
economic conditions and investor behavior to which
they belong (Moghar & Hamiche, 2020; Yadav, Jha
& Sharan, 2020).
3 METHODOLOGIES
This paper primarily employs LSTM to forecast the
closing price of the NSE Bank and S&P 500 indices.
The chapter introduces the LSTM model architecture
and the hyperparameter optimization process used to
enhance prediction accuracy. Data from the indices is
preprocessed and split into training and testing sets.
The LSTM model is trained with optimized
hyperparameters, and predictions are made for the
test period. The performance of the model is
evaluated by calculating the Mean Squared Error
(MSE) between the predicted and actual values. This
article uses this RNN model, the LSTM, with
appropriate hyperparameter adjustments to predict
future stock trends with high accuracy (Sunny et al,
2020).
Table 1: The basic statistical characteristics of selected data.
INDEX NSEBANK S&P 500
Count 365 365
Mean 47365.64 4959.79
Std 2703.57 427.81
Min 42280.15 4117.37
25% quantile 44882.25 4554.89
Median (50%) 47327.85 5035.69
75%quantile 48986.60 5303.27
Max 53103.70 5667.20
LSTM-Based Stock Price Prediction: Comparison between NSE Bank and S&P 500 Index
149

Figure 1:
The LSTM model work principle.
Long short-term memory (LSTM) networks are a
complex variant of recurrent neural networks
designed to deal with sequence prediction problems
by learning order dependencies. Their strength lies in
their ability to capture both short - and long-term
dependencies, which makes them particularly
effective in predicting stock prices where past prices
have a significant impact on future forecasts
(Bhandari et al.,2022). The process follows a
structured workflow.
Forget Gate: This Decides how much of your
previous memory to forget.
Input Gate: This Decides how much new memory
to add to the cell state.
Cell State Update: This Combines the oblivion
gate and the input gate to update the cell status.
Output Gate: This Determines how much
information is output from the current cell state.
Detailed process can ben seen in Figure 1.
LSTM processes and remembers long-term
dependencies in time series data through a series of
carefully designed gating mechanisms (Moghar &
Hamiche, 2020). At each time step, the LSTM
decides what previous information to keep in the cell
state through a "forget gate," allowing the model to
discard information that is no longer important
(Staudemeyer et al., 2019).The input gate determines
what new information is important from the current
input and combines it with the existing cell state,
updating the cell state to incorporate the new
important information (Rahman et al., 2016). This
updating process involves discarding some old
memories and adding new memories provided by the
current time step, where the degree of discarding of
old memories is controlled by the forgetting gate, and
the addition of new memories is determined by the
input gate and a candidate memory value. Finally, the
"output gate" determines part of the output based on
the updated cell state and the current input. Together,
these gating mechanisms enable LSTM to effectively
retain long-term information while processing
sequence data, while forgetting information that is no
longer important or relevant to the prediction task,
greatly improving its ability to model time series data,
especially in scenarios where long-term dependencies
need to be understood. This structure enables LSTM
to effectively capture long-term dependencies in time
series, solving the problem of gradient disappearance
or gradient explosion encountered by standard RNNS
during training.
4 RESULTS
4.1 Data Processing
The study used closing price data from August 23,
2023, to August 23, 2024. The data was divided into
a training set and a test set, where the training set had
a time range from August 23, 2023, to June 30, 2024,
and the test set had a time range from July 1, 2024, to
August 23, 2024.
4.2 Model Training
In order to optimize the performance of the model,
hyperparameter adjustment technique is used in this
study. A bidirectional LSTM model was used for
training and select the optimal hyperparameters
through Random Search in the following range (See
Table 2).
Table 2: Range of the optimal hyperparameters.
parameter name range
LSTM units 50-100
Dropout rate 0.3-0.5
Finally, the optimal parameter combination
selected by the model is shown in Table 3.
Table 3: The value of the optimal hyperparameters.
parameter name range
LSTM units 60
Dropout rate 0.4
ECAI 2024 - International Conference on E-commerce and Artificial Intelligence
150
4.3 NSE Bank
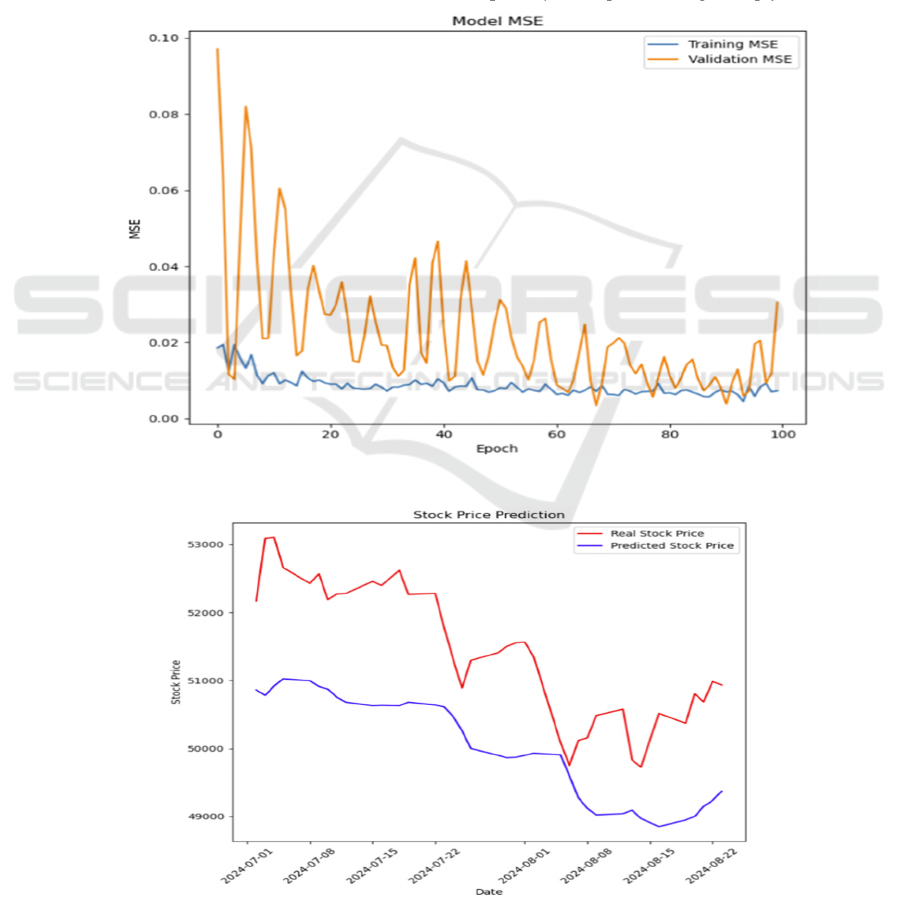
Figure 2 shows the change of mean square error
(MSE) of the NSEBANK index during training.
During the training, the mean square error (MSE)
decreases continuously, indicating that the
performance of the model is gradually optimized on
the training set. However, fluctuations in validation
errors imply the effect of market volatility on model
performance. Such volatility may stem from short-
term market instability or the risk of overfitting.
Overfitting results in a model that performs well on
the training set but underperforms when faced with
actual test data.
Figure 3 shows the actual price of the NSEBANK
index compared to the forecast price. The model can
grasp the general trend well, but the prediction error
is larger in the high fluctuation region. This error
indicates insufficient sensitivity of the model to
extreme market volatility, possibly due to the limited
capacity of the LSTM model to handle large price
changes, or due to the scarcity of such volatility data
in the training data. At the same time, although the
model performs well against general market trends,
its performance is still limited by market fluctuations,
especially when prices change sharply.
Figure 2: Model MSE(NSEBANK).
Figure 3: Prediction of NSEBANK.
LSTM-Based Stock Price Prediction: Comparison between NSE Bank and S&P 500 Index
151
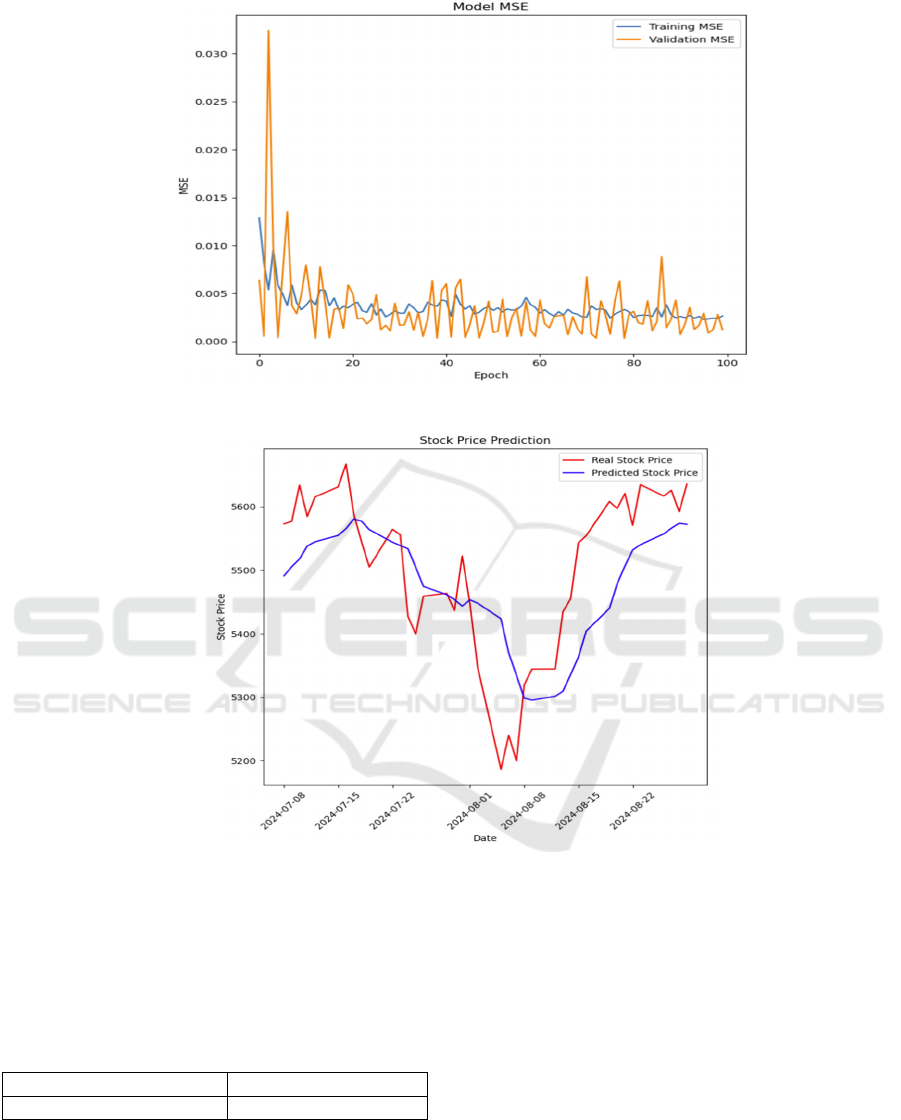
Figure 4: Model MSE (S&P 500).
Figure 5: Prediction of SP500.
Table 4 shows the mean square error (MSE) of the
NSEBANK index on the test set. The MSE value
reflects the prediction error of the model on the test
set, and the lower MSE value indicates that the model
has better prediction ability.
Table 4: The value of MSE.
evaluation index value
MSE 0.0054
4.4 S&P 500
Figure 4 shows the change in mean square error
(MSE) of the S&P 500 index during training. Similar
to the NSEBANK index, both the training error and
validation error of the S&P 500 are gradually
declining, indicating that the model is gradually
converging, but the fluctuations in validation error
also reflect changes in the market.
Figure 5 shows the actual stock price of the S&P
500 index versus the forecast price on the test set. The
figure shows that the model predicted price is in line
with the overall trend of the actual price, but in some
areas of high volatility, the forecast error is obvious.
This shows that model has limitations when it comes
to dealing with wild market movements, especially
when prices rise or fall sharply. Such errors may be
due to the LSTM model's insufficient capture of
short-term volatility data, or these fluctuations occur
less frequently in the training set, resulting in poor
ECAI 2024 - International Conference on E-commerce and Artificial Intelligence
152

performance of the model in such situations. Table 5
shows the mean square error (MSE) of the S&P 500
index on the test set. The smaller MSE value indicates
that the prediction error of the model is low,
indicating that the model has strong prediction ability.
Table 5: The value of MSE.
evaluation index value
MSE 0.0048
4.5 NSEBANK vs. S&P 500 Index
While the MSE curves for both have similar swings,
the S&P 500 appears to have been more volatile. This
likely reflects an essential difference between the two
indices: the NSEBANK is more regional and
influenced by specific industries, while the S&P 500
is more global and diversified and influenced by more
macroeconomic factors.
5 CONCLUSIONS
This study investigates the use of Long Short-Term
Memory (LSTM) networks for predicting the closing
prices of the NSE Bank Index and the S&P 500 Index.
The research involved preprocessing historical price
data through normalization and sequence creation to
prepare it for model training. An LSTM model was
developed and optimized using Keras Tuner to
identify the most effective hyperparameters. The
findings reveal that the LSTM model significantly
outperforms traditional forecasting methods in
accuracy. By evaluating the model through mean
squared error and visual comparisons of predicted
versus actual prices, it was demonstrated that LSTM
effectively captures complex patterns in time series
data. This highlights the LSTM model's superior
forecasting ability, suggesting that it is a valuable tool
for financial predictions. The results indicate that
LSTM networks hold great potential for enhancing
future market forecasting, providing valuable insights
for investors and market analysts.
While this study demonstrates the advantages of
LSTM models in stock price prediction, several areas
warrant further investigation. Future research could
explore combining LSTM with other advanced
algorithms, such as GRU or Transformer models, to
assess their performance under varying market
conditions. Expanding the scope to include
additional financial indicators or longer time periods
could help evaluate the model’s robustness and
generalizability. Incorporating additional features,
such as market sentiment or macroeconomic
variables, might further improve prediction accuracy.
Lastly, examining the application of LSTM models in
real-time trading strategies could offer insights into
their practical utility and effectiveness. These future
directions will contribute to a deeper understanding
of LSTM applications in financial forecasting and
advance the field of financial technology.
REFERENCES
Bhandari, H.N., Rimal, B., Pokhrel, N.R., Rimal, R., Dahal,
K.R. and Khatri, R.K., 2022. Predicting stock market
index using LSTM. Machine Learning with
Applications, 9, p.100320.
Chen, K., Zhou, Y. and Dai, F., 2015, October. A LSTM-
based method for stock returns prediction: A case study
of China stock market. In 2015 IEEE international
conference on big data (big data) (pp. 2823-2824). IEEE.
Ghosh, A., Bose, S., Maji, G., Debnath, N. and Sen, S., 2019,
September. Stock price prediction using LSTM on Indian
share market. In Proceedings of 32nd international
conference on (Vol. 63, pp. 101-110).
Liu, S., Liao, G. and Ding, Y., 2018, May. Stock transaction
prediction modeling and analysis based on LSTM. In
2018 13th IEEE Conference on Industrial Electronics
and Applications (ICIEA) (pp. 2787-2790). IEEE.
Moghar, A. and Hamiche, M., 2020. Stock market
prediction using LSTM recurrent neural network.
Procedia computer science, 170, pp.1168-1173.
Nelson, D.M., Pereira, A.C. and De Oliveira, R.A., 2017,
May. Stock market's price movement prediction with
LSTM neural networks. In 2017 International joint conf.
on neural networks (IJCNN) (pp. 1419-1426). IEEE.
Rahman, L., Mohammed, N., & Al Azad, A. K. (2016,
September). A new LSTM model by introducing
biological cell state. In 2016 3rd International Conf. on
Electrical Engineering and Information Communication
Technology (ICEEICT) (pp. 1-6). IEEE.
Staudemeyer, R. C., & Morris, E. R. (2019). Understanding
LSTM--a tutorial into long short-term memory recurrent
neural networks. arXiv preprint arXiv:1909.09586.
Sunny, M.A.I., Maswood, M.M.S. and Alharbi, A.G., 2020,
October. Deep learning-based stock price prediction
using LSTM and bi-directional LSTM model. In 2020
2nd novel intelligent and leading emerging sciences
conference (NILES) (pp. 87-92). IEEE.
Wei, D., 2019, October. Prediction of stock price based on
LSTM neural network. In 2019 International
Conference on Artificial Intelligence and Advanced
Manufacturing (AIAM) (pp. 544-547). IEEE.
Yadav, A., Jha, C.K. and Sharan, A., 2020. Optimizing
LSTM for time series prediction in Indian stock market.
Procedia Computer Science, 167, pp.2091-2100.
LSTM-Based Stock Price Prediction: Comparison between NSE Bank and S&P 500 Index
153
