
Novel Portfolio Construction Based on Traditional Stock Index
Conghao Jin
College of Management and Economy, The Chinese University of Hong Kong (Shenzhen), Shenzhen, China
Keywords: Stock Index, Portfolio, Construction.
Abstract: Novel portfolio construction with great performances under controllable risks is always pursued by the finance
industry. This study explores a novel approach to portfolio investment based on an active management
strategy, centered on uncovering stocks that have yet to receive sufficient market attention despite their robust
fundamentals, or individual stocks whose prices have deviated from their intrinsic values due to market
contingencies, resulting in abnormal fluctuations. During the research process, a stock pool comprising the
constituents of the CSI 1000 Index was first constructed. These stocks, though relatively small in market
capitalization, exhibit good liquidity and receive limited market attention, providing an ideal environment for
the application of portfolio strategies. The research findings reveal that all three machine learning algorithms,
i.e., Gradient Boosting Decision Tree (GBDT), Support Vector Machine (SVM), and Random Forest (RF),
achieve stable excess returns on the CSI 1000 Index. Among them, GBDT performs best in terms of overall
returns, followed by SVM and RF in third place. From a risk control perspective, RF exhibits the lowest
maximum peak-to-trough decline, indicating strong risk resilience, while GBDT and SVM follow closely.
These results creatively integrate machine learning algorithms from the field of artificial intelligence into
portfolio construction strategies, with a focus on the CSI 1000 Index, aiming to enhance investment efficiency
through technological means.
1 INTRODUCTION
The concept of portfolio investment was first
introduced by John Templeton, emphasizing the
strategy of "seeking low-priced companies with long-
term growth prospects on a global scale as investment
targets." This idea is grounded in behavioural finance
theory, which posits that investor behaviour is not
solely based on rational decision-making but is
influenced by market inefficiencies arising from
information asymmetry and psychological factors.
These factors often lead to significant deviations in
stock prices from their intrinsic values in the short
term. Portfolio decision-making, therefore, exploits
market overreactions by capitalizing on other
investors' irrational decisions. It involves buying
undervalued, profitable, and under-researched stocks
while simultaneously selling or even short-selling
overvalued, deteriorating, or overly hyped stocks.
The ultimate goal is to profit from the eventual
reversion of stock prices to their intrinsic values.
Essentially, portfolio decision-making embodies a
value investment philosophy rooted in behavioural
finance.
According to Liutffu, portfolio strategies tend to
yield more stable excess returns in markets that are
not fully efficient (Liutffu, 2022). The constituent
stocks of the CSI 1000 Index are particularly suitable
for portfolio strategies. Comprising mainly of small-
and medium-sized enterprises (SMEs) in China, the
CSI 1000 Index represents the top 1000 most liquid
stocks outside of the CSI 800 Index. As such, it
complements indices like the CSI 300 and CSI 500
well. With relatively smaller average market
capitalizations and lower market attention, the
constituent stocks of the CSI 1000 Index better reflect
the performance of SMEs in China's capital markets
and offer better investment opportunities due to
limited investor scrutiny.
Brito contends that machine learning, the core
component of artificial intelligence, can be
categorized into supervised learning, unsupervised
learning, and reinforcement learning based on
learning methods, and into regression, classification,
and clustering based on learning directions (Brito,
2023). Dejan et al. argue that constructing a portfolio
essentially involves deciding which stocks to hold,
which to exclude or even short-sell, and determining
134
Jin, C.
Novel Portfolio Construction Based on Traditional Stock Index.
DOI: 10.5220/0013208000004568
In Proceedings of the 1st International Conference on E-commerce and Artificial Intelligence (ECAI 2024), pages 134-142
ISBN: 978-989-758-726-9
Copyright © 2025 by Paper published under CC license (CC BY-NC-ND 4.0)

the investment weights for the held stocks within a
given time frame (Dejan et al., 2022). Treating the
holding of a stock as 1, non-holding as 0, and short-
selling as -1, this process constitutes a typical
machine learning classification problem. Palma et al.
point out that while reinforcement learning achieves
the strongest learning effects in terms of accuracy and
effectiveness, its complex multi-layer iterations make
it difficult to understand the classification logic
(Palma et al., 2023). In contrast, supervised learning
can effectively return the importance of each feature
during classification, facilitating subsequent model
optimization, including feature selection, feature
processing, and parameter tuning.
Claudiu & Marcel identify random forest, support
vector machine (SVM), and gradient boosting
decision tree (GBDT) as currently mature supervised
learning algorithms (Claudiu & Marcel, 2023).
Random forest involves randomly selecting features
and samples to construct multiple decision trees for
classification. SVM seeks the optimal hyperplane that
best separates samples into different classes. GBDT,
a type of boosting algorithm, builds upon basic
decision trees, with each new iteration improving the
model's accuracy based on the losses from the
previous iteration. Burkart & Roberto highlight that
the most basic and common weak classifier in
classifiers is the decision tree algorithm, which
classifies samples based on different features
(Burkart & Roberto, 2023). Each tree node splits into
leaf nodes at the next level, continuing until a
predefined maximum depth is reached or the
minimum number of samples is reached in the bottom
nodes. Dejan et al. emphasize that the order and
attributes of feature partitioning are crucial to the
effectiveness of decision trees (Dejan et al., 2023). As
the depth of classification increases, the samples
within branch nodes become increasingly similar.
Regarding evaluation metrics, Lean et al. note that
traditional mutual fund evaluation primarily focuses
on returns and risks (Lean et al., 2023). Common
return metrics include holding period returns,
annualized returns, excess returns, and Jensen's Alpha.
Risk metrics include portfolio variance, portfolio
standard deviation, beta coefficients, and maximum
drawdowns. Comprehensive metrics that balance
returns and risks include the Sharpe Ratio,
Information Ratio, and Treynor Ratio. Francois et al.
point out that for machine learning algorithms, the
most straightforward evaluation metric is accuracy
(ACC) (Francois et al., 2023). However, ACC can be
misleading due to imbalanced sample attributes. For
instance, if 80% of samples are true and the algorithm
predicts all samples as true, ACC would still be 80%,
despite the algorithm not contributing to actual
classification. He et al. mention that numerous other
evaluation metrics have emerged, with ROC curves
and AUC values being prevalent (He et al., 2023).
ROC curves plot the true positive rate (TRR) against
the false positive rate (FRR), and the AUC value
represents the area under the ROC curve. By
definition, AUC values range from 0 to 1, with higher
values indicating better classification performance.
An AUC value close to 0.5 indicates random
classification, while a value below 0.5 suggests a
logical error in the algorithm, necessitating reverse
training. AUC effectively mitigates the illusion of
high accuracy caused by sample imbalance in ACC.
The selection strategies for individual stocks
outlined in domestic portfolio fund prospectuses can
be summarized as follows: Refk argues that due to the
current low market attention, stocks with significantly
underestimated or underrepresented intrinsic values
may experience a regression to their intrinsic values
in the future as market conditions and other factors
improve, making them high-quality corporate stocks
(Refk, 2023). Kirti et al. suggest that stocks that have
garnered significant attention due to hot topics or
other factors, resulting in market overreaction and
prices far exceeding their intrinsic values, can be
promptly sold or even shorted, waiting for the heat to
subside and prices to return to their intrinsic values
(Kirti et al., 2023). Walid et al. believe that stocks
where the company's fundamentals have undergone
or are expected to undergo positive changes, but the
share prices have not fully reflected these changes
due to investors' lack of attention stemming from
information asymmetry, have the potential to reflect
the improved fundamentals in the future (Walid et al.,
2023).
Based on the above criteria, specific operations
prioritize stocks that meet any of the following
standards: For instance, Kinda & Sulaiman consider
stocks with price-to-book (PB), price-to-earnings
(PE), or price-to-sales (PS) ratios below the median
of the overall market or industry (excluding stocks
with negative values for these indicators) (Kinda &
Sulaiman, 2023); Raza et al. focus on stocks with PB,
PE, or PS ratios lower than their own historical
medians (Raza et al., 2023); and stocks with price
fluctuations over the past three months or year that
are below the market median.
According to these standards, in actual investment
processes, domestic portfolio funds tend to isolate
common specific financial and valuation indicators,
using them to screen and invest in stocks. In terms of
both quantity and scale, domestic portfolio funds lag
far behind their foreign counterparts. China's first
Novel Portfolio Construction Based on Traditional Stock Index
135

public portfolio fund, Huatianfu Portfolio Hybrid
Fund, was established on March 9, 2012. As of
November 1, 2023, the top ten stocks in its portfolio
holdings belong to the constituent stocks of indices
such as CSI 500, SSE 50, and CSI 300. There is a total
of 14 publicly offered portfolio funds established and
in existence in China, with a total size of 13.313
billion yuan and an average annualized return of
23.71%. Compared to the approximately 8.94%
annualized return of the CSI 300 Index from 2012 to
2023, these funds have achieved an excess return of
14.77%.
Investment strategies employed by foreign
portfolio funds include as following. Ramzi et al.
advocate investing in companies where the market
has misunderstood their business models, assets, or
growth potential (Ramzi et al., 2023); Ahlem et al.
propose identifying undervalued stocks due to a lack
of investor attention and avoiding stocks significantly
overvalued due to excessive investor enthusiasm
(Ahlem et al., 2024); targeting companies with
earnings forecasts for the current year higher than the
previous fiscal year, and with earnings forecasts for
the next fiscal year exceeding those of the current
year. Alexey & Sally emphasize quantitative analysis
and computer-programmed trading instructions to
achieve stable arbitrage profits (Alexey & Sally,
2024). Quantitative investment differs from
traditional qualitative investment in its reliance on
computer-generated programmatic trading models
that comprehensively evaluate multiple stock
characteristics through model algorithms, enabling
more precise implementation of portfolio strategies
and minimizing investors' personal irrational factors.
In comparison, domestic portfolio strategy funds still
have room for optimization in this regard.
The primary objective of this study is to conduct
a comprehensive review of the current research status
and future trends of portfolio theory, both
domestically and internationally, and delve deeply
into the theoretical foundations and model
optimization strategies of three advanced algorithms:
Random Forest, Support Vector Machine (SVM), and
Gradient Boosting Decision Tree (GBDT). Through
empirical research, this study will focus on three core
aspects: data preprocessing, model prediction and
evaluation, as well as the construction and
backtesting analysis of contrarian strategies, aiming
to provide investors with scientific and effective
support for investment decision-making.
2 DATA AND METHOD
This study focuses on the constituent stocks of the
CSI 1000 Index since 2009. Through a rigorous
screening mechanism, ST stocks, newly listed stocks
with less than one quarter of trading history, and
stocks that have been suspended for a long time or are
currently suspended are excluded. Each selected
stock is treated as an independent sample, and its key
time-series features are extracted, including but not
limited to opening price, closing price, lowest price,
highest price, and core financial indicators such as
price-to-earnings ratio. To facilitate subsequent
analysis, these time-series data are further organized
into quarterly cross-sectional data to ensure data
uniformity and comparability.
Given the breadth of the research objects and the
vast amount of data, this study employs Python
programming language combined with web scraping
technology. By calling APIs from authoritative data
interfaces such as akshare, tushare, and WindPy,
efficient acquisition of financial data, market
valuation data, and historical trading data for the
stocks in the stock pool is achieved. This automated
data collection process significantly improves the
efficiency of data gathering while ensuring data
accuracy and completeness. After obtaining raw data,
further preprocessing is conducted. Specifically,
quarterly returns are calculated based on the quarterly
closing prices of stocks, and stock performance is
categorized into two classes: stocks with quarterly
returns ranking in the top 50% are labeled as positive
samples (label 1), while those in the bottom 50% are
labeled as negative samples (label 0). This step lays a
solid foundation for the subsequent training and
evaluation of machine learning models.
Data collection often encounters issues such as
missing values, extreme values, and inconsistent
dimensions, which can harm model performance if
used directly. Preprocessing is crucial, including
restructuring data into a time-cross-sectional matrix,
cleaning abnormal stocks and missing data, removing
extreme values to reduce interference, neutralizing to
eliminate external factor biases, and standardizing to
eliminate magnitude differences. Through reasonable
preprocessing, this study ensures effective model
training, accurate predictions, and avoid distortion
and overfitting:
x ∗ =
(1)
Z-Score normalization is also a commonly seen
processing method, with its processing:
x ∗ =
(2)
ECAI 2024 - International Conference on E-commerce and Artificial Intelligence
136

Table 1: ACC and AUC of each algorithm in different segmentation modes.
Se
g
mentation Modes Random Forest Su
pp
ort Vector Machine
ACC AUC ACC AUC ACC AUC
2-8 S
p
lit 79.94% 52.02% 80.12% 2-8 S
p
lit 79.94% 52.02%
3-7 Split 69.47% 53.31% 69.26% 3-7 Split 69.47% 53.31%
4-6 Split 58.77% 54.63% 59.44% 4-6 Split 58.77% 54.63%
5-5 Split 53.34% 55.76% 53.44% 5-5 Split 53.34% 55.76%
Through the aforementioned series of data
preprocessing and optimization steps, this study has
successfully constructed a high-quality dataset,
laying a solid foundation for the subsequent training
and evaluation of machine learning models.
In stock selection, this paper adopts a machine
learning classification model, focusing on predicting
stock performance. This research innovatively
classifies based on yield ranking, setting the top 50%
as the positive class. By adjusting the split ratio to
optimize model performance, one found that when
the split ratio is 50%, AUC reaches its highest,
balancing the samples while avoiding conservatism.
During training, this study combines trial and error,
random search, and Bayesian optimization for
parameter tuning, strictly distinguishing the training
set from the test set to prevent overfitting.
Additionally, cross-validation ensures model stability
and generalization ability. This classification
algorithm-based stock selection model demonstrates
excellent performance in predicting yields, providing
a powerful tool for portfolio construction, as shown
in Table 1.
When constructing a stock selection model, the
selection of variables is crucial. This study focuses on
robustness, profitability, and growth potential,
covering indicators such as current ratio, return on
equity, total asset turnover, and net profit growth rate,
to comprehensively assess the financial status of
enterprises. For trading data, this study selects trading
volume, turnover rate, and combine technical
indicators like MACD to capture market behavior. In
terms of valuation, though using indicators like P/E
ratio, it is considered the lag in financial data and
incorporate them with a one-quarter lag to enhance
prediction accuracy. This multi-dimensional variable
selection strategy aims to improve the effectiveness
and reliability of the model's stock selection.
3 RESULTS AND DISCUSSION
3.1 Algorithm Training
When training a model using the Random Forest
classifier from Python's sklearn library, this study
meticulously adjusted and optimized the algorithm
parameters based on the large sample size
characteristic of the CSI 1000 Index. Specifically, this
study increased the number of decision trees from the
default 100 to 150, enhancing the model's training
effectiveness and generalization capability.
Meanwhile, to avoid excessive training time and
potential overfitting issues, one limited the maximum
depth of each tree to five layers and maintained model
balance by setting the minimum number of samples
required to split an internal node to its default value
(usually 2 or adjusted based on the maximum depth).
In terms of feature selection, as the number of
features involved in this study is approximately 20,
one retained the default setting for the number of
features to consider, which is either the square root or
the logarithm of the total number of features, as the
two approaches yield similar results. Additionally, to
ensure reproducibility of each training outcome, one
sets the random state factor to 5, although this
parameter does not substantially impact model
performance. By training the optimized Random
Forest model, one further analyzed the importance of
each feature within the model. The ranking of feature
importance across different time periods reveals the
key factors influencing the model's prediction results.
Notably, trading and valuation data features such as
trading volume, price-to-book ratio (PB), turnover
rate, price-to-earnings ratio (PE), and price-to-sales
ratio (PS) consistently exhibited high importance
across multiple time periods, with their combined
contribution exceeding 40%. This indicates that the
Random Forest algorithm effectively captures the
market's trading activity and valuation levels, thereby
assessing the investment value of stocks. Table 2
displays the specific importance values of features for
selected time periods.
In contrast, traditional financial indicators such as
earnings per share, net assets per share, and return on
assets, while still holding a degree of importance,
collectively contribute less than 60% to the overall
prediction. This result validates the Random Forest
algorithm's superiority in identifying stocks that are
either excessively focused on or underestimated by
the market, as well as its effectiveness in executing
portfolio strategies. By comprehensively considering
Novel Portfolio Construction Based on Traditional Stock Index
137

Table 2: Specific Importance Values of Features for Selected Time Periods in Random Forest.
2016-12 2018-12 2020-12 2022-12 2024-6
Adjusted Earnings Per Share (Yuan) 0.040409 0.03807 0.039682 0.032253 0.032195
Adjusted Net Assets Per Share (Yuan) 0.028524 0.029845 0.021236 0.022813 0.025135
Operating Cash Flow Per Share (Yuan) 0.03053 0.026637 0.022989 0.020056 0.02211
Return on Assets (%) 0.032779 0.032691 0.038703 0.03805 0.038314
Main Business Profit Margin (%) 0.057383 0.036956 0.027225 0.029622 0.031791
Return on E
q
uit
y
(
%
)
0.041312 0.030427 0.026838 0.029263 0.027651
Net Profit Growth Rate (%) 0.1277 0.061498 0.034903 0.028794 0.027195
Net Asset Growth Rate (%) 0.032138 0.023046 0.025872 0.026543 0.024672
Total Asset Growth Rate (%) 0.027141 0.030785 0.030071 0.031649 0.03157
Total Asset Turnover (Times) 0.0324 0.034727 0.03547 0.027473 0.030279
Current Ratio 0.030029 0.041414 0.056233 0.066846 0.065435
Interest Coverage Ratio 0.033875 0.025979 0.023097 0.022682 0.024786
Debt-to-Asset Ratio (%) 0.033533 0.032452 0.037715 0.040791 0.042907
Cash Flow to Debt Ratio (%) 0.037847 0.026822 0.024521 0.022321 0.020431
PE 0.048924 0.058161 0.072839 0.083164 0.088153
PB 0.040195 0.094424 0.104956 0.118937 0.118118
PS 0.032958 0.055635 0.064462 0.069265 0.070275
Dividend Yiel
d
0.027446 0.048336 0.059126 0.059975 0.064788
Tradin
g
Volume 0.086102 0.092554 0.085107 0.075158 0.070835
Tradin
g
Value 0.136462 0.104016 0.096343 0.081527 0.076045
Turnover Rate 0.042314 0.075524 0.07261 0.072817 0.067314
trading data, valuation data, and financial
indicators, the Random Forest model provides a more
comprehensive assessment of stocks' investment
potential, offering robust decision support for
investors.
The Support Vector Machine (SVM) algorithm
for binary feature classification can be understood as
finding a hyperplane that separates the samples with
the maximum margin. For multi-class feature
classification, the SVM algorithm seeks to identify
the hyperplane that separates the samples with the
largest distance from the sample points. Faced with
an extremely large training dataset exceeding tens of
thousands of instances, the linear SVM algorithm can
be considered for training. Although the data volume
utilized in this paper exceeds a thousand, it has not
yet reached the ten-thousand level, hence the
adoption of a basic SVM classifier. The main
parameter settings are as follows: First, the penalty
factor, which if set excessively high, may turn SVM
into a hard-margin classifier. Therefore, this paper
sets the penalty factor to 0.9. Second, the kernel
function. Since the data is not linearly separable,
dimensionality elevation is necessary. This paper
selects the Gaussian kernel function to elevate the
data dimensionality, enabling samples with higher
similarity to cluster together, thereby achieving linear
separability and enhancing SVM's classification
performance. However, this naturally leads to longer
training times. Lastly, the random factor is also set to
5. The GradientBoostingClassifier function in
Python's Sklearn package primarily has the following
parameters: the maximum number of iterations,
which represents the number of weak learners or
regression trees. The default is 100 trees. However,
given the moderate sample size of the CSI 1000 Index
selected in this paper, spanning approximately 60
periods, too few trees can lead to underfitting, while
too many iterations can cause overfitting. During
experimentation, this paper chose a maximum
iteration count of 10. The learning rate, also known as
the step size, represents the contribution of each tree
and should be adjusted alongside the maximum
iteration count. This paper sets the learning rate to 0.1.
The maximum depth of a single regression tree is
defaulted to 3 when the number of sample features is
low. Given that this paper has 21 features, this
parameter is adjusted to 10. The randomness factor,
while ensuring consistent training results, has no
intrinsic significance, and this model also selects 5 for
this parameter. The specific importance values of
various features across selected time periods are
presented in Table 3.
ECAI 2024 - International Conference on E-commerce and Artificial Intelligence
138

Table 3: Specific values of importance of each feature in GBDT section period.
2016-12 2018-12 2020-12 2022-12 2024-6
Adjusted Earnings Per Share (Yuan) 0.029112 0.032131 0.034377 0.034377 0.033686
Adjusted Net Assets Per Share (Yuan) 0.027749 0.023751 0.028559 0.028559 0.021787
Operating Cash Flow Per Share (Yuan) 0.031872 0.016649 0.018734 0.018734 0.018558
Return on Assets (%) 0.024493 0.0426 0.03601 0.03601 0.034263
Main Business Profit Margin (%) 0.054421 0.059778 0.04588 0.04588 0.043597
Return on E
q
uit
y
(
%
)
0.017696 0.016909 0.017707 0.017707 0.019184
Net Profit Growth Rate (%) 0.137147 0.070035 0.035476 0.035476 0.024836
Net Asset Growth Rate (%) 0.023125 0.017713 0.012226 0.012226 0.019129
Total Asset Growth Rate (%) 0.039294 0.026508 0.027472 0.027472 0.027166
Total Asset Turnover (Times) 0.041761 0.048096 0.028432 0.028432 0.030054
Current Ratio 0.036104 0.0408 0.059874 0.059874 0.067116
Interest Coverage Ratio 0.05008 0.037812 0.031159 0.031159 0.032545
Debt-to-Asset Ratio
(
%
)
0.021019 0.034153 0.050193 0.050193 0.03734
Cash Flow to Debt Ratio
(
%
)
0.029693 0.028686 0.03753 0.03753 0.030964
PE 0.052891 0.052915 0.056039 0.056039 0.05007
PB 0.051748 0.105908 0.124183 0.124183 0.152234
PS 0.035582 0.04375 0.044306 0.044306 0.050993
Dividend Yiel
d
0.02217 0.024115 0.037838 0.037838 0.043561
Tradin
g
Volume 0.05523 0.067847 0.081254 0.081254 0.068369
Trading Value 0.131684 0.120245 0.113508 0.113508 0.111838
Turnover Rate 0.087129 0.089609 0.079244 0.079244 0.082709
It is evident from the feature importance rankings
that for the Gradient Boosting Decision Tree (GBDT)
algorithm, the most significant factors affecting the
results are Price-to-Book Value (PB), Trading Value,
Turnover Ratio, Trading Volume, Net Profit Growth
Rate, Gross Profit Margin, Current Ratio, Price-to-
Earnings Ratio (PE), and Price-to-Sales Ratio (PS).
Together, these features account for over 50% of the
model's importance, while the remaining financial
indicators contribute less than 50%. This indicates
that the algorithm effectively evaluates whether a
stock is worth buying and holding based on whether
it receives excessive or insufficient attention, whether
its valuation is too high or too low, and whether the
company demonstrates robust profitability and
growth capabilities. Consequently, the GBDT
algorithm can also effectively execute investment
portfolio strategies.
3.2 Model Establishment
In the training of machine learning algorithm, training
set data too little often lead to the algorithm cannot
obtain effective learning effect, in the process of
training data from 0, the training effect is proportional
to the training samples, namely the more, the more
accurate, the algorithm, but the relationship after the
sample enough will lose due to the positive
relationship, so this paper to the selection of sample
training period will have a very important influence
on the algorithm classification accuracy. Since China
changed the accounting standards for listed
companies in 2009, in order to ensure the consistent
characteristics of the data, the data collection began
from 2009, and since the CSI 1000 index was
officially released on October 17,2016, the end date
of the training set was selected as December 31,2016,
and the test set from December 31,2016 to June
30,2024.
When considering stock positions held at the end
of the first quarter of 2015, the algorithm only has
sample features and labels from the fourth quarter of
2007 to the fourth quarter of 2014. When determining
the positions for the first quarter of 2015, only the
features of all stocks in the stock pool at the end of
the first quarter of 2015 are input, without labels. The
trained algorithm then predicts the labels for this
cross-sectional period based on the features. Stocks
with a label of 1 are held, while those with a label of
0 are not. This approach determines investment
strategies for this period. Similarly, when considering
positions at the end of the second quarter of 2015, the
data from the first quarter is no longer isolated;
instead, the actual stock features and labels (not
predicted ones) from the end of the first quarter are
incorporated into the training set to enhance
Novel Portfolio Construction Based on Traditional Stock Index
139
prediction accuracy. The same process is repeated for
subsequent quarters, rolling the training set forward
until the end of the entire dataset. In this way, for each
cross-sectional period, an algorithm that incorporates
all recent historical information predicts and analyzes
data outside the training set samples. These
predictions are then compared with actual values to
calculate evaluation metrics such as ACC and AUC
for assessing the algorithm's learning effectiveness.
China's primary stock trading system is T+1,
theoretically allowing daily position adjustments.
However, as institutional investors, frequent
adjustments often lead to excessive transaction costs
and a loss of investor confidence. Therefore, the
position adjustment frequency is reduced to monthly
or quarterly. Adhering to the principle of portfolio
strategy, adjustments should occur after financial
reports are released, thus setting the position
adjustment frequency to quarterly.
After the algorithm has been trained on a large
sample and its parameters optimized, considering the
relatively low attention given to the CSI 1000 Index,
this study selects its constituent stocks as the stock
selection pool. An equal-weighted portfolio is
adopted for backtesting, with quarterly position
adjustments. At the end of each quarter, stocks with a
predicted label of 1 are held, while those with a label
of 0 are not. This logic guides quarterly stock trading,
with each stock assigned an equal weight.
Let the initial capital at the beginning of the period
be C0, the final capital at the end of the period be C1,
the investment weight of the ith stock be wi, and the
return rate for the period be Ri. The portfolio's return
rate R1 for this period is calculated:
R
=
∑
ω
R
(3)
The end-of-period fund C1 for this period is:
C
=C
1 R
= C
1
∑
ω
R
=
C
∑
ω
1 R
(4)
Similarly, the end-of-period fund Cn is represented:
CN = Co
∏
1 R
(5)
Since the weights chosen in this paper are equal
weights, assuming the machine learning algorithm
decides to invest in n out of M stocks in the current
period, the weights are:
ω
=
(6)
Based on the above logic, one can generate the
amount of funds Ct possessed by the portfolio at time
t and evaluate the portfolio based on this time series
of funds.
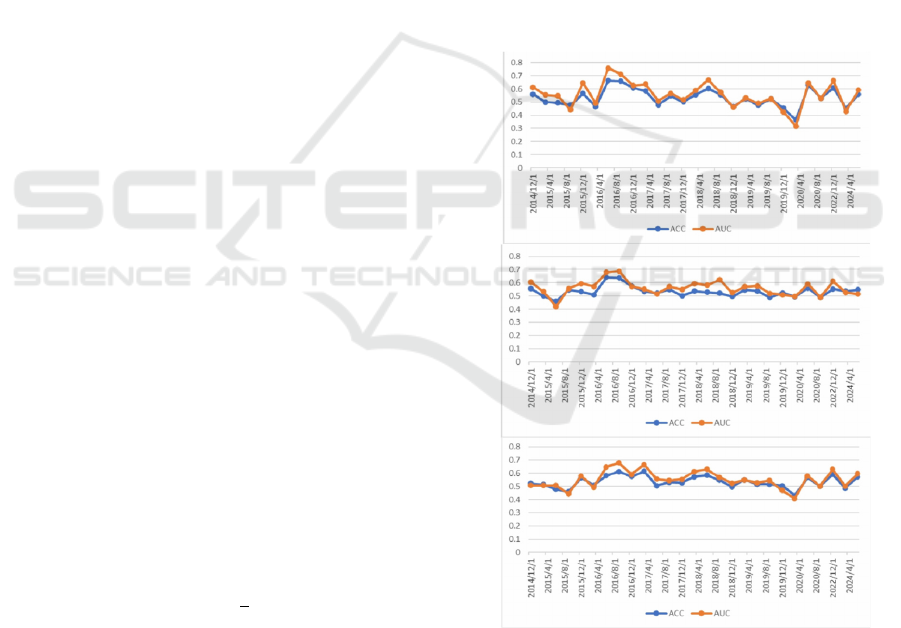
3.3 Comparison of Key Indicators
The ACC and AUC of the three algorithms for each
cross-sectional period are shown in Fig. 1. From the
trends of ACC and AUC in the figures, one can draw
the following conclusions. In terms of algorithm
stability, Support Vector Machine (SVM) has the best
stability with standard deviations of 0.0396 and
0.0556 for ACC and AUC, respectively. Conversely,
Random Forest has the worst stability with standard
deviations of 0.0688 and 0.0960 for ACC and AUC,
respectively. Gradient Boosting Decision Tree falls in
the middle with standard deviations of 0.0455 and
0.0652 for ACC and AUC, respectively. In
comparison, SVM has the best stability, able to
consistently achieve an accuracy rate of over 55%.
Gradient Boosting Decision Tree comes second in
stability, while Random Forest has relatively poor
stability, with more significant fluctuations in
accuracy as the data volume gradually expands and
styles change. Although there are fluctuations in the
accuracy of the three algorithms, they mainly
concentrate between 0.5 and 0.7, which is acceptable
for stock market prediction.
Figure 1: The accurcacy of random forest. SVM and GBDT
(from upper to the lower).
4 CONCLUSIONS
To sum up, the application of a single algorithm is
often limited by its inherent advantages and
ECAI 2024 - International Conference on E-commerce and Artificial Intelligence
140

disadvantages, while the group decision-making
strategy can effectively integrate the strengths of
multiple algorithms and reduce the limitations of a
single algorithm. The newly developed
comprehensive algorithm outperforms the benchmark
index in terms of fund curve performance and is
slightly superior to the other three individual
algorithms. Its key performance indicators include: a
standard deviation of 1.2695, a Sharpe ratio of
0.3991, an information ratio of 0.6622, a maximum
drawdown of 35.45%, and an algorithm accuracy rate
of 54.19%. Although the new algorithm demonstrates
advantages in terms of return, its higher standard
deviation and maximum drawdown indicate that the
algorithm tends to adopt a conservative strategy in
stock selection, resulting in a smaller number of
selected stocks and a higher degree of investment
concentration, thereby failing to fully diversify risks.
Therefore, a comprehensive assessment of the new
algorithm's overall capabilities requires further
validation based on a larger stock pool and data
spanning a longer time period. Overall, each
algorithm can outperform the benchmark index to a
certain extent, achieving excess returns. However,
while pursuing high returns, it is often difficult to
effectively control risk indicators such as variance
and maximum drawdown. In practical operations, the
introduction of risk management measures such as
stop-loss orders can help control the overall risk of
the portfolio. There is still room for optimization in
this study: firstly, transaction costs, both explicit and
implicit, are not considered; secondly, machine
learning algorithms are constantly evolving, and more
cutting-edge algorithms can be explored in the future;
thirdly, the handling of missing data during the data
cleaning process needs improvement. For individual
investors, this paper recommends adopting a
contrarian investment strategy, avoiding chasing
gains and cutting losses, holding undervalued stocks
for the long term, and focusing on portfolio
diversification to reduce risks and transaction costs.
For institutional investors, this paper encourages
them to pay more attention to key indicators such as
stock valuation, company development, and
profitability in quantitative investment to achieve
higher returns and guide the market towards a more
efficient direction. Additionally, future research
should further validate the performance of this
strategy in real markets and continuously optimize
algorithms and data processing methods.
REFERENCES
Ahlem, L., Ahmed, J., Tarek, F., 2024. Spillovers between
cryptocurrencies, gold and stock markets: implication
for hedging strategies and portfolio diversification
under the COVID-19 pandemic. Journal of Economics,
Finance and Administrative Science, 57, 21-41.
Alexey, R., Sally, S., 2024. Dynamic portfolio decisions
with climate risk and model uncertainty. Journal of
Sustainable Finance, Investment, 2, 344-365.
Brito, I., 2023. A portfolio stock selection model based on
expected utility, entropy and variance. Expert Systems
With Applications, 1, 12-14.
Burkart, F. W., Roberto, B. J., 2023. Random walk through
a stock network and predictive analysis for portfolio
optimization. Expert Systems With Applications, 14,
45-47.
Claudiu, V., Marcel, A., 2023. Portfolio Volatility
Estimation Relative to Stock Market Cross-Sectional
Intrinsic Entropy. Journal of Risk and Financial
Management, 2, 114-114.
Dejan, Z, Slavica, M., Jasmina, D, Gajić-Glamočlija,
Marina, 2022. Oil hedging with a multivariate
semiparametric value-at-risk portfolio. Borsa Istanbul
Review, 6, 1118-1131.
Dejan, Z., Biljana, P., Nataša, P., et al., 2023. How to reduce
the extreme risk of losses in corn and soybean markets?
Construction of a portfolio with European stock
indices. Agricultural Economics, Zemědělská
ekonomika, 3, 109-118.
Francois, P., Richard, A., Lorraine, M., Tinotenda, M. H.,
2023. The Impact of Investor Sentiment on Housing
Prices and the Property Stock Index Volatility in South
Africa. Real Estate Management and Valuation, 2, 1-
17.
He, P., Hu, K., Nie, S., et al., 2023. Stock Selection and
Portfolio Performance Based on ESG Scores.
Academic Journal of Business, Management, 11.
Kinda, D., Sulaiman, M., 2023. Portfolio Optimization at
Damascus Securities Exchange: A Fractal Analysis
Approach. Cogent Economics, Finance, 2, 82-84.
Kirti, S., Kumar, A., Prachi, P., Purohit, H., 2023. Did ESG
portfolio augment investors’ wealth during Covid19?
Evidence from Indian stock market. Sustainability
Accounting, Management and Policy Journal ,5,, 922-
944.
Lean, H., Pizzutilo, F., Kimberly, G., 2023. Portfolio
performance implications of investment in renewable
energy equities: Green versus gray. Corporate Social
Responsibility and Environmental Management, 6,
2990-3005.
Liu, X., Shehzad, K., Kocak, E., Zaman, U., 2022. Dynamic
correlations and portfolio implications across stock
and commodity markets before and during the COVID-
19 era: A key role of gold. Resources Policy 102985-
102985.
Palma, M. M., Eva, L. M., Pavel, A., et al, 2023. Stock
selection using a multiple criteria hierarchical process
in the Dow Jones index. International Journal of
Innovation and Sustainable Development, 1-2, 67-84.
Novel Portfolio Construction Based on Traditional Stock Index
141

Ramzi, N., Adel, Z. S., Walid, M., 2023. Frequency
interdependence and portfolio management between
gold, oil and sustainability stock markets. International
Economics, 7, 72-79.
Raza, R. M., Mabruk, B. S., Muneer, S., et al., 2023.
Dynamic connectedness, spillover, and optimal
hedging strategy among FinTech, Sukuk, and Islamic
equity markets. Global Finance Journal, 2, 55-56.
Selmi, R., Wohar, M., Deisting, F., Kasmaoui, K. 2023.
Dynamic inflation hedging performance and downside
risk: A comparison between Islamic and conventional
stock indices. Quarterly Review of Economics and
Finance, 56-67.
Walid, M., Mobeen, R., Debasish, M, et al., 2023.
Frequency spillovers and portfolio risk implications
between Sukuk, Islamic stock and emerging stock
markets. Quarterly Review of Economics and Finance
139-157.
ECAI 2024 - International Conference on E-commerce and Artificial Intelligence
142
