
Predictions for Consumer Behaviour of E-Commerce Sales Data
2023-2024 Based on the LightGBM Model
Jiayi Du
Department of Financial Information Management, Capital University of Economics and Business, Beijing, China
Keywords: Consumer behaviour, LightGBM, E-commerce.
Abstract: With the outbreak of the pandemic, online consumption has gradually become the main consumption mode,
promoting the rapid development of e-commerce. In this context, consumer behaviour and feedback are
particularly important for companies to develop strategies. This study implements a LightGBM model to
explore the potential links between customer information, behaviour, and feedback scores in the "2023-24 E-
commerce Sales Data". Based on the analysis, age, geographical location, and frequency of purchases are the
key factors that affect online customer ratings. The study found that there is a significant correlation between
these factors and customer ratings, suggesting that customers of different ages, regions, and frequent
purchasers may rate goods and services differently on e-commerce platforms. This provides valuable insights
for e-commerce businesses, especially small and medium-sized businesses, that help them better understand
customer behaviour and optimize service quality and customer experience. The significance of this study is
that by using a relatively simple but effective model to predict the likelihood of customer ratings, it provides
a practical idea for small and medium-sized enterprises to develop a customer scoring system in the fierce
market competition, to help these enterprises better attract and retain customers and improve overall
operational efficiency. These results provide novel methods and tools for personalized service and customer
relationship management in the field of e-commerce and has important practical application value.
1 INTRODUCTION
The forecasting of consumer behavior is a crucial area
of consumer behavior research that has gone through
numerous stages of development. The history of
consumer behavior forecasting can be traced back to
the early 20th century when economists began using
mathematical models to comprehend and predict
consumer purchasing decisions. Early studies were
focused on rational consumer theories, such as John
Hicks and Walras' marginal utility theory, which
sought to mathematically describe how consumers
make optimal choices with limited resources. For
instance, Hicks explained how consumer demand for
goods changes with variations in prices, laying the
theoretical foundation for subsequent predictive
models (Hicks, 1939).
As econometrics advanced, consumer behavior
forecasting transitioned to more sophisticated
economic models, including regression and time
series analyses. In the 1950s and 1960s, economists
began using these methods to analyze market data and
predict consumer spending and demand. For example,
Swedish economist John R. Litchfield utilized
regression analysis in his studies on consumption
functions to explore the relationship between
consumption expenditure, income, prices, and other
factors (Litchfield, 1955).
By the 1970s, consumer behavior forecasting
entered a new phase with improved computing
capabilities and advancements in econometric
techniques. Theoretical models advanced from
simple demand functions to more complex choice
models, such as discrete choice models proposed by
Russell Davidson and James G. MacKinnon, which
explain consumer decision-making among various
options (Davidson, 1993).
With the rise of big data and machine learning
technologies, consumer behavior forecasting has
undergone a revolutionary transformation in recent
years. Companies and research institutions analyze
consumer online activities and social media behaviors
using big data to improve marketing strategies and
personalized recommendation systems (Smith, 2020).
Tech giants like Google and Amazon employ
algorithms to analyze consumer search and purchase
Du, J.
Predictions for Consumer Behaviour of E-Commerce Sales Data 2023-2024 Based on the LightGBM Model.
DOI: 10.5220/0013207400004568
In Proceedings of the 1st International Conference on E-commerce and Artificial Intelligence (ECAI 2024), pages 109-116
ISBN: 978-989-758-726-9
Copyright © 2025 by Paper published under CC license (CC BY-NC-ND 4.0)
109

histories to offer personalized advertisements and
product recommendations (Jones, 2019).
In recent years, research on consumer forecasting
has evolved significantly, leveraging advancements
in data analytics, machine learning, and behavioral
economics. These studies focus on predicting
consumer behavior patterns to help businesses make
informed decisions regarding product development,
marketing strategies, and inventory management.
One prominent area of research is the application of
machine learning algorithms to predict consumer
preferences and purchasing behavior. These
algorithms analyze large datasets containing
historical purchase data, social media activity, and
other relevant metrics to identify patterns and trends
(Chen, 2012). By utilizing techniques such as
regression analysis, decision trees, and neural
networks, researchers have been able to improve the
accuracy of their predictions significantly. Another
crucial development is the incorporation of sentiment
analysis in consumer forecasting. Sentiment analysis
involves examining text data from online reviews,
social media posts, and other user-generated content
to gauge public opinion about products and services
(Feldman, 2013). This method has proven effective in
predicting sales and market trends, as it captures real-
time consumer attitudes and sentiments.
Behavioral economics has also contributed to the
advancement of consumer forecasting. Researchers in
this field study how psychological factors and
cognitive biases influence consumer decisions
(Kahneman, 1979). By integrating behavioral
insights with traditional economic models, they have
developed more comprehensive and accurate
forecasting models that account for irrational
consumer behavior. Big data analytics has emerged
as a critical tool in consumer forecasting, allowing
researchers to handle vast amounts of data from
various sources. Integrating big data with advanced
analytics techniques has enabled more precise
segmentation of consumer groups and better
prediction of their future behavior (McAfee, 2012).
This approach helps businesses tailor their strategies
to meet the specific needs and preferences of different
consumer segments. The advent of real-time data
processing and analytics has revolutionized consumer
forecasting. Real-time analytics allows businesses to
monitor consumer behavior as it happens, enabling
them to respond quickly to changing market
conditions and consumer preferences (Gandomi,
2015). This capability is particularly valuable in
industries where consumer trends, such as fashion
and technology, can shift rapidly.
Taken together, these important developments in
recent years have significantly improved the accuracy
and reliability of consumer behavior predictions,
providing businesses with valuable insights to guide
their strategic decisions.
In the wake of the pandemic, there has been a
noticeable shift in consumer habits as the global
economy rebounds. By delving into these changes
using analytical models, sellers can gain valuable
insights to better understand and adapt to evolving
consumer preferences. The pandemic has
significantly impacted the global economy and led to
substantial changes in people's lifestyles and
consumption behaviors. Traditional offline
consumption patterns have given way to online
platforms, resulting in a surge in digital payments and
e-commerce. Concurrently, consumer demand and
preferences for products have also evolved. As
vaccination efforts progress and the pandemic
gradually subsides, there are signs of economic
activities returning to normal. However, it's important
to recognize that the post-pandemic era has reshaped
consumer habits and given rise to new trends and
characteristics. In this context, leveraging model
analysis technology becomes particularly important.
By developing and refining models that capture
consumer behavior, sellers can gain a comprehensive
understanding of these evolving behaviors. In the
next section, the author will introduce the dataset,
including its source, basic description, and the
variables involved. Subsequently, there will be an
overview of the predictive model, covering its
parameters and the evaluation metrics used. The
chapter will then examine the results and offer
insights for future research.
2 DATA AND METHOD
The dataset selected by the authors is from the Kaggle
website and is a newer dataset uploaded by DATA
DIGGERS called E-commerce Sales Data 2023-24.
The E-commerce Sales Data dataset offers a
comprehensive compilation of information about user
profiles, product specifications, and user-product
interactions. This dataset serves as a valuable
resource for gaining insights into customer behavior,
preferences, and purchasing patterns on an e-
commerce platform. The dataset consists of three
sheets. The user sheet contains user profiles,
including details such as user ID, name, age, location,
and other relevant information. It helps in
understanding the demographics and characteristics
of the platform's users. The product sheet offers
ECAI 2024 - International Conference on E-commerce and Artificial Intelligence
110

insights into the various products available on the e-
commerce platform, including product IDs, names,
categories, prices, descriptions, and other product-
specific attributes. Lastly, the interactions sheet
captures the interactions between users and products,
recording details of user actions, such as product
views, purchases, reviews, and ratings. This data is
essential for building recommendation systems and
understanding user preferences.
The author carefully considers two perspectives
when choosing the dependent variable: purchase
behavior and purchase probability. From the purchase
behavior perspective, key indicators, e.g., the number
of purchases and total orders effectively reflect
consumers' actual consumption behavior and
economic contribution. From the purchase
probability perspective, the core variable used to
predict consumers' purchase propensity and
likelihood under certain conditions is whether a
purchase occurs. Selecting these dependent variables
enables the creation of more accurate predictive
models, revealing underlying consumption patterns
and behavioral trends. In selecting independent
variables, the authors thoroughly examined four
essential dimensions: temporal characteristics,
customer characteristics, product information, and
interaction information. The temporal dimension
primarily concentrates on the order date and the time
of day to capture the potential influence of time-
related factors on consumer behavior. Customer
characteristics are analyzed based on geographic
location and customer type to understand similarities
and differences in consumption habits. Product
information encompasses product categories and unit
prices to uncover the impact of various product
attributes on consumer choices. Interaction
information includes customer behavior data such as
browsing, preferences, and orders, aiming to gain a
deeper understanding of consumer behavior patterns
at each stage of the shopping journey. This approach
to selecting independent variables aids in building
more comprehensive and precise models, thereby
revealing intricate consumer behavior patterns.
This study has opted for the LightGBM (Light
Gradient Boosting Machine) model, an advanced
machine learning algorithm created by Microsoft.
LightGBM utilizes several technical optimizations,
including histogram-based decision tree learning, a
leaf-wise strategy, sparse feature support, and parallel
learning. These optimizations make LightGBM more
efficient than traditional gradient boosting methods
like XGBoost, especially when handling large-scale,
high-dimensional data.
One can delve into the model parameters selected
by the author for the regression task. The author opted
for a regression objective to predict continuous
numerical target variables. For boosting, the author
employed the GBDT (gradient boosting decision tree)
method to optimize the loss function and
progressively build the model. The author fine-tuned
the learning rate to 0.001 to bolster stability and
mitigate the risk of overfitting, although this may
necessitate more iterations to achieve the desired
outcomes. The author limited the maximum number
of leaf nodes per tree to 15 to effectively reduce the
risk of overfitting. The maximum depth governs the
maximum allowed growth depth of the tree. The
author capped the growth depth at 10 to minimize the
risk of overfitting. Additionally, the author
incorporated L1 and L2 regularization coefficients
into the model to sparsely constrain the weights,
facilitating feature selection, reducing model
complexity, and enhancing generalization capability.
The author set the maximum number of iterations of
the model to 5000 to refine the model's accuracy. By
setting the early stopping round at 10, if the
evaluation metrics of the validation set do not
improve within 10 rounds, the training process will be
terminated early. This measure prevents overfitting
and reduces training time. This study mainly used the
following methods to evaluate the performance of the
LightGBM model; The first is the root mean square
error, which is calculated as
(1)
where
is the true value,
is the predicted value,
and n is the number of samples. The smaller the
RMSE, the smaller the gap between the predicted
value and the true value of the model, and the better
the performance of the model.
3 RESULTS AND DISCUSSION
3.1 Feature Engineering
In the process of feature engineering, the initial step
involves examining the dataset for missing values,
which fortunately are not present in the current
dataset. Following this, the author proceeds to process
the classification features such as gender and color.
As LightGBM requires input features to be in
numeric form, the classification features are
converted into numeric format using Label Encoder.
To achieve this, the author first identifies and filters
out all columns of type "object" in the dataset and
creates a Label Encoder instance for each
Predictions for Consumer Behaviour of E-Commerce Sales Data 2023-2024 Based on the LightGBM Model
111
classification feature. The fit transform method is
then applied to convert all the categorical values of
the "object" type columns into corresponding integers,
which are then stored back in the original data frame.
Finally, the Label Encoder instance of each feature is
saved to a dictionary for future use.
During the process of screening independent
variables, the authors utilized the drop function to
eliminate the noisy Custom ID column. This step
helps reduce the complexity and risk of overfitting,
ultimately enhancing the model's generalization
ability. Eliminating unnecessary features can lead to
shorter training times and potentially improve
prediction accuracy. Fewer features enable the model
to better capture real-world patterns in limited data
without being overwhelmed by extraneous
information.
3.2 Model Performance
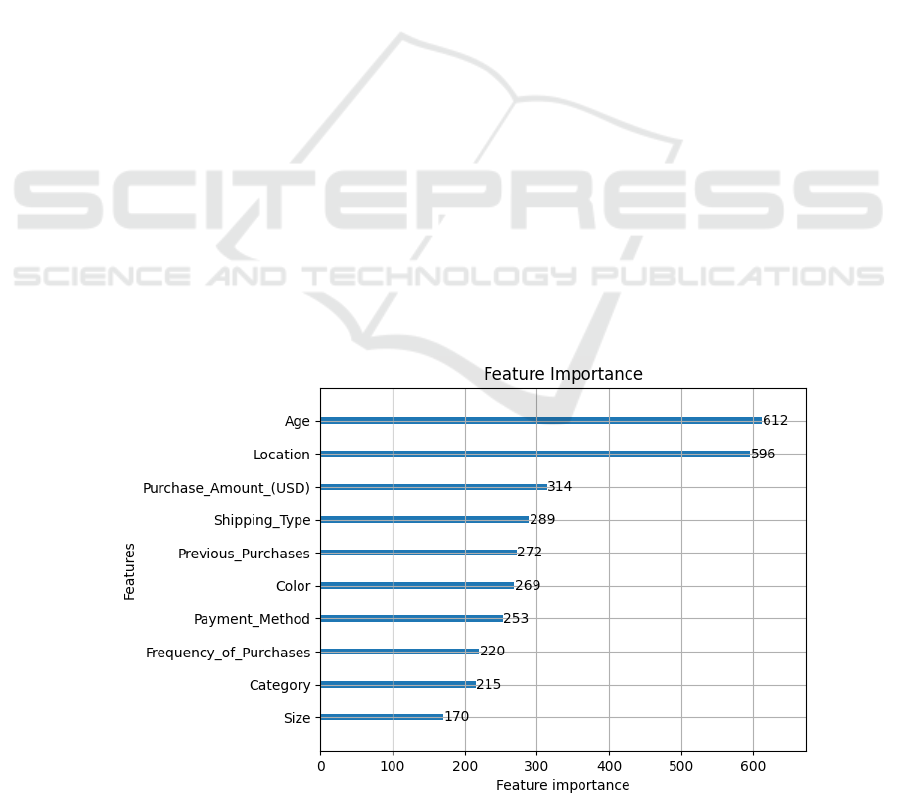
The feature importance distribution is shown in Fig.
1. The analysis of the data demonstrates that age
emerges as the most influential factor, garnering the
highest score and implying that a customer's age
significantly affects rating predictions. Age is likely
strongly correlated with purchasing behavior, product
preferences, and purchasing power, all of which can
impact customer ratings. Furthermore, both age and
location carry considerable weight, as evidenced by
their high scores, highlighting the importance of a
customer's geographic location in rating
determinations, given its potential impacts on
logistics, service quality, and product availability, all
of which contribute to customer satisfaction and
ratings. Notably, purchase amount also stands out as
an important attribute, indicating that the amount
spent significantly influences customer ratings,
possibly due to its influence on customer expectations,
which can influence ratings positively or negatively.
The significance of shipping types in the scores
underscores the crucial role of delivery methods in
customer satisfaction, with different shipping
methods impacting delivery speed, cost, and
convenience, all of which are significant factors in
customer ratings. Additionally, the weight given to
previous purchase history suggests that a customer's
past purchasing behavior is a strong predictor of their
current rating, likely owing to varied expectations and
satisfaction levels among loyal and repeat customers.
Color also demonstrates considerable importance,
possibly because color choices directly impact
customer satisfaction, particularly in the context of
fashion or aesthetic preferences. The score attributed
to payment method indicates that the method of
payment has an impact on the score, likely due to its
influence on customer satisfaction and security. The
relatively low score of purchase frequency, though
important, may reflect the customer's purchasing
habits and loyalty. The low score of the product
category suggests that the impact of different product
categories on the score might not be as apparent as
with previous characteristics, but it remains one of the
influencing factors. Finally, size has the lowest score
of all the features, yet it still contributes to the
prediction, likely because the choice of size directly
affects the appropriateness of the product and
customer satisfaction.
Figure 1: Feature importance map.(Self-painted)
ECAI 2024 - International Conference on E-commerce and Artificial Intelligence
112
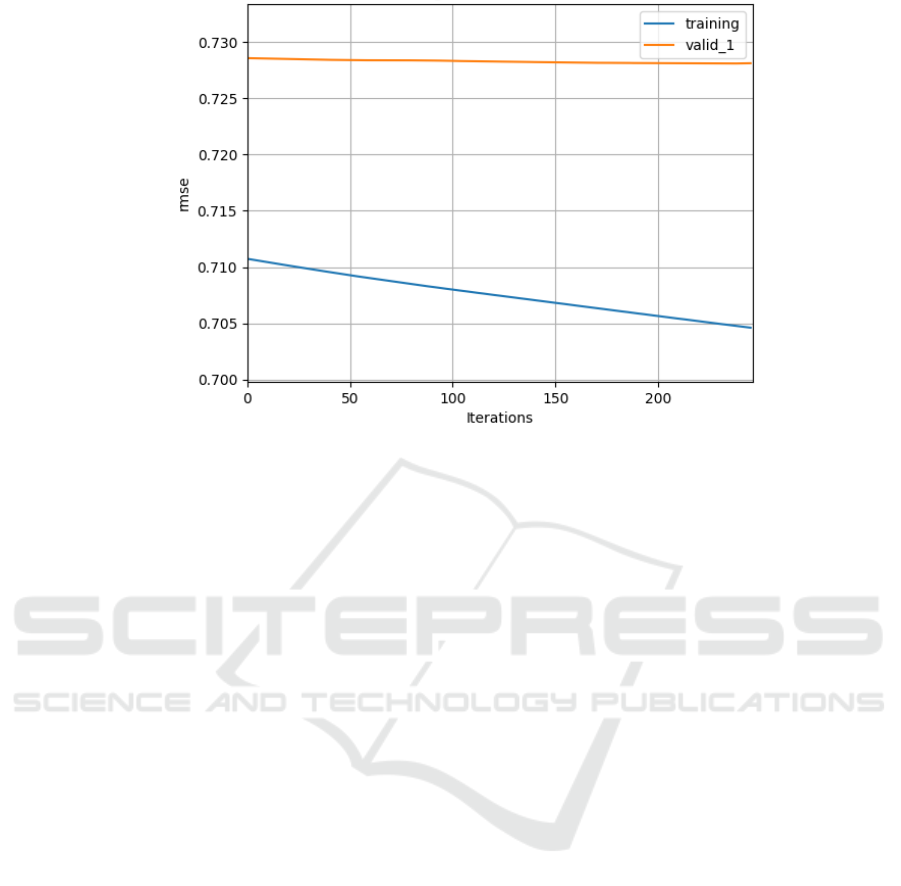
Figure 2: Training and Validation RMSE. (Self-painted)
It is important to note that demographic
characteristics such as age and location play a
significant role in predicting an individual's score.
This could be attributed to the varying needs,
expectations, and spending behaviors of customers.
Additionally, the high importance placed on purchase
amount and shipping type indicates that enhancing
the purchasing experience and delivery services can
lead to improved customer satisfaction. While
characteristics like previous purchases and payment
methods may have slightly lower scores, they still
hold a significant impact on predictive outcomes in
specific scenarios. Upon reviewing the feature
importance map, the authors suggest that businesses
prioritize the features with the most significant impact
on the score to enhance service strategies, elevate
customer satisfaction, and ultimately improve
customer ratings. Furthermore, this insight can aid the
authors in refining the model and enhancing
prediction accuracy through feature engineering and
selection.
The data from Fig. 2 illustrates that the RMSE of
the training set consistently decreases with an
increasing number of iterations, indicating an
improvement in the model's fit to the training data.
With each iteration, the model becomes better at
capturing patterns and trends in the training data,
resulting in a continued decrease in the training set
error. In contrast, the RMSE of the validation set
initially shows a slight decrease, followed by a
plateau. This suggests that the model's performance
on the validation set remains relatively stable, with no
significant improvement or degradation as the
training progresses. Based on these observations, it
can be inferred that the ongoing reduction in the
RMSE of the training set reflects the model's
continuous enhancement in fitting the training data.
However, the stability of the validation set's RMSE
implies that the model is approaching its optimal
generalization ability, indicating that it has reached its
peak predictive capacity for new data.
The residual distribution depicted in Figure 3
shows that the residuals are approximately centered
around zero and are evenly dispersed on both sides.
This indicates a lack of systematic bias in the model's
predictions, suggesting a balanced distribution
between over- and under-predictions. While the
residual distribution is nearly symmetrical, there is a
slight skew. Ideally, a perfectly symmetrical
distribution around zero would signify an unbiased
model with good performance. However, the slight
asymmetry observed here suggests that the model
may exhibit systematic errors in certain scenarios.
The residual values, ranging from approximately
-1 to 1, imply a degree of error in the model's
predictions. Although errors within this range are
acceptable, the model may have larger errors when
processing specific data points. The fluctuations in
the residual histogram suggest that the frequency
distribution is not entirely uniform across different
residual ranges. This could indicate systematic errors
within specific prediction ranges. To better
understand these fluctuations, further analysis of error
sources or enhancement of feature engineering may
be necessary.
Predictions for Consumer Behaviour of E-Commerce Sales Data 2023-2024 Based on the LightGBM Model
113
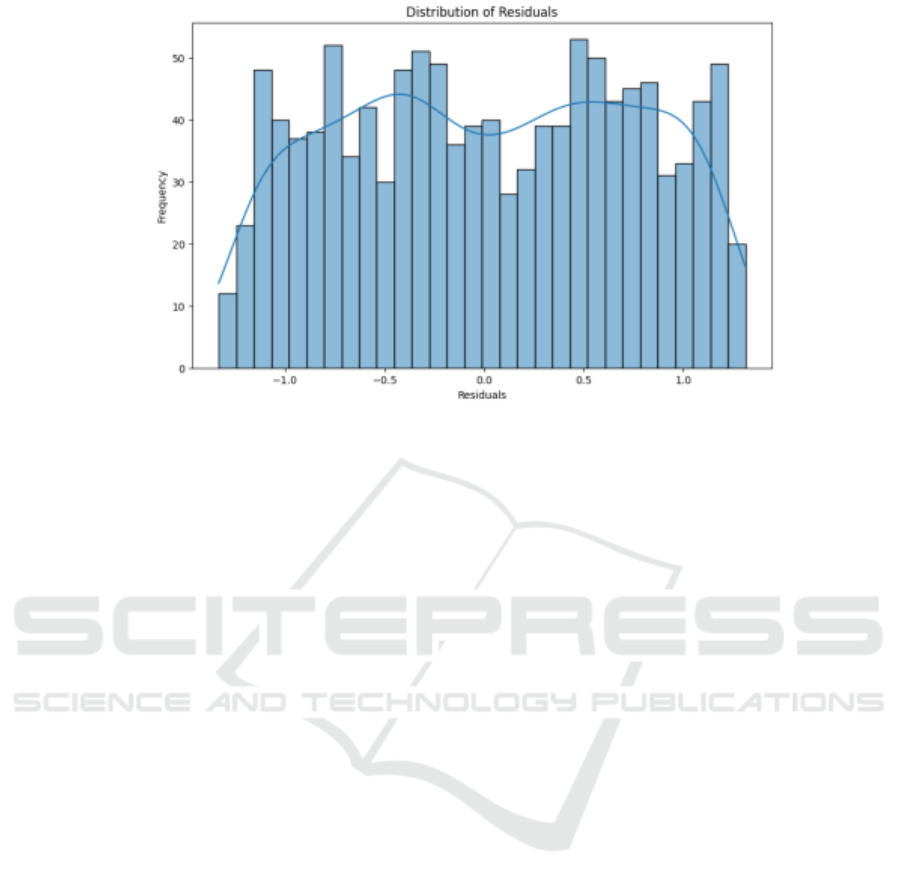
Figure 3: Distribution of Residuals. (Self-painted)
3.3 Comparisons and Implications
The original model provides relatively simple
information compared to the original model. For
instance, most people are 69 years old, there are more
male buyers than female buyers, and the best-selling
items are Blouses, Pants, and Jewelry, with Clothing
being the most popular category. The majority of
buyers are from Montana, California, and Idaho.
Medium-sized products have the highest sales
volume. The most popular colors purchased are Olive,
Yellow, and Silver. Free shipping attracts the largest
number of buyers. Montana produces the most items,
and the Fall season generates the most profit.
The implications of model selection are
noteworthy, as LightGBM has proven to be a superior
choice when dealing with datasets exhibiting
complex nonlinear relationships or a high number of
categorical features. This preference is attributed to
LightGBM's utilization of a decision tree-based
gradient boosting method, facilitating the automatic
detection of intricate patterns and feature interactions
in the data. Moreover, its capability to effectively
process categorical features renders LightGBM
exceptional in terms of prediction accuracy,
especially for multi-dimensional and high-
complexity datasets. The features position LightGBM
as an excellent candidate for various real-world
applications, including e-commerce, finance, and
user behavior analysis. In these domains, data
commonly encompasses numerous categorical
features and entails nonlinear and complex
relationships among them. Traditional linear models
often struggle to capture these intricate patterns,
resulting in diminished prediction accuracy.
Conversely, LightGBM's ability to construct multiple
decision trees enables it to progressively approximate
the distribution of real data, substantially enhancing
the model's predictive capacity.
Notwithstanding LightGBM's advantages in
accuracy and performance, its complexity presents
challenges, particularly in terms of model
interpretation and visualization. Since LightGBM
generates a series of complex tree models, the
visualization of its decision-making processes poses
difficulties. Consequently, for scenarios necessitating
immediate and quick data visualization for decision-
making purposes, traditional linear models or
straightforward visual analyses based directly on the
data are more fitting. For instance, direct plotting of
the relationship between independent and dependent
variables can swiftly generate a customer profile.
This method's simplicity and intuitiveness, facilitated
by 2D or 3D diagrams, allows users to promptly
comprehend the relationships between different
features and thereby gain rapid insights into the data.
This visualization is not only easy to comprehend but
also facilitates instant data presentation and
discussion in meetings or decision-making processes,
offering timely support to decision-makers.
The implications of this model selection approach
emphasize that tool choices should align with the
specific needs of a scenario, rather than solely
considering the complexity and accuracy of the model.
LightGBM is the recommended tool for data
scenarios that involve complex patterns and multi-
class features, aiming to enhance prediction
capabilities. For scenarios requiring rapid
ECAI 2024 - International Conference on E-commerce and Artificial Intelligence
114

visualizations and on-the-spot decision-making,
simple linear models or data visualizations may prove
more effective. This scenario-oriented model
selection strategy not only enhances work efficiency
but also ensures the accuracy and explainability of the
decision-making process.
3.4 Limitations and Prospects
LightGBM offers significant predictive performance
advantages, but its complexity limits model
interpretability. Unlike traditional linear regression
models, LightGBM constructs numerous decision
trees, resulting in a complex nonlinear model.
Therefore, directly interpreting the model's
predictions to understand the specific impact of each
feature on the outcome using regression coefficients
or other metrics can be challenging. This "black box"
attribute may pose obstacles in scenarios where
model decisions require interpretation and validation.
While LightGBM is effective at addressing
missing and outlier values through specific parameter
settings and data preprocessing methods, the model's
stability and prediction accuracy may still be affected
if the proportion of missing or outlier values is high.
In contrast, linear models can handle missing values
more readily using simple statistical methods and
tend to provide more explanatory results.
Additionally, due to the extensive decision tree
construction and iterative optimization involved in
the computational process of LightGBM, its
computational cost and time complexity are high.
Particularly when dealing with very large datasets,
training a model can necessitate a significant number
of computational resources and time. In cases where
resources are limited or real-time decision-making is
essential, this heightened computational cost can
present a challenge.
Furthermore, LightGBM can be susceptible to
overfitting, particularly if the model parameters are
not properly configured. For instance, if the tree depth
or the number of leaf nodes is set too high, the model
might overfit the training data, leading to a decrease
in the model's ability to generalize to the test data.
While this issue can be addressed through cross-
validation and regularization techniques, it is crucial
to carefully adjust the parameters in practice to ensure
the model's stability and generalization performance.
To address the limitations of the LightGBM
model in terms of interpretability, future research
could investigate integrating LightGBM with other
explanatory methods. For instance, incorporating
partially linear models or utilizing explanatory tools
such as SHAP (SHapley Additive exPlanations) can
provide deeper insights into the model's decision-
making process. Additionally, the development of
visualization tools to facilitate users’ understanding
of the model's decision-making process is a
promising area for exploration. Moreover, to better
tackle the challenges posed by missing values and
outliers, future research efforts could focus on
advancing data preprocessing techniques. These
techniques may encompass automated methods for
filling in missing values, algorithms for detecting and
handling outliers, and more. By enhancing the
stability of the model, particularly when dealing with
irrelevant data that is prevalent in real-world
scenarios, these techniques can contribute to more
robust model performance.
4 CONCLUSIONS
To sum up, this study delves into the correlation
between customer data, behavior, and feedback
scores in "E-commerce Sales Data 2023-24,"
employing the LightGBM model. The analysis
revealed that customer ratings exerted a notable
influence on key demographic factors, such as age,
location, and purchase frequency. Despite the model's
robust predictive capabilities, the complexity of the
LightGBM model poses challenges in achieving
transparent model interpretation and easy
comprehension of predictions. This lack of
interpretability is a significant impediment to
understanding how specific features impact the final
predictions, particularly for stakeholders lacking
technical proficiency. To tackle these challenges, one
proposes integrating explanatory tools, such as SHAP
(SHapley Additive Interpretation), in future research
to offer a more nuanced understanding of the model's
decision-making process. SHAP values can elucidate
the contribution of each feature to the prediction,
thereby enhancing the transparency and reliability of
the model results.
This study illustrates the potential of employing
advanced machine-learning techniques to predict
customer ratings effectively. The findings have
practical implications for the development of
customer scoring systems in the e-commerce realm,
providing individual merchants with a data-driven
approach to optimize customer engagement strategies
and enhance overall customer satisfaction. The study
underscores the importance of balancing model
complexity with explainability in applications,
particularly in scenarios where comprehending model
reasoning is crucial for making well-informed
decisions.
Predictions for Consumer Behaviour of E-Commerce Sales Data 2023-2024 Based on the LightGBM Model
115

REFERENCES
Chenchiang, R. H., Storey, V. C. H., 2012. Business
intelligence and analytics: From big data to big impact.
MIS Quarterly, 1165-1188.
Davidson, J., MacKinnon, G. R., 1993. Estimation and
inference in econometrics. Oxford University.
Feldman, R., 2013. Techniques and applications for
sentiment analysis. Communications of the ACM, 82-
89.
Gandomi, C., Haider, M. A., 2015. Beyond the hype: Big
data concepts, methods, and analytics. International
Journal of Information Management, 18, 137-144.
Hicks, R. J., 1939. Value and capital: An inquiry into some
fundamental principles of economic theory. Oxford
University.
Jones, M., Wang, L. D., 2019. Algorithmic approaches to
personalized advertising and recommendation systems.
Journal of Business Research, 17, 256-265.
Kahneman, S., Tversky, A D., 1979. Prospect theory: An
analysis of decision under risk. Econometrica: Journal
of the Econometric Society, 6, 263-291.
Litchfield, R. J., 1955. An econometric study of the
consumption function in Sweden. Economica, 17.
McAfee, M., Brynjolfsson, E. A., 2012. Big data: The
management revolution. Harvard Business Review, 19,
60-68.
SmithJohnson, B., Williams, C. A., 2020. Big data
analytics in consumer behavior forecasting. Journal of
Marketing Analytics, 114, 87-104.
ECAI 2024 - International Conference on E-commerce and Artificial Intelligence
116
