
Reevaluating Stock Price Prediction: The Influence of Machine
Learning on Forecast Accuracy
Yingqian Cao
School of Engineering, Carnegie Mellon University, Pittsburgh, PA, U.S.A.
Keywords: Stock Price, Machine Learning, Time Series Regression, Data Analysis.
Abstract: Due to the complexity and volatility of financial markets, traditional methods have often failed, prompting
the adoption of advanced machine learning techniques that leverage vast datasets and sophisticated
algorithms for improved forecast accuracy. This research aims to compare traditional and advanced machine
learning techniques in predicting equity premiums, a crucial metric in financial economics. Using a
comprehensive dataset encompassing various economic and financial indicators, this study initially
implemented a rolling linear regression model as a baseline, followed by more sophisticated models,
including Bagged Trees. Model performance was assessed using Out-of-Sample (OOS) R-squared (R
2
),
Mean Absolute Error (MAE), and Root Mean Squared Error (RMSE). The results showed that the Bagged
Trees model exhibited the most reliable performance, the Rolling Linear Regression model followed, with
the Long Short-Term Memory (LSTM) model being the least effective. The inherent unpredictability of
equity premiums is attributed to limited access to comprehensive market information, the noisy and
complex nature of financial markets, and the over-fitting tendency of advanced models. To enhance
predictive accuracy, future research should consider integrating alternative data sources, employing
advanced noise-filtering techniques, developing hybrid models, applying robust regularization methods and
creating dynamic models that adapt to evolving market conditions.
1 INTRODUCTION
In the dynamic world of finance, accurately
predicting stock prices has long been a challenging
yet essential endeavor for investors, analysts, and
financial institutions. Traditional methods, relying
heavily on historical data and linear models, have
often fallen short in capturing the complex and
volatile nature of stock markets (Mehra et al., 2003).
In this situation, the advent of machine learning has
ushered in a new era of stock price prediction (Gu et
al., 2020). By leveraging advanced algorithms and
vast datasets, machine learning techniques promise
to enhance forecast accuracy significantly.
Within the prediction of different metrics in
financial economics, equity premiums have always
been a longstanding topic. The equity premium
refers to the excess return that investing in the stock
market offers over a risk-free rate. Researchers have
explored various models and methods to predict
equity premiums, yielding mixed results. Early
studies on equity premium prediction primarily
focused on historical averages. Numerous studies
have explored the use of economic and financial
indicators to predict equity premiums. Fama and
French demonstrated that dividend yields and
earnings-price ratios possess predictability for future
equity premiums (Fama et al., 1996). Similarly,
Campbell and Shiller showed that the ratio of stock
prices to dividends could forecast long-term returns
(Campbell et al., 1988).
Despite these findings, the predictability of such
indicators remains debated. Goyal and Welch
critically reviewed several predictive variables and
found that many failed to outperform simple
historical averages Out-Of-Sample (OOS) (Welch et
al., 2008). Their findings cast doubt on the reliability
of traditional economic and financial indicators for
equity premium prediction. Researchers have also
investigated the role of macroeconomic variables in
predicting equity premiums. Lettau and Ludvigson
proposed the consumption-wealth ratio as a predictor,
demonstrating its effectiveness in forecasting future
returns (Lettau et al., 2001). However, the
predictability of macroeconomic variables is not
universally accepted. Ang and Bekaert found that
while certain macroeconomic factors could predict
IS returns, their OOS performance was often poor
Cao, Y.
Reevaluating Stock Price Prediction: The Influence of Machine Learning on Forecast Accuracy.
DOI: 10.5220/0013207000004568
In Proceedings of the 1st International Conference on E-commerce and Artificial Intelligence (ECAI 2024), pages 85-91
ISBN: 978-989-758-726-9
Copyright © 2025 by Paper published under CC license (CC BY-NC-ND 4.0)
85
(Ang et al., 2007). This inconsistency has fueled
ongoing debates about the practical utility of
macroeconomic variables in equity premium
prediction.
Over the past decade, artificial intelligence has
advanced rapidly, leading to the creation of
increasingly sophisticated data analysis techniques.
Recent advancements in machine learning and
statistical methods have opened new avenues for
predicting equity premiums. For instance, Gu et. al.
utilized machine learning techniques to analyze a
vast array of predictors, demonstrating improved
OOS performance compared to traditional models
(Gu et al., 2020). Their findings suggest that
machine learning can uncover complex patterns in
the data that conventional methods might miss.
Recurrent Neural Networks (RNNs) and bagged
trees are widely used in various fields. For example,
when predicting the future probability of
environmental factors, RNNs serve as an effective
tool, combining the learning capabilities of feed-
forward neural networks with enhanced expressive
power through dynamic equations (Chen et al.,
2018); bagged tree model can be used to map
landslide susceptibility (Wu et al., 2020). Given the
success of these models in predicting time-
dependent variables in different contexts, there is
significant potential for using these models to
predict equity premiums, which are also time-
dependent variables.
This study aims to introduce linear regression
model and advanced machine learning techniques to
predict stock prices for performance comparison.
The predictions are, in turn, evaluated with OOS R-
squared value (R
2
), Mean Absolute Error (MAE),
and Root Mean Squared Error (RMSE).
2 METHOD
2.1 Dataset Preparation
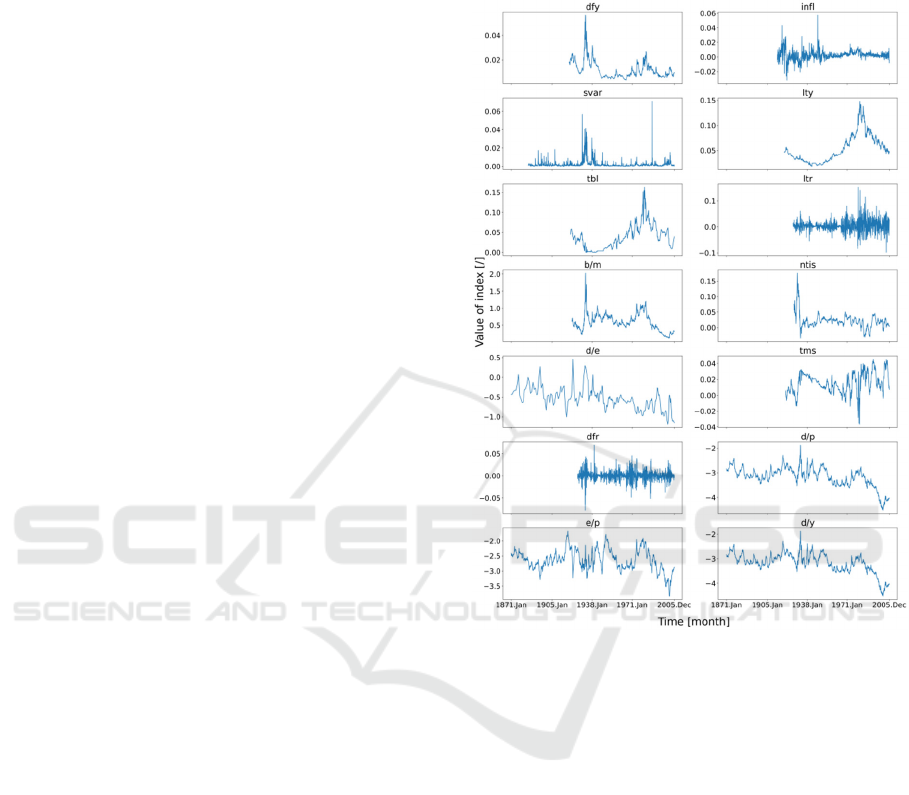
In this study, the equity premium dataset is used for
stock prices’ evaluating (Welch et al., 2008). The
data is related to equity premium with prominent
variables, which stores 1, 620 records (i.e., one
instance per month) and covers 17 columns. All
variables are numerical fields. Based on the equity
premium dataset, 14 different explanatory variables
are recreated such as inflation and stock variance
(Welch et al., 2008).
In order to understand the extreme values and
temporal trend of the data, the data was plotted, as
shown in Figure 1.
Figure 1: Explanatory variable against time (1871 - 2005)
(Welch et al., 2008).
2.2 Machine Learning-based Prediction
In this part, rolling linear regression model is used to
replicate and verify the conclusions in the work
carried out by Welch et al. (Welch et al., 2008).
Then, two advanced models (RNNs and bagged tree)
are used to improve and recreate R
2
, RMSE and
MAE values.
2.2.1 Linear Regression-based Prediction
Rolling linear regression model fits regressions to a
window of data, continuously updating the model as
the window shifts forward over time. The illustration
of rolling multiple linear regression model is shown
in Figure 2.
ECAI 2024 - International Conference on E-commerce and Artificial Intelligence
86
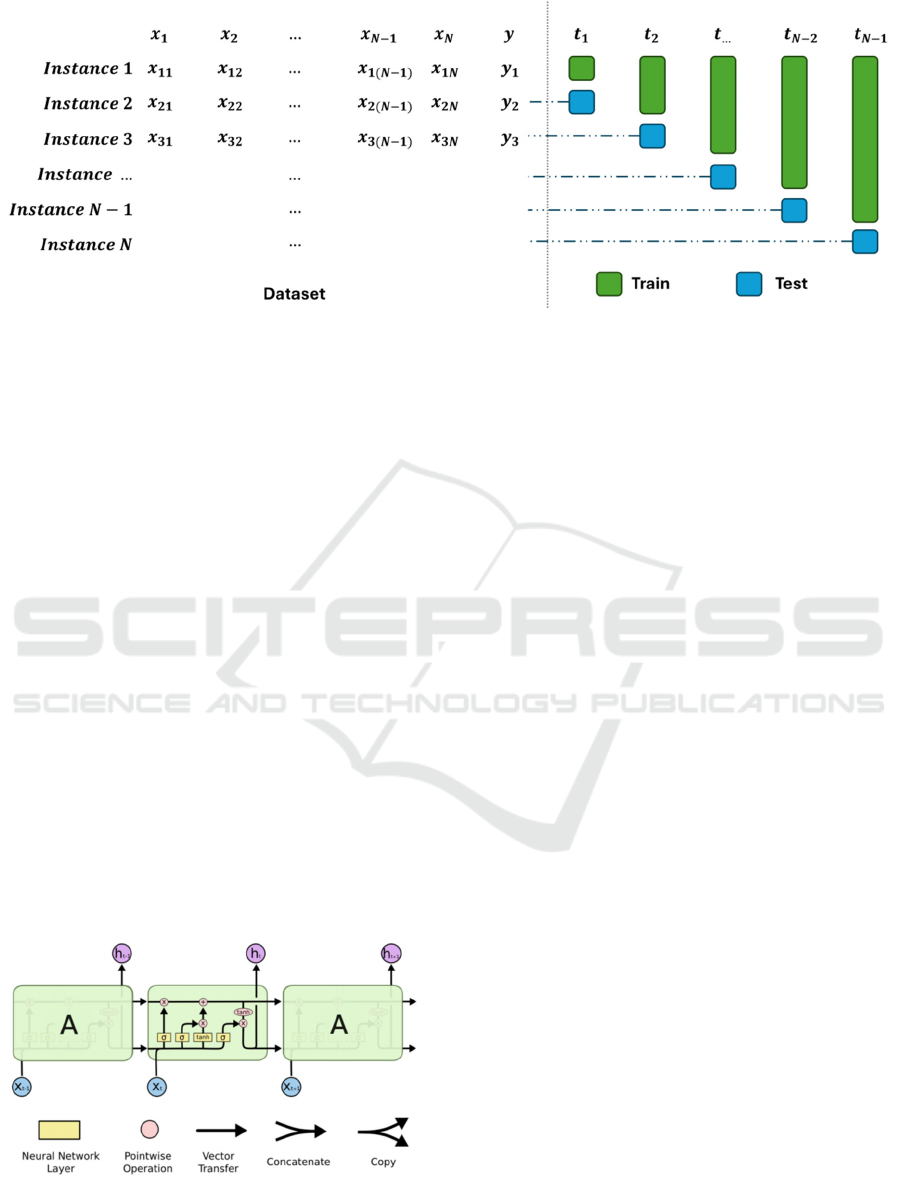
Figure 2: Illustration of the Model (Photo/Picture credit: Original).
Using a rolling linear regression model offers
several advantages. This approach allows for
dynamic analysis by enabling model parameters to
change over time, thus capturing evolving
relationships between variables. It also aids in
detecting structural changes or breaks in the data,
providing insights into periods of instability or shifts
in underlying processes. Additionally, it improves
model robustness by reducing the impact of outliers
and anomalies, ensuring reliability even with
unusual data points. In this part, the model does not
require the determination of any extra parameters.
2.2.2 LSTM
RNNs generate and retain memory of previous states
throughout the feed-forward process. The
mechanism of Long Short-Term Memory (LSTM), a
specific type of RNN, is illustrated in Figure 3.
LSTM models offer several advantages, such as
managing long-term dependencies and overcoming
the vanishing gradient problem typical in traditional
RNNs. Additionally, LSTMs can handle variable-
length sequences and provide robust performance in
both directions.
Figure 3: Interacting layers in an LSTM (Thorir, 2021).
In this part, the model is trained with a hidden
state of 256 neurons, learning rate of 6 ൈ 10
ିସ
,
weight decay of 5 ൈ 10
ି
, 15 epochs. All data
points are used at each epoch.
2.2.3 Bagged Trees Model
Bootstrap aggregating, commonly known as bagging,
is an ensemble meta-algorithm in machine learning
that enhances the stability and accuracy of
algorithms used for classification and regression.
While typically applied to decision tree methods,
bagging can be utilized with any machine learning
algorithm (Opitz et al., 1999).
Decision tree models offer several advantages.
Firstly, they are easy to understand and interpret.
This makes decision trees particularly useful for
explaining model predictions to stakeholders.
Additionally, they can handle non-linear
relationships between features and target variables,
which is beneficial for datasets with complex
interactions. Lastly, decision trees are versatile and
can be used with both numerical and categorical data,
adding to their flexibility and ease of use in various
applications.
In this part, a bagging ensemble model uses
decision trees to predict the equity premium, where
the base estimators are set to 500; when looking for
the best split, number of features to consider is set to
0.5.
3 RESULTS AND DISCUSSION
3.1 Model Performance
The true data and predicted values of each model is
plotted against time, are shown in Figure 4, Figure 5,
Reevaluating Stock Price Prediction: The Influence of Machine Learning on Forecast Accuracy
87
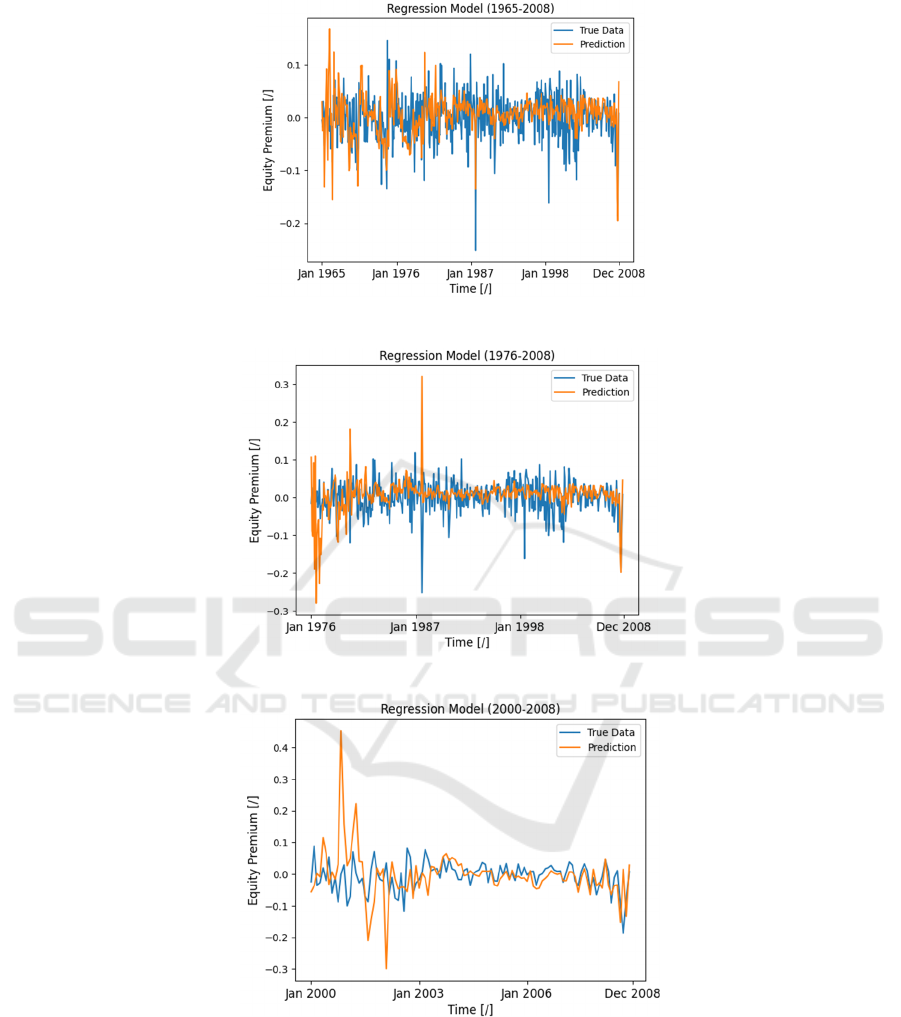
Figure 4: Performance for linear regression (1965-2008) (Photo/Picture credit: Original).
Figure 5: Performance for linear regression (1976-2008) (Photo/Picture credit: Original).
Figure 6: Performance for linear regression (2000-2008) (Photo/Picture credit: Original).
Figure 6, Figure 7, Figure 8, Figure 9, Figure 10,
Figure 11 and Figure 12.
From the plots of rolling linear regression shown
in Figure 4, Figure 5 and Figure 6, the true data and
predictions align closely, suggesting potential over-
fitting in the model. During the 1965-2008 period,
the actual data shows the highest equity premium
around 1987, whereas the model's predictions
indicate peaks around 1965 and 2008. In the 1976-
2008 period, the true label of the largest equity
premium (negative) occurs around 1987, but the
model predicts the highest premiums around 1976
(positive) and 2008. For the 2000-2008 period, the
true data exhibits relatively stable equity premiums,
while the model forecasts significant peaks in 2001
(positive) and 2002 (negative).
ECAI 2024 - International Conference on E-commerce and Artificial Intelligence
88
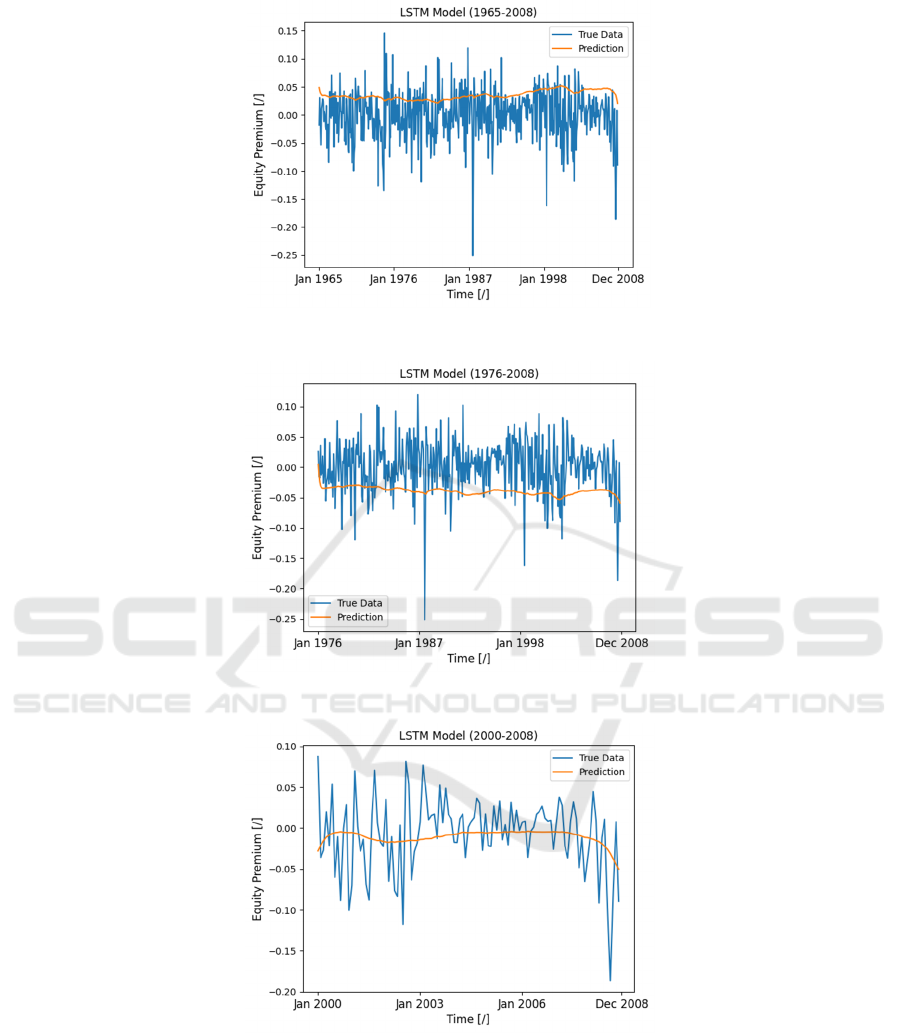
Figure 7: Model performance for LSTM (1965-2008) (Photo/Picture credit: Original).
Figure 8: Model performance for LSTM (1976-2008) (Photo/Picture credit: Original).
Figure 9: Model performance for LSTM (2000-2008) (Photo/Picture credit: Original).
The plots shown in Figure 7, Figure 8 and Figure
9 demonstrate that the bidirectional LSTM model no
longer exhibits over fitting but fail the capture the
trend across most of the periods studied. In the
1965-2008 and 1976-2008 periods, as well as the
2000-2008 period, the predictions generally do not
follow the rise and fall of the actual equity premium.
Reevaluating Stock Price Prediction: The Influence of Machine Learning on Forecast Accuracy
89

Figure 10: Performance for bagged trees (1965-2008)
(Photo/Picture credit: Original).
Figure 11: Performance for bagged trees (1976-2008)
(Photo/Picture credit: Original).
Figure 12: Performance for bagged trees (2000-2008)
(Photo/Picture credit: Original).
The plot shown in Figure 10, Figure 11 and
Figure 12 shows that while the predictions from the
decision tree model generally follow the same
pattern as the true data, there are frequent and abrupt
fluctuations in the predictions that do not align
smoothly with the equity premium’s trend. Although
the model captures some of the general rise and fall
of the true data, these frequent, jagged movements
suggest that the decision tree model is not a suitable
method for reliable equity premium forecasting.The
irregular pattern of the predictions suggests that this
model is overly sensitive to changes in the training
data and does not capture the underlying market
dynamics consistently or meaningfully.
3.2 Evaluation Metrics
A horizontal comparison of metrics for model
evaluation was calculated, as listed in Table 1, Table
2 and Table 3.
Table 1: R-squared distributions.
Period
Rolling Linear
Re
g
ression model
LSTM
model
Bagging
Tree model
1965-
2008
0.034 -0.673 -0.0810
1976-
2008
-0.837 -0.8195 -0.092
2000-
2008
-2.312 0.0648 -0.1617
Table 2: RMSE distributions.
Period
Rolling Linear
Re
g
ression model
LSTM
model
Bagging
Tree model
1965-
2008
0.043 0.0569 0.0021
1976-
2008
0.059 0.0589 0.0021
2000-
2008
0.081 0.0437 0.0024
Table 3: MAE distributions.
Period
Rolling Linear
Re
g
ression model
LSTM
model
Bagging
Tree model
1965-
2008
0.032 0.0440 0.0342
1976-
2008
0.037 0.0493 0.0344
2000-
2008
0.049 0.0332 0.0351
The bagging tree model is the most reliable,
despite its negative R-squared values, followed by
the rolling linear regression model, with the LSTM
model being the least effective.
The performance differences among the models
can be attributed to several factors. The rolling linear
regression model tends to overfit historical data,
capturing noise rather than underlying trends, and
lacks the flexibility to model non-linear relationships
and complex market dynamics. Additionally, its
ECAI 2024 - International Conference on E-commerce and Artificial Intelligence
90

assumption of parameter stability over time does not
hold well in the volatile stock market, reducing
predictive accuracy. The LSTM model, while
designed to handle long-term dependencies,
struggled with capturing equity premium trends due
to its high data and hyperparameter tuning
requirements, and its sensitivity to sequence length.
The bagged trees model, on the other hand, benefits
from capturing complex interactions and non-linear
relationships through ensemble learning, reducing
over-fitting and variance. However, it exhibited
frequent abrupt fluctuations, indicating noise
sensitivity and potential over-fitting to training data,
along with insufficient temporal adaptation,
affecting its long-term prediction reliability. These
differences indicated by its negative R-squared
values, which highlight the inherent unpredictability
of the equity premium.
3.3 Discussion
The unpredictability of the equity premium is due to
several factors: limited access to comprehensive
information in real-world markets, the inherent noise
and complexity of financial markets exhibiting non-
stationary and chaotic behaviors, and the simplicity
of the models used in the analysis, which lack the
sophisticated optimization of Genetic Algorithms-
enhanced (GAs-enhanced) models. Additionally, the
tendency of complex models to over-fit historical
data can result in poor generalization in OOS
predictions.
The current implementation is not without areas
to improve. First, incorporating alternative data
sources, such as sentiment from social media or
news, could provide more insights and improve
predictions. Second, advanced noise-filtering
techniques like wavelet transforms or Kalman filters
could help isolate useful patterns from market noise.
Third, using hybrid models and advanced
optimization techniques like GAs may enhance
model performance. Moreover, future research
should also focus on preventing over-fitting by
applying better regularization methods and using
robust validation techniques. Developing dynamic
models that adapt to changing market conditions,
such as those using reinforcement learning, could
also lead to more accurate predictions.
4 CONCLUSIONS
This study reevaluated stock price prediction by
comparing the performance of traditional and
advanced machine learning techniques. A rolling
linear regression model and advanced models such
as LSTM and bagged trees were used to predict
equity premiums, evaluating their performance using
OOS-R
2
, RMSE, and MAE. This study concludes
that while advanced machine learning models offer
improved performance metrics, the equity premium
remains fundamentally challenging to predict
accurately. Contributing factors to this
unpredictability include limited access to
comprehensive information, the inherent noise and
complexity of financial markets, the simplicity of
models used, and the over-fitting tendency of
complex models on historical data. To improve
future predictions, incorporating alternative data
sources, advanced noise-filtering techniques, hybrid
models, and better regularization methods, as well as
developing dynamic models that adapt to changing
market conditions, are recommended.
REFERENCES
Ang, A., & Bekaert, G. 2007. Stock return predictability:
Is it there? The Review of Financial Studies, 20(3),
651-707.
Campbell, J. Y., & Shiller, R. J. 1988. The dividend-price
ratio and expectations of future dividends and discount
factors. The review of financial studies, 1(3), 195-228.
Chen, Y., Cheng, Q., Cheng, Y., Yang, H., & Yu, H. 2018.
Applications of recurrent neural networks in
environmental factor forecasting: A review. Neural
Computation, 30(11), 2855-2881.
Fama, E. F., & French, K. R. 1996. Multifactor
explanations of asset pricing anomalies. The Journal
of Finance, 51(1), 55-84.
Gu, S., Kelly, B., & Xiu, D. 2020. Empirical asset pricing
via machine learning. The Review of Financial Studies,
33(5), 2223-2273.
Ingolfsson, T. M. 2021. Insights into LSTM architecture.
Retrieved from https://thorirmar.com/post/insight_into_
lstm/
Lettau, M., & Ludvigson, S. 2001. Consumption,
aggregate wealth, and expected stock returns. the
Journal of Finance, 56(3), 815-849.
Mehra, R., & Prescott, E. C. 2003. The equity premium in
retrospect. Handbook of the Economics of Finance, 1,
889-938.
Opitz, D., & Maclin, R. 1999. Popular ensemble methods:
An empirical study. Journal of Artificial Intelligence
Research, 11, 169-198.
Welch, I., & Goyal, A. 2008. A comprehensive look at the
empirical performance of equity premium prediction.
The Review of Financial Studies, 21(4), 1455-1508.
Wu, Y., Ke, Y., Chen, Z., Liang, S., Zhao, H., & Hong, H.
2020. Application of alternating decision tree with
AdaBoost and bagging ensembles for landslide
susceptibility mapping. Catena, 187, 104396.
Reevaluating Stock Price Prediction: The Influence of Machine Learning on Forecast Accuracy
91
