
Machine Learning Implementation for Demand Forecasting in
Supply Chain Management
Yumo Bai
a
Department of Economics, University of California San Diego, San Diego, U.S.A.
Keywords: Demand Forecasting, Machine Learning in Retail, ARIMA Model, XGBoost Algorithm.
Abstract: This paper aims to enhance demand forecasting accuracy in retail supply chains with the application of
machine learning techniques: Autoregressive Integrated Moving Average (ARIMA) and XGBoost models. In
this respect, the research addressed shortcomings of traditional approaches to forecasting, very often missing
the complexity of modern demand patterns due to their reliance on historical data and simplistic assumptions.
While the ARIMA model would model seasonality in time series data, the XGBoost would model more
complex and nonlinear interactions among multiple features. The dataset was sourced from Kaggle. Treatment
of missing values and outliers was handled, and further enhancement by feature engineering was added. The
results indicate that while ARIMA is very effective in capturing temporal dependencies and seasonal trends,
XGBoost outperforms it in handling complex relationships that deal with fuel prices and CPI. Indeed, the
combination of both models makes for a holistic model toward demand forecasting, illustrating substantial
improvements in the accuracy of the forecast. This can be taken as proof that by combining these methods,
the retailing sector might come up with efficient inventory management strategies. Further work could also
aim at incorporating more sources of external data into the model, and model scaling to allow real-time usage.
1 INTRODUCTION
Demand forecasting has been identified as the driver
of supply chain management with regard to inventory
optimization, operational efficiencies, and customer
satisfaction. This would help the company in
optimizing inventory levels, hence reducing costs,
and this has huge implications for practice. A correct
forecast ensures adequate availability of products,
reduces costs related to overstocking and
understocking, and raises the overall satisfaction level
of the customers by setting productions and inventory
strategies in accordance with the actual market
demand.
The recent advances that have been in machine
learning open an avenue of promise for alternative
solutions to the traditional approaches (Lin et al.,
2024). This is because the traditional approaches, on
many occasions, have failed to capture the
complexity and dynamics that characterize modern
demand patterns because they are coupled with over-
reliance on statistical modeling and reliance upon
manual working processes. These traditional
a
https://orcid.org/0009-0000-7169-2444
methods, in their own ways, are restrictive, for they
build up the forecast based on historic demand
information and are inherently inclined to make
simple assumptions that do not account for
complicated market trends, promotional activities,
and other exogenous economic leading indicators
(Ampazis, 2015). Machine learning models, on the
other hand, can deal with large data sets, identify
patterns that are complex, and deliver trustworthy
forecasts. It can help in replacing the existing
lackluster traditional forecast processes. For instance,
Arif et al. demonstrated that machine learning
algorithms, such as K-Nearest Neighbors, Support
Vector Machines, and Gaussian Naive Bayes,
significantly improve demand forecasting accuracy in
retail supply chains (Arif et al., 2019).
However, there are still some major gaps in
existing research. Firstly, most existing models have
limited the integration of multiple external factors. In
other words, for such factors as temperature and
unemployment rate, how they dynamically interact
Bai, Y.
Machine Learning Implementation for Demand Forecasting in Supply Chain Management.
DOI: 10.5220/0013206900004568
In Proceedings of the 1st International Conference on E-commerce and Artificial Intelligence (ECAI 2024), pages 77-84
ISBN: 978-989-758-726-9
Copyright © 2025 by Paper published under CC license (CC BY-NC-ND 4.0)
77
with each other to influence sales forecasting is less
investigated by existing models. For example, Wu
and Coggeshall showed that proper cross-validation
techniques can guarantee that the model does not get
overfitted and remains flexible to demand patterns by
touting regression, neural networks, and decision
trees (Wu and Coggeshall, 2012). However, there is a
lack of research on how these engineered features
could be optimized and dynamically adjusted
according to changing market conditions. Moreover,
the feature importance analysis for the existing
research was very less comprehensive. For example,
Chen and Guestrin have demonstrated that factors
like an unemployment rate and fuel price are
influential in demand forecasting using the Gradient
boosting Model (GBM) (Chen and Guestrin, 2016).
However, little has been done in terms of exploring
feature extraction and selection methods with a view
to improving the performance of forecasting. In view
of this, according to this study, a more comprehensive
approach will be adapted with further adjustments
and treatments in data processing and model
selection.
This paper is geared toward developing a machine
learning model that improves the accuracy of demand
forecasting for any retail company. The
Autoregressive Integrated Moving Average model
(ARIMA) will be chosen specifically for this project
to model time series data with strong seasonal
patterns. According to Shukla, this model has very
good predictive performance on such data (Shukla,
2020). The study will also include extreme Gradient
Boosting as a supplement, which helps capture
complicated and nonlinear interactions between
features. While XGBoost and GBM are both
implementations of the gradient boosting algorithm,
the former will be chosen because it has built-in
cross-validation and early stopping functions. Thus,
additional lines of code for cross-validation and early
stopping would not be needed, making model
validation and parameter tuning relatively easy. This
makes it easier to avoid model overfitting during the
training process. Obviously, these models
complement each other in functionality. For instance,
an ARIMA model is used to model time series data in
the first place, this should capture the trend and
cyclical changes of the data. In this respect, based on
the ARIMA model, an XGBoost model may further
deal with the residues in order to improve the
accuracy of the whole prediction. Their combination
may, therefore, give rise to a comprehensive retail
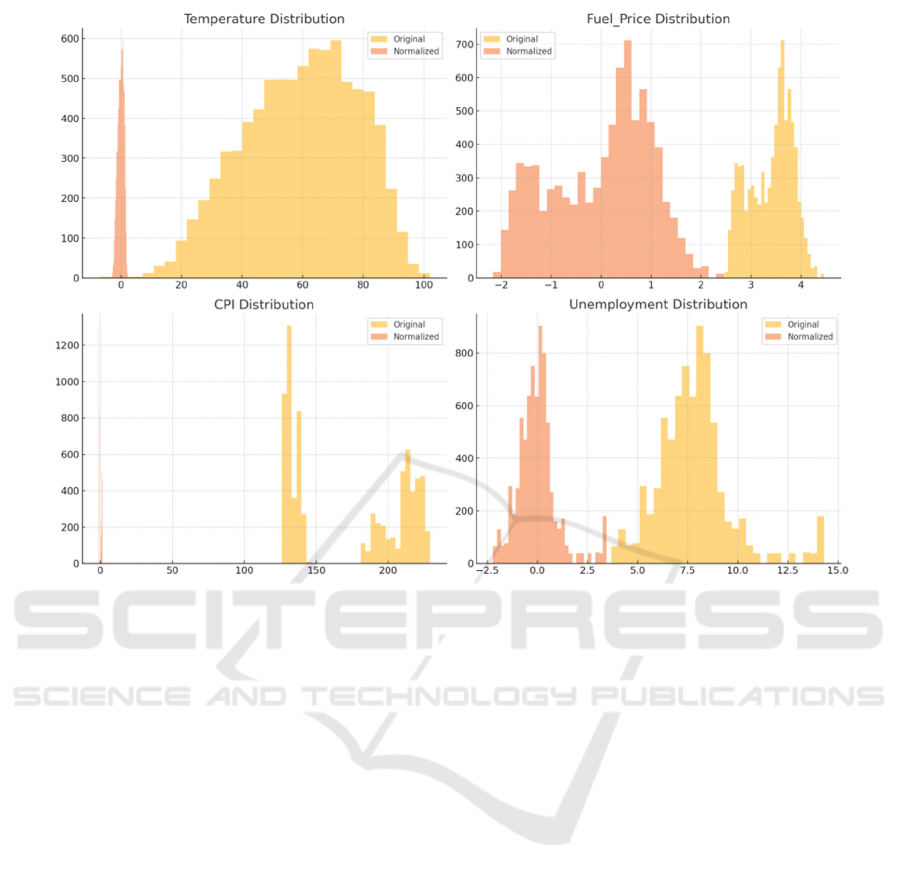
Figure 1: Comparison of Original and Normalized Distributions for Selected Features (Photo/Picture credit: Original).
ECAI 2024 - International Conference on E-commerce and Artificial Intelligence
78
demand forecasting method, improving operational
efficiency and enhancing strategic decision-making
in inventory management.
2
METHOD
2.1 Dataset Preparation
The dataset for this research is obtained from Kaggle
(Ahmedov, 2022). This dataset contains details of 12
fields and 8,190 records, capturing important factors
such as temperature and fuel price, markdowns,
Consumer Price Index (CPI), and unemployment rate
that could impact the sale. This involved dealing with
missing values, outliers, and normalization. Missing
values in the MarkDown field were replaced with the
median to reduce skewness. Outliers were treated
using the process of the Interquartile Range (IQR)
and were also subjected to Winsorization to minimize
the inflating effects outliers had on the model.
Numerical features were then scaled to zero mean and
unit variance, using Sklearn library's StandardScaler.
This procedure will make learning more efficient and
increase model precision. Figure 1 show the
comparison of raw and standardised distributions of
some features.
Feature engineering is an important step to
improve forecast accuracy, which creates rolling
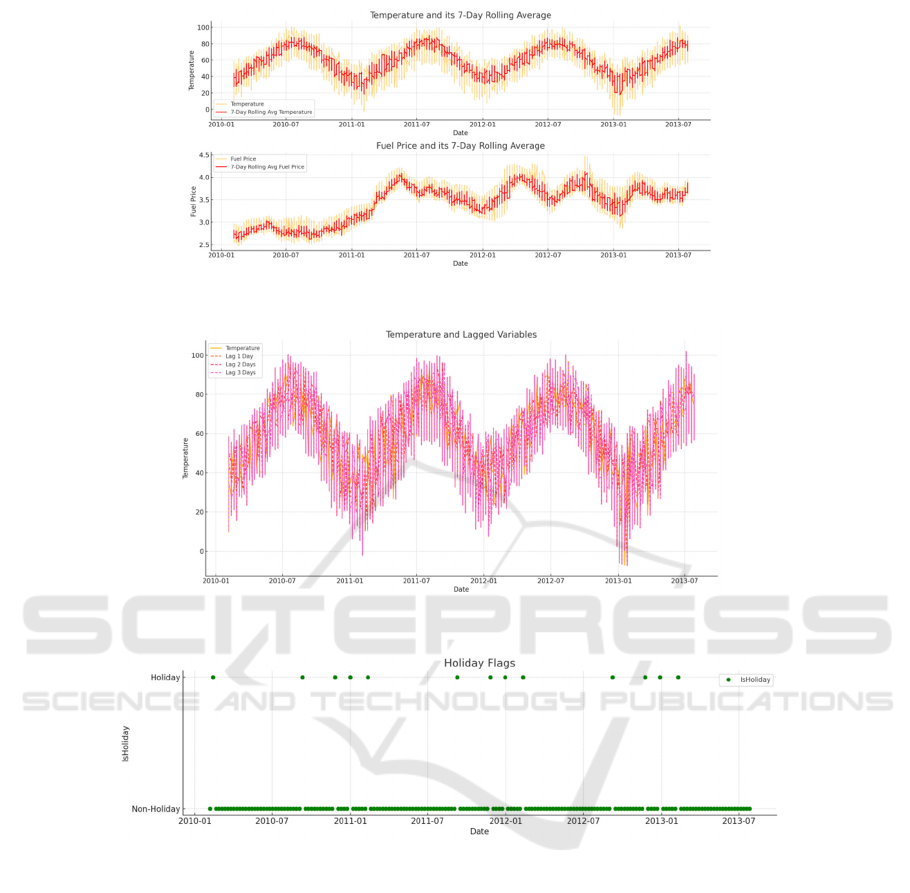
Figure 2: Temperature and Fuel Price with their respective 7-day rolling averages (Photo/Picture credit: Original).
Figure 3: The distribution of temperature and lagged variables (Photo/Picture credit: Original).
Figure 4: The distribution of Holiday Flags (Photo/Picture credit: Original).
Machine Learning Implementation for Demand Forecasting in Supply Chain Management
79

means and lagged variables to capture short-term
fluctuations and time dependence, respectively (Wu
& Coggeshall, 2012). It involved creating rolling
averages and lagged variables to capture short-term
fluctuations and temporal dependencies. Rolling
averages for temperature and fuel prices over a 7-day
window helped smooth out short-term noise and
highlight long-term trends. Lagged variables for
temperature, fuel prices, and markdowns were
created to capture both short-term and slightly longer-
term dependencies. In addition, a binary flag variable,
IsHoliday, was introduced to account for the effects
of holidays on sales patterns in this study. The
processed dataset now contains 22 fields, including
the original and preprocessed features. The processed
dataset will be trained with an 80:20 train-test split for
easy model evaluation. Figures 2, Figure 3 and Figure
4 illustrate the application of rolling averages and
lagged variables to smooth and capture the temporal
dependencies in the data. The codes of ARIMA
model and XGBoost are both from open-source files
on github (dmlc, 2021; Shukla, 2024).
2.2 ARIMA Combined GBM Model
2.2.1 Introduction of ARIMA
ARIMA is a well-proven statistical method widely
used in forecasting time series. The acronym stands
for AutoRegressive (AR) terms, integrated (I) terms,
and Moving Average (MA) terms combined in the
analysis of trends (Shukla, 2020). The AR part
models the variable on its own lagged values, the
integrated terms add differencing in the data to
achieve stationarity, and the MA part models the error
term as a linear combination of the error terms that
occurred contemporaneously and at various times in
the past (Shukla, 2020). As suggested by Shukla
(2020), ARIMA has been considered an appropriate
model in demand forecasting with a strong data trend
or seasonal pattern. For instance, in predicting the
level of retail sales, ARIMA can be fitted to historical
sales data showing apparent seasonal fluctuations
(Shukla, 2020). An ARIMA equation will compute
future behavioral models that correctly predict future
peaks and troughs in sales (Shukla, 2020). This
application in real life manifests the capacity of
ARIMA to model complex seasonal behaviors in time
series data; hence, it makes a very suitable choice for
this project, where historical sales data present a very
significant seasonal pattern because of holidays and
promotional activities. Through ARIMA, this study
could capture such temporal patterns, thus increasing
the accuracy of the short-term forecasts.
2.2.2 Introduction of GBM
XGBoost is a powerful machine learning technique
designed to scale and efficiently deal with large-scale
datasets and complex relationships in data. In this
setting, it forms an ensemble of weak learners—
usually decision trees—where each successive tree
tries to rectify the mistakes made by its predecessor.
As Chen and Guestrin point out, XGBoost provides
state-of-the-art results for a range of machine learning
problems in terms of scalability, efficiency, and the
ability to handle sparsity (Chen & Guestrin, 2016, p.
786). The dataset is also significant for nonlinear
interactions among features with broad predictors
considered in the case, such as temperature, fuel
prices, CPI, and markdowns. Moreover, XGBoost
allows insights into the importance of features, such
that one can identify the most important drivers of
demand and those that would guide strategic
decision-making. What makes it perfect for this
project is its proven performance in many
competitions and its ability to scale across distributed
environments, just as Chen and Guestrin had said—
strong and malleable (Chen & Guestrin, 2016).
2.2.3 Implementation Details
In this project, ARIMA and XGBoost are applied
complementarily to leverage their strengths. ARIMA
focuses on modeling the temporal dependencies of
sales data, representing seasonal trends and periodic
fluctuations. The model will work well on short-term
forecasts, where knowing past trends is very
important. XGBoost is utilized in the modeling of
complex interactions in a rich set of engineered
features against the target variable, using lagged
variables and rolling averages, along with holiday
flags. This builds on the flexibility and complexity of
the model that captures intricate patterns in the
driving of demand, thus leading to accuracy in
forecasting. Finally, this study tested the robustness
and the right prediction power of the models through
a solid validation strategy that includes cross-
validation and out-of-sample testing. Performance
measures showing the goodness of fit to the model are
Mean Absolute Error (MAE), Root Mean Square
Error (RMSE), and combined with residual analysis
to confirm the adequacy of the models. So, by
comparing those metrics, this project can determine
which model is more effective under different
scenarios and refine the approach accordingly.
ECAI 2024 - International Conference on E-commerce and Artificial Intelligence
80
3 RESULTS AND DISCUSSION
3.1 The Performance of the Model
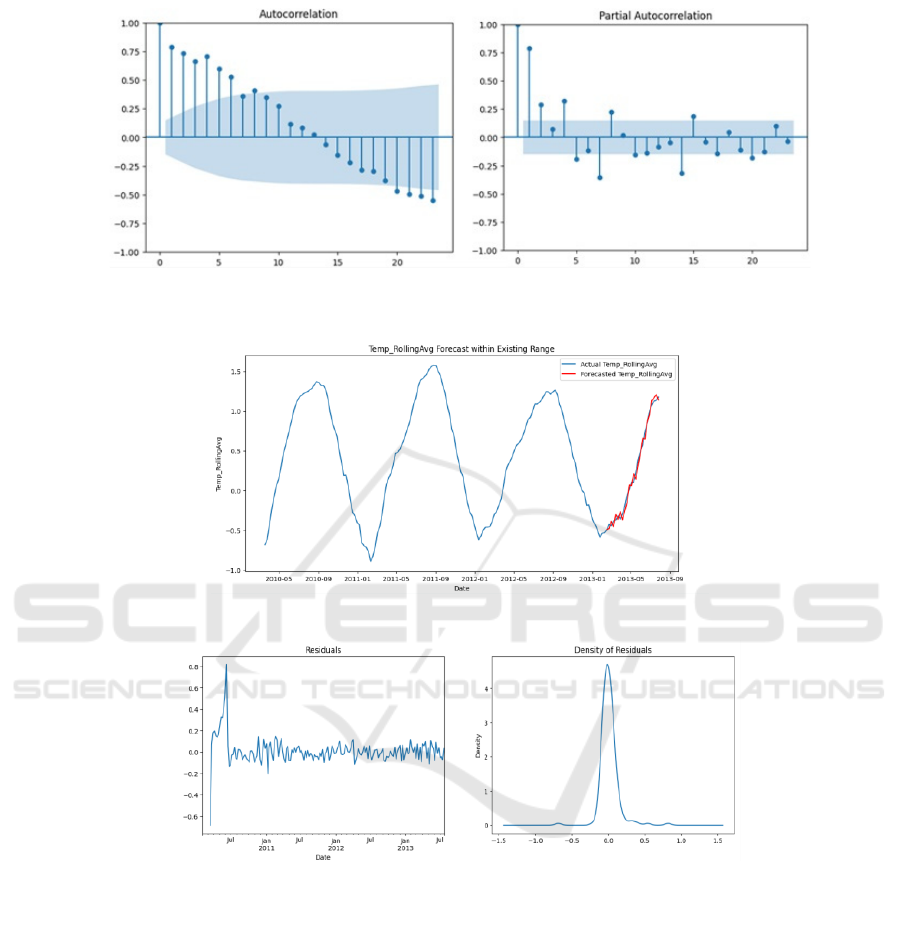
The ARIMA model was tested for stationarity using
the Augmented Dickey–Fuller (ADF) test during
development. The ADF test resulted in a statistic of -
3.936202 with a p-value of 0.001784, which led to the
rejection of the null hypothesis of non-stationarity.
This confirmed that the differenced series was
appropriate for ARIMA modeling. The identification
of the ARIMA model's order was guided by the
Autocorrelation Function (ACF) and Partial
Autocorrelation Function (PACF) plots. As shown in
Figure 5 and Figure 6, the ACF plot showed a slow
decay, suggesting a moving average component in the
model, while the PACF plot indicated that an
autoregressive component of order 1 would be
suitable. Thus, an ARIMA (1,1,1) model was selected
for further analysis. The model was trained on the
Temp_RollingAvg and Fuel_Price_RollingAvg
series, with significant autoregressive (AR. L1 =
0.9504, p < 0.001) and moving average (MA. L1 = -
0.4306, p < 0.001) coefficients.
Figure 5: Autocorrelation Function (ACF) Plot and Partial Autocorrelation Function (PACF) Plot for Temp_RollingAvg
(Photo/Picture credit: Original).
Figure 6: Forecast of Temp_RollingAvg within Existing Range (Photo/Picture credit: Original).
Figure 7: Residuals and Density of Residuals for Temp_RollingAvg Forecast (Photo/Picture credit: Original).
Machine Learning Implementation for Demand Forecasting in Supply Chain Management
81
The model's predictive ability was validated by
comparing forecasts to actual data from February 15,
2013, to July 26, 2013. The forecasts closely followed
the actual observations, particularly in the latter part
of the series, as shown in Figure 6. This close
agreement demonstrates that the ARIMA model
effectively captured the underlying patterns,
including trends and seasonal components. The
model's MAE was 0.060637, and the RMSE was
0.066666, indicating a good fit. Residual analysis, as
presented in Figure 7, further validated the model's
performance. The residuals showed initial volatility
but later stabilized around zero, indicating that the
ARIMA model effectively captured the data's
patterns without leaving out systematic components.
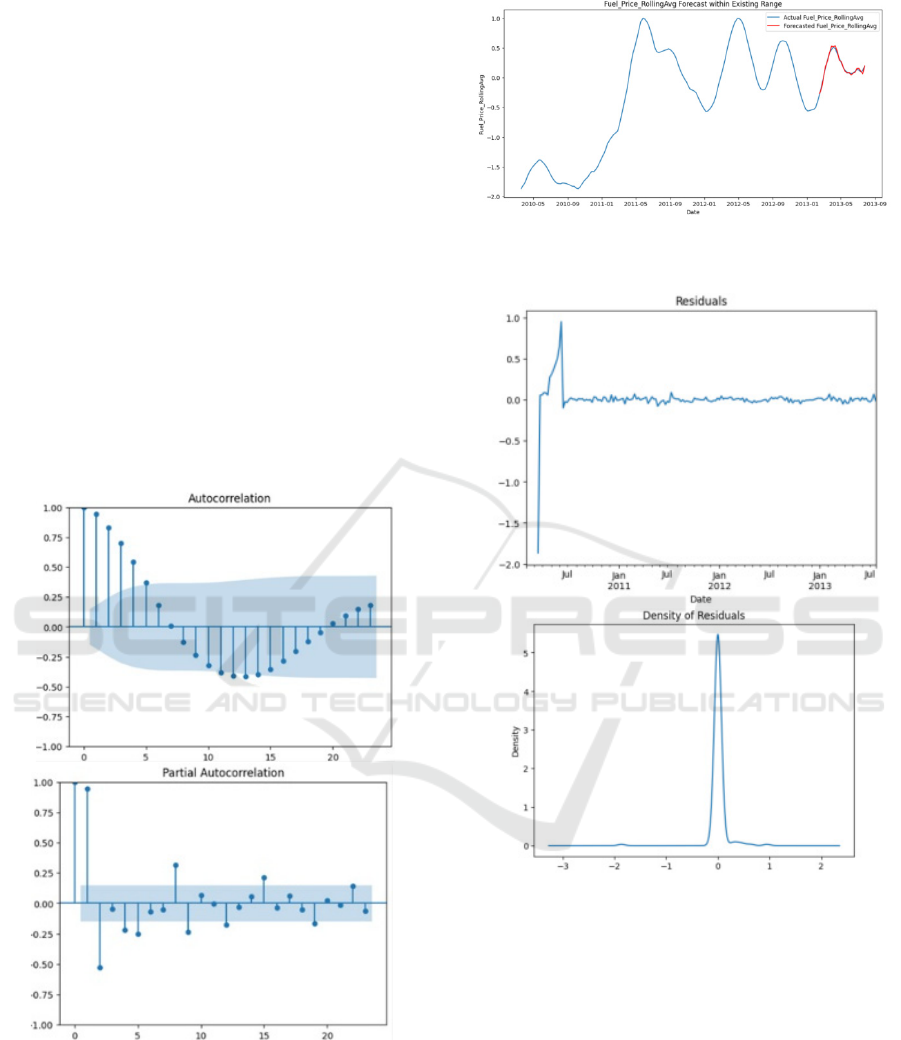
The model's application to the
Fuel_Price_RollingAvg series showed similarly
strong predictive power, with supporting evidence
from ACF and PACF plots, forecast, and residual
analyses (Figure 8, Figure 9 and Figure 10).
Figure 8: Autocorrelation Function (ACF) Plot and Partial
Autocorrelation Function (PACF) Plot for
Fuel_Price_RollingAvg (Photo/Picture credit: Original).
Figure 9: Forecast of Fuel_Price_RollingAvg within
Existing Range (Photo/Picture credit: Original).
Figure 10: Residuals and Density of Residuals for
Fuel_Price_RollingAvg Forecast (Photo/Picture credit:
Original).
The XGBoost model utilized 100 estimators with
a learning rate of 0.1. The model's predictive
performance, evaluated by MAE (0.36085) and
RMSE (0.50281), indicated reasonable accuracy.
While it captured the overall trend, particularly for
Fuel_Price, fluctuations in CPI predictions were less
accurate, as shown in Figure 11 and Figure 12.
Residual analysis, depicted in Figure 13 and Figure
14, revealed a random distribution around zero for
CPI and Fuel_Price, indicating unbiased predictions.
The feature importance analysis of the XGBoost
model (shown in Figure 15) identified unemployment
ECAI 2024 - International Conference on E-commerce and Artificial Intelligence
82
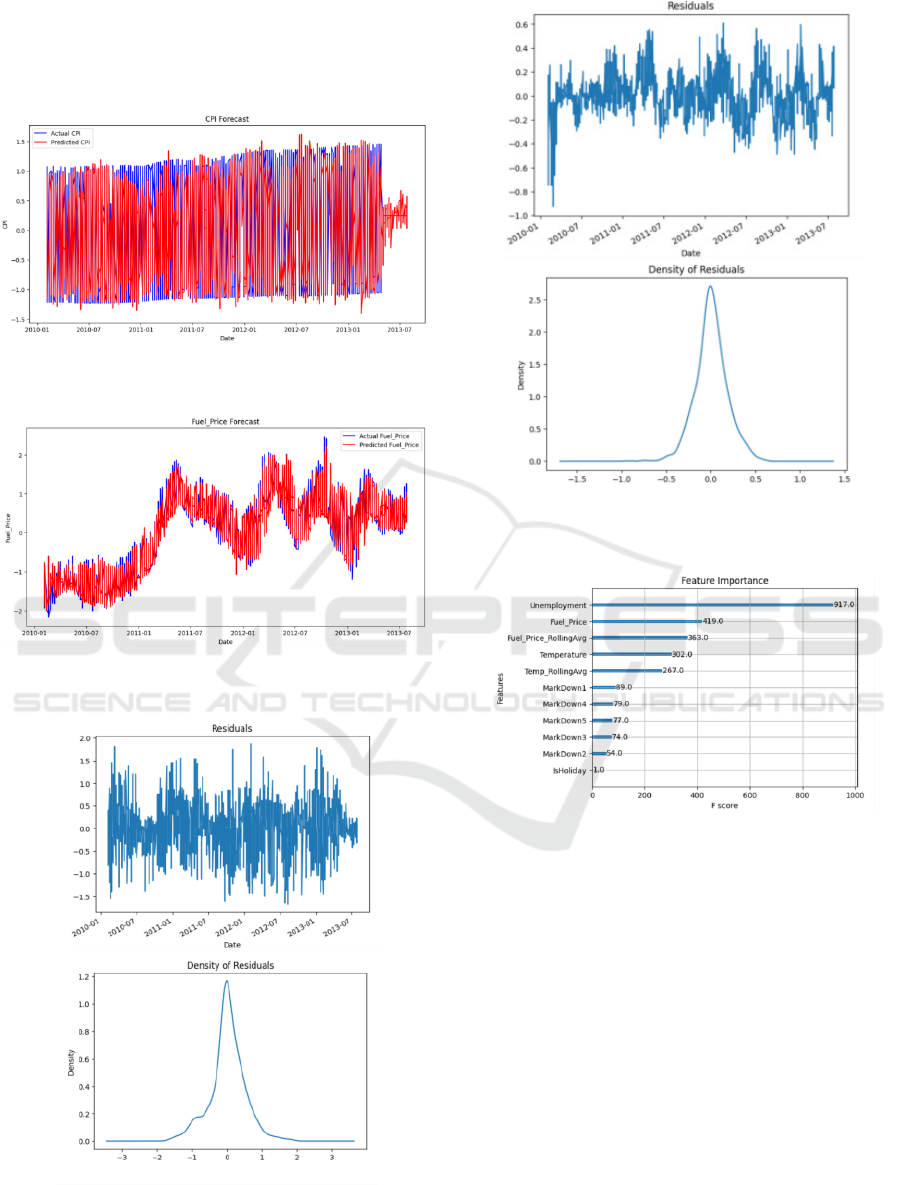
rate as the most important factor influencing the CPI
and forecasts. These insights are valuable for
improving forecasting strategies and improving the
decision-making process.
Figure 11: Actual vs. Predicted CPI Values (Photo/Picture
credit: Original).
Figure 12: Actual vs. Predicted Fuel_Price Values
(Photo/Picture credit: Original).
Figure 13: CPI Residual Analysis and Density Plot
(Photo/Picture credit: Original).
Figure 14: Fuel_Price Residual Analysis and Density Plot
(Photo/Picture credit: Original).
Figure 15: CPI Feature Importance Plot (Photo/Picture
credit: Original).
3.2 Discussion
The results of this study further confirm the
significance of the ARIMA model in capturing
seasonal trends and temporal dependencies within
data, while the XGBoost model is much more adept
at handling complex and nonlinear relationships.
More importantly, this research illustrates the
complementary advantages of the two models over
different aspects of demand forecasting. This thus
insinuates that a hybrid model—capitalizing on the
strong points of the ARIMA and XGBoost—may be
critical to overcoming a myriad of challenges
characterizing the modern retail environment.
Machine Learning Implementation for Demand Forecasting in Supply Chain Management
83

These findings also support some of the prior
studies, confirming and giving further insight into
these models' applications in demand forecasting. For
example, this study can be deemed to extend the work
of Arif et al. In such respect, they were able to
demonstrate that machine learning algorithms were
indeed capable of making retail demand forecasts
(Arif et al., 2019). Their research, however, was
limited to less complex data sets where the
relationship among variables was more direct. Based
on this, this paper further elaborates on the detailed
dynamics of complex reality through the division of
complex data into two categories, linear and
nonlinear, and applies two advanced machine
learning algorithms with different logics: ARIMA
and XGBoost.
In addition, the findings from this study also
connect to Frank's research. He added that if the
models were to be well trained and validated, then
machine learning models would improve demand
forecast accuracy based on different prevailing
factors (Frank, 2022). In light of this research, the
XGBoost algorithm was used to determine drivers of
demand, like unemployment and fuel prices, and
provide reliable forecasts in this paper. This is
evidenced by the random distribution of residuals
around zero and the normal distribution of errors. It is
further added to the ability of the model in terms of
providing actionable intelligence for the process of
decision-making by feature importance analysis.
4 CONCLUSIONS
This paper focuses on the development of machine
learning models for demand forecasting within a
retail context in a bid to optimize inventory
management. The main aim is to be able to come up
with good demand forecasts that result in balancing
stock levels, reducing costs due to overstocking and
understocking while increasing customer satisfaction.
This work improves the accuracy of demand
forecasting by using machine learning techniques in
time series analysis, ARIMA and XGBoost, for
capturing complex interactions between different
features. Reflecting on this project, future research
can incorporate more external data sources to
improve the robustness and accuracy of the prediction
model. For instance, in the forecasted weather aspect
for assessing the impact on sales, real-time weather
data would be most effective in capturing the direct
effects on consumer behavior. The most troublesome
parts that occurred in completing this project were the
size limitation of the dataset and missing values. This
is why data augmentation and synthetic data
generation are promising research paths. Last,
attention should be paid to the model's scalability and
deployment in a real-world environment. This could
involve a real-time prediction framework with
automatic model retraining to keep it up-to-date and
accurate over time.
REFERENCES
Ahmedov, A. 2022. Walmart Sales Forecast: Walmart Sales
Forecasting A CRISP-DM Model [Data set]. Kaggle.
Retrieved June 27, 2024, from
https://www.kaggle.com/datasets/aslanahmedov/walm
art-sales-forecast
Ampazis, Nicholas. 2015. Forecasting Demand in Supply
Chain Using Machine Learning. International Journal
of Artificial Life Research, 5(1), 85.
Arif, M. A. I., Sany, S. I., Nahin, F. I., & Rabby, A. S. A.
2019. Comparison study: product demand forecasting
with machine learning for shop. In 2019 8th
International Conference System Modeling and
Advancement in Research Trends (SMART) (pp. 171-
176). IEEE.
Chen, T., & Guestrin, C. 2016. Xgboost: A scalable tree
boosting system. In Proceedings of the 22nd acm
sigkdd international conference on knowledge
discovery and data mining (pp. 785-794).
Dmlc. 2021. XGBoost [Source code]. GitHub. Retrieved
Aug 2, 2024, from https://github.com/dmlc/xgboost.
Frank, Edwin. 2022. Leveraging Machine Learning to
Improve Demand Forecasting for Production Planning
and Inventory Optimization. Journal of Supply Chain
Management, 22(3), 5.
Lin, Z., Zhu, G., Deng, Y., Chen, X., Gao, Y., Huang, K.,
& Fang, Y. 2024. Efficient parallel split learning over
resource-constrained wireless edge networks. IEEE
Transactions on Mobile Computing.
Sarangkartikey50. 2016. Stock prediction time series
analysis [Source code]. GitHub. Retrieved June 26,
2024, from https://github.com/sarangkartikey50/stock-
prediction-time-series-analysis
Shukla, P. 2024. Ultimate guide for ARIMA time series
forecasting. Dataaspirant. Retrieved June 26, 2024,
from https://dataaspirant.com/arima-time-series-
forecasting/
Wu, J., & Coggeshall, S. 2012. Foundations of predictive
analytics. CRC Press.
ECAI 2024 - International Conference on E-commerce and Artificial Intelligence
84
