
Multiple Factors’ Influence on the Employees’ Performance: Analysis
Based on Random Forest and Polynomial Regression
Yufei Wang
a
School of Foreign Studies, Northwestern Polytechnical University, Dongxiang Road, Xi’an, China
Keywords: Performance Management, Random Forest, Polynomial Regression.
Abstract: This study aims to identify and analyze key factors influencing employee performance using advanced
machine learning techniques. Specifically, it seeks to elucidate the relationships between variables such as
salary, employee engagement, and satisfaction, and to develop strategies for optimizing these factors to
enhance performance. A dataset from Kaggle was preprocessed to ensure data quality, including the
imputation of missing values and transformation of categorical features. A numerical feature pipeline was
employed to impute missing values using the median method and standardize the data. For categorical features,
missing values were imputed using the most common method and transformed into a binary format using
OneHotEncoder. A Random Forest (RF) model was utilized to identify the most significant features, with the
model’s performance optimized through GridSearchCV and resampling techniques to address class imbalance.
Polynomial Regression models were subsequently employed to explore nonlinear relationships between the
significant factors identified by the RF model and employee performance. The polynomial transformations of
degree 3 were applied to capture nonlinearity. Each model focused on one of the top three important
independent variables: salary, engagement survey scores, and employee satisfaction. Results indicate that
engagement survey scores, employee satisfaction, and salary exhibit significant nonlinear relationships with
performance.
1 INTRODUCTION
Employee performance and its management is an
important issue in business administration. Above all,
the effective accomplishment of organisational goals
depends in large part on human resources. Thus,
human resource management is a basic function of
business administration and a fundamental
responsibility of managers. The core of the human
resource management system is performance
management (Utin & Yosepha, 2019). Finding and
evaluating the elements affecting employee
performance is crucial to comprehending
performance management fully and putting it into
practice. However, performance is dependent on
considerable factors. It can be strongly influenced by
various features, including their knowledge and
competencies, the organisational environment, and
the incentives they get. As a result, it is difficult to
ascertain whether different factors relate to
a
https://orcid.org/ 0009-0001-9833-6658
performance, as well as how much of an impact each
aspect has and to what degree.
In the past, considerable scholars have already
investigated this topic. For instance, Shahzadi, et al.
investigated how motivation affects workers’ output
(Shahzadi, 2014). They discovered that motivation
and performance had a strong positive correlation.
The significance of employee engagement and its role
in enhancing performance was emphasized by Anitha
(Anitha, 2014). Pawirosumarto et al. suggested that
leadership style also affects employees’ performance
significantly (Pawirosumarto, 2017). Moreover,
Nagaraju and Pooja’s research indicated a positive
relationship between salary and performance
(Nagaraju, 2017).
Moreover, a Random Forest (RF) is a group or
assortment of Classification and Regression Trees
(CART) (Breiman et al., 2017). Bremian devised this
strategy, which combines his bagging sample
methodology with the random feature selection
technique introduced independently by Ho et al., to
Wang, Y.
Multiple Factors’ Influence on the Employees’ Performance: Analysis Based on Random Forest and Polynomial Regression.
DOI: 10.5220/0013206200004568
In Proceedings of the 1st International Conference on E-commerce and Artificial Intelligence (ECAI 2024), pages 51-55
ISBN: 978-989-758-726-9
Copyright © 2025 by Paper published under CC license (CC BY-NC-ND 4.0)
51

generate a set of decision trees with controlled
variance (Fawagreh et al., 2014). Since the method
had been developed, it was used in multiple areas.
These include agriculture, ecology, land cover
classification, remote sensing, wetland classification,
bioinformatics, biological and genetic association
studies, genomics, quantitative structure, and so on
(Tyralis et al., 2019). Especially, in the area of
management, Random Forest is widely used in the
areas of financial management, risk management, and
so on (Zhao, 2022).
However, despite the previous efforts made by
considerable scholars, which usually investigate a
specific factor and its influence on employee
performance usually with qualitative method, there is
still space for deep ploughing into a comprehensive
study of multiple factors and comparing their
influences on performance, especially with machine
learning methods. Variable importance measures are
used by RF to assess the significance of variables.
Meanwhile, Polynomial Regression is designed for
dealing with non-linear correlations. Therefore, it is
believed that RF and Polynomial Regression are
suitable models for identifying the significant factors
and exploring the relationship between multiple
factors and employee performance.
Using RF and Polynomial Regression to analyse
the effects of various factors on worker performance,
this paper endeavours to study: 1) The influential
factors that affect employee performance and their
relationships with it are well understood. 2) Methods
to leverage these factors to improve employee
performance. Firstly, RF is used to determine the top
important features, and then the Polynomial
Regression is employed to find the correlations
between these features and employee performance.
2 METHOD
2.1 Dataset Preparation
The dataset used is provided by Richard and Carla on
the platform “Kaggle” (Richard, 2020). This dataset
was chosen due to it provides various dimensions
regarding the factors which may influence employee
performance, including employees’ engagement,
satisfaction, salary etc. The original dataset contains
35 columns and 312 rows.
Then, 22 columns which are unrelated to the
objects of this study, overlap with other columns in
meaning, or may cause potential bias, such as racism
or sexism, are deleted, Therefore, 13 columns are left,
including 5 numeric features and 8 categorical
features.
After that, the dataset was preprocessed in order
to guarantee data quality and model compliance
before the analysis was performed. A numerical
feature pipeline and a categorical feature pipeline
were built separately. A two-step sequential pipeline
was developed for numerical features. First, to ensure
a reliable handling of missing data, missing values
were imputed using the median method. The data was
then standardized with a standard deviation of 1 and
centred around 0 using the StandardScaler method. In
contrast, a different pipeline was used to process the
category features. To preserve data integrity, missing
category values were first imputed using the most
common method. After that, categorical variables
were transformed into a binary format using the
OneHotEncoder, which made it possible for the
models to interpret them correctly and handle
unknown categories with grace. A
ColumnTransformer was instantiated, combining the
numerical and categorical pipelines, to combine these
preprocessing procedures. The specified numerical
and categorical features in the dataset were to be
subjected to the appropriate transformations by this
transformer.
2.2 Random Forest
For this investigation, the preprocessed data was
initially split into two sets: a testing set and a training
set. The test set consisted of 20% of the data, while
the training set contained the remaining 80%.
Additionally, the class imbalance in the dataset was
addressed by combining the Synthetic Minority Over-
sampling Technique (SMOTE) with Edited Nearest
Neighbors (ENN). By ensuring a fair representation
of the target variable classes in the training data, this
resampling technique improved the model’s capacity
to generalize. Then, GridSearchCV was used to
optimize the Random Forest classifier’s performance
through hyperparameter tuning. The parameter grid
included a number of hyperparameters, consisting of
the minimum samples for splitting, the maximum
depth of trees, the number of estimators, and the
minimum samples per leaf. The GridSearchCV
determined the ideal configuration, which maximized
the predictive power of the model by thoroughly
going over various parameter combinations.
Furthermore, the feature importances were extracted
from the best-performing Random Forest classifier.
The top ten most significant features influencing
employee performance were displayed in a horizontal
ECAI 2024 - International Conference on E-commerce and Artificial Intelligence
52
bar plot to further illustrate the significance of these
factors.
2.3 Polynomial Regression
Polynomial Regression allows one to account for a
nonlinear connection between the predictor and
response variable. In this study, three separate
Polynomial Regression models were built, each
concentrating on one of the top 3 important
independent variables, including salary, engagement
survey scores, and employee satisfaction. First, the
relevant columns from the dataset were taken out
according to the outcome of the Random Forest
model. Salary, EngagementSurvey, and
EmpSatisfaction were the independent factors taken
into account, while PerformanceScoreEncoded was
the dependent variable. The dataset was split using an
80-20 split into training and testing sets in order to
facilitate model validation. A pipeline that included
polynomial feature transformation and standard
scaling was created for every model. Although the
degree of the polynomial may be changed to modify
the complexity, it was set at 3 to induce nonlinearity.
To fit the transformed data, a linear regression model
was also incorporated into the process. The pipeline
was used to train each model on its corresponding
training set. This procedure involves scaling and
modifying the training data, then fitting the
polynomial regression model to it. Each independent
variable was given a range of values in order to
facilitate prediction. The scaler component in the
pipeline was used to normalize these values. In order
to help create a smooth prediction curve, the trained
model was then used to forecast the performance
scores for these standardized values. Plotting the
anticipated performance scores against the
corresponding ranges of independent variables
allowed for the visualization of the results. A fitted
polynomial regression line was included in each
figure to show how the performance score and the
independent variable related to one another.
3 RESULTS AND DISCUSSION
3.1 Important Features Influencing on
Employee Performance
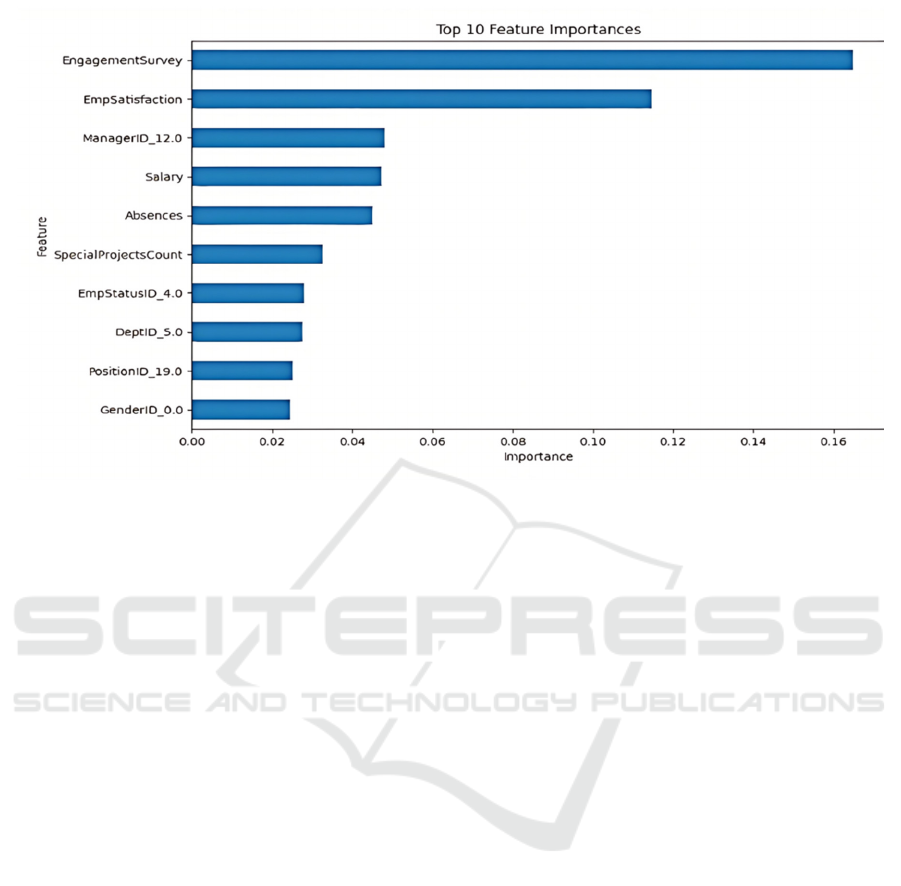
Figure 1 shows the top 10 features which significantly
affect how well employees perform. Only
EngagementSurvey, EmpSarisfaction, ManagerID,
and Salary are found to have an importance index
greater than 0.04. However, the influence of
ManagerID may be due to the different leadership
styles of various managers, and since detailed
information on these leadership styles is not provided,
the subsequent analysis will mainly focus on
engagement, satisfaction, and salary.
Figure 1: Top 10 Feature Importances (Photo/Picture credit: Original).
Multiple Factors’ Influence on the Employees’ Performance: Analysis Based on Random Forest and Polynomial Regression
53
3.2 Relationships Between Top
Important Factors and Employee
Performance
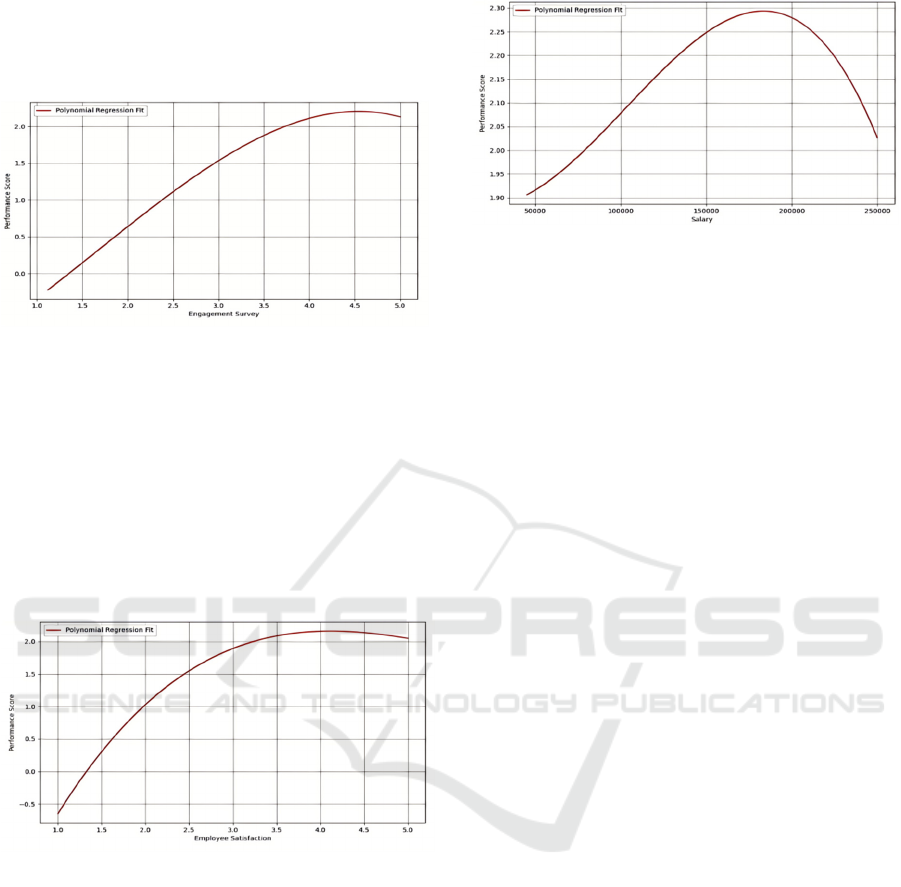
Figure 2: Performance Score by Engagement Survey
(Photo/Picture credit: Original).
Figure 2 displays a polynomial regression fit
illustrating the relationship between Engagement
Survey scores (x-axis) and Performance Scores (y-
axis). The curve shows that as the Engagement
Survey scores increase from 1.0 to approximately 4.5,
the Performance Scores also increase, reaching a
peak. After this peak, the Performance Scores start to
decline slightly as the Engagement Survey scores
approach 5.0.
Figure 3: Performance Score by Employee Satisfaction
(Photo/Picture credit: Original).
Figure 3 displays a polynomial regression fit
illustrating the relationship between Employee
Satisfaction (x-axis) and Performance Scores (y-
axis). The red curve shows that as Employee
Satisfaction scores increase from 1.0 to
approximately 4.5, the Performance Scores also
increase, reaching a peak at around 4.5. After this
peak, the Performance Scores start to decline slightly
as Employee Satisfaction scores approach 5.0. The
polynomial regression fit indicates a non-linear
relationship between these two variables.
Figure 4: Performance Score by Salary
(Photo/Picture credit: Original).
Figure 4 displays a polynomial regression fit
illustrating the relationship between Salary (x-axis)
and Performance Scores (y-axis). The red curve
indicates that as Salary increases from approximately
$50,000 to around $200,000, the Performance Scores
also increase, peaking at a salary of around $200,000.
After this peak, the Performance Scores begin to
decline as Salary continues to rise towards $250,000.
The polynomial regression fit shows a non-linear
relationship between Salary and Performance Scores.
3.3 Measures to Leverage These
Factors to Improve Employee
Performance
According to the results, the correlations between the
three factors and performance are shown to be
initially positive and finally turn to negative after
achieving the peak, which is especially prominent in
the relationship between salary and performance.
The correlation between engagement and
performance is partly in line with the research
conducted by previous researchers, who proposed
that lower employee engagement is often related to
lower performance, and the improvement of
engagement will result in the enhancement of
performance (Motyka, 2018). On the other hand, this
study also discovers that performance can suffer from
an overly engaged level. Aside from the model’s bias,
this could be the result of an overly engaged
employee who reduces the amount of energy
allocated to their primary responsibilities by
contributing to all job-related tasks. Therefore, it is
significant for organizations to maintain an optimal
incentive level for engagement and prevent their
employees from being excessively engaged.
Moreover, the correlation between satisfaction
and performance is also in accordance with the
motivational theories which consider performance as
the end result of motivation and satisfaction (Puvada
& Gudivada, 2012). Nonetheless, it is found that
ECAI 2024 - International Conference on E-commerce and Artificial Intelligence
54

exorbitant satisfaction can also escalate the decrease
in performance. This might be the result of the
comfort zone effect. As proposed by the previous
research, when employees are in their comfort zone,
while they feel satisfied, they are also limited in the
zone and unwilling to step forward (Suppiah et al.,
2018). Therefore, unduly high satisfaction of
employees should be alarmed by organizations, and
they should encourage and incentivize their staff to
keep stepping forward.
Lastly, the correlation between salary and
performance in some aspects conforms to the
efficiency wage theory, which indicates that a higher
salary level will eventually contribute to performance
(Katz, 1986). However, the excessively high salary
level is shown to be detrimental to the employees’
performance. As a result, maintaining an optimal
salary level ensures financial stability and recognition
of employees’ contributions without leading to
diminishing returns.
4 CONCLUSIONS
In conclusion, this study highlights the complex and
multifaceted nature of factors influencing employee
performance, using analytical techniques such as
Random Forest and Polynomial Regression. Key
determinants identified include employee
engagement, satisfaction, and salary, each of which
significantly impacts performance. The findings
suggest a positive correlation between these three
factors with performance, up to an optimal threshold,
beyond which further increases yield diminishing
returns or slight declines. Moreover, it is
recommended that organizations should pay more
attention to employee performance, enhance job
satisfaction, and maintain optimal levels of salary. By
thoughtfully applying these insights, organizations
may be able to improve employee performance,
contributing to overall. However, this study presents
several limitations. The data employed may not
encompass all potential factors influencing
performance. Furthermore, while Random Forest and
Polynomial Regression offer feasible analytical
frameworks, they may not fully account for potential
interactions between variables. An even larger dataset
that includes a wider variety of variables and
situations may prove advantageous for future studies.
REFERENCES
Anitha, J. 2014. Determinants of employee engagement and
their impact on employee performance. International
journal of productivity and performance
management, 63(3), 308-323.
Breiman, L. 2017. Classification and regression trees.
Routledge.
Richard, A. et al. 2020. Human Resources Data Set [Data
set]. Kaggle.
https://doi.org/10.34740/KAGGLE/DSV/1572001
Fawagreh, K., Gaber, M. M., & Elyan, E. 2014. Random
forests: from early developments to recent
advancements. Systems Science & Control Engineering:
An Open Access Journal, 2(1), 602-609.
Katz, L. F. 1986. Efficiency wage theories: A partial
evaluation. NBER macroeconomics annual, 1, 235-276.
Motyka, B. 2018. Employee engagement and performance:
a systematic literature review. International Journal of
Management and Economics, 54(3), 227-244.
Nagaraju, B., & Pooja, J. 2017. Impact of salary on
employee performance emperical evidence from public
and private sector banks of Karnataka. International
Journal of Marketing and Human Resource
Management, 8(4), 43-51.
Pawirosumarto, S., Sarjana, P. K., & Muchtar, M. 2017.
Factors affecting employee performance of PT.
Kiyokuni Indonesia. International journal of law and
management, 59(4), 602-614.
Puvada, D. D., & Rao, G. V. 2012. Performance and Job
Satisfaction-A Critical Review. Acta Universitatis
Danubius. Œconomica, 8(2).
Shahzadi, I., Javed, A., Pirzada, S. S., Nasreen, S., &
Khanam, F. 2014. Impact of employee motivation on
employee performance. European Journal of Business
and Management, 6(23), 159-166.
Suppiah, H., & Govind, S. K. P. 2018. Transforming
Leadership Performance-Breaking Comfort-Zone
Barriers. Educational Leader (PEMIMPIN
PENDIDIKAN), 6, 64-89.
Tyralis, H., Papacharalampous, G., & Langousis, A. 2019.
A brief review of random forests for water scientists
and practitioners and their recent history in water
resources. Water, 11(5), 910.
Utin, N. H., & Yosepha, S. Y. 2019. The model of employee
performance. International Review of Management and
Marketing, 9(3), 69.
Multiple Factors’ Influence on the Employees’ Performance: Analysis Based on Random Forest and Polynomial Regression
55
