
Machine Learning Models-Based Video Game Sales Prediction
Kaiyue Wu
a
School of Statistics and Data Science, Capital University of Economics and Business, Beijing, China
Keywords: Data Science, Machine Learning, Sales Prediction.
Abstract: Accurately predicting sales has become particularly important due to the complexity and diversity faced by
video game sales forecasting and the impact of multiple factors on sales fluctuations. This paper proposes a
novel approach using advanced machine learning algorithms to enhance sales predictions, aiding industry
stakeholders in making informed decisions. It employs classical algorithms including linear regression,
support vector machines, K-nearest neighbors, random forests, and gradient boosting to analyze global video
game sales, based on a dataset of 16,719 games from Kaggle as of December 22, 2020. The methodology
involves data preprocessing, feature selection, model evaluation, and hyperparameter tuning, resulting in a
streamlined multi-stage prediction process. A new feature selection method is introduced to improve accuracy,
while key features are given higher weights to boost performance. Utilizing Gradient Weighted Class
Activation Mapping, the results show that the gradient-boosted model surpasses others, delivering precise
sales predictions and insights for optimizing inventory, pricing, and marketing strategies. Future research may
enhance the model and adapt it for movie or music sales forecasting.
1 INTRODUCTION
In the contemporary digital age, the video game
industry has become a huge force that captures the
attention of millions of people around the world.
Video games have become an indispensable form of
entertainment and a booming industry in today's
digital age. With the advancement of technology and
wide popularity of gaming platforms, the video game
industry has shown exponential growth in recent
years. The global video game market continues to
expand, offering diverse gaming experiences to
players of all ages and backgrounds.
This study aims to delve deeper into the
multifaceted area of video game sales, exploring the
factors driving its fluctuations, emerging trends, and
implications for the future of the entertainment
industry. It also analyzes how different factors affect
consumers' purchasing decisions and how they
influence the game genres that dominate the market
at different times (Babb, 2013).
The prediction of video sales games, it is hoped to
identify patterns and predictors that will help
stakeholders in the industry make informed decisions
and strategize for future growth. Different factors
a
https://orcid.org/0009-0003-3503-3566
have significantly different weights on game sales. In
the impact of platform on global video game sales, the
authors found through their research that different
gaming platforms have a significant impact on global
video game sales. During the study period, Nintendo
Wii and Nintendo DS were the two bestselling
platforms, while Xbox 360, PlayStation 3 and PCs
were in the third tier. This suggests that the
characteristics and positioning of the platforms have
a significant impact on sales (Wei, 2020).
Additionally, the role of marketing and distribution
strategies in driving sales will be examined, along
with the challenges faced by the industry in an
increasingly competitive and rapidly evolving digital
marketplace.
In recent years, the field of Artificial Intelligence
(AI) and machine learning has made significant
progress with the emergence of various algorithms
such as random forests, decision trees and logistic
regression. These algorithms have been widely used
in many fields, including chemistry, biomedicine, and
finance (Artrith, 2021). In the business sector in
particular, AI has revolutionized the way businesses
operate by providing powerful predictive analytics
tools. For example, AI algorithms have been used to
Wu, K.
Machine Learning Models-Based Video Game Sales Prediction.
DOI: 10.5220/0013205800004568
In Proceedings of the 1st International Conference on E-commerce and Artificial Intelligence (ECAI 2024), pages 45-50
ISBN: 978-989-758-726-9
Copyright © 2025 by Paper published under CC license (CC BY-NC-ND 4.0)
45

predict stock prices, predict customer churn, and
optimize marketing strategies (K and V, 2021). By
utilizing advances in AI, it is possible to gain a deeper
understanding of decision-making factors and
improve the accuracy of the predictions. Considering
the complexity and uncertainty involved in predicting
video game sales, AI and machine learning offer
powerful solutions. Advanced algorithms can analyze
large amounts of data, identify patterns, and make
highly accurate predictions. For example, AI can take
into account historical sales data, market trends,
consumer behavior, and even social media sentiment
to predict future sales (Boone, 2019). By
incorporating AI into sales forecasting models,
companies can not only improve the accuracy of their
predictions, but also gain insight into what drives
sales so they can make data-driven decisions,
optimize their strategies, and ultimately boost profits.
Forecasting video game sales is critical, especially
in the context of a global economy facing a major
recession in the wake of the current outbreak.
Accurate sales forecasts can benefit consumers and
businesses in a variety of ways. For example, for
video game companies, by understanding future
trends, companies can adjust marketing strategies,
manage inventory, and optimize the timing of game
releases to maximize profits (Mello, 2009). In an
unstable economic environment, predicting sales
trends becomes even more critical, and accurate
forecasts can help companies quickly adapt to these
changes, mitigate risks, and seize opportunities.
This study aims to use several classical machine
learning algorithms, including linear regression
model, support vector machine model, K-nearest
neighbor model, random forest model and gradient
advancement model. A feasible predictive model is
built to forecast game sales by analyzing the main
features that affect video game sales and building a
feasible predictive model based on these determinants.
In the model evaluation stage, the performance of the
model is evaluated using Mean Absolute Error
(MAE), which is a powerful method for evaluating
models (Ya-jun, 2022). This study addresses the
problem of game sales prediction through classical
machine learning algorithms and feature importance
analysis methods to provide game developers and
publishers with more informed strategic decisions
and practical tools for predicting global sales of new
video games, enhanced inventory management,
pricing strategies, and advertising.
2 METHOD
2.1 Dataset Preparation
This section describes the main data sets needed to
build the model, and the eigenvalues contained in the
data sets, which are also the inputs needed to run the
model in later examples. The data set comes from the
data website Kaggle. This data covers the sales of
electronic games as of December 22, 2020, including
16,719 games from various game platforms, release
years, categories and regional sales.
Before analysis, it is necessary to ensure that the
data set is clean. Therefore, preprocessing technology
is adopted to improve the data set. Initially, a
thorough check is performed to identify and eliminate
any redundant rows in the dataset. Next, checking the
existence of missing values and use appropriate data
processing techniques to solve them. The variables
"name" and "genre" both have two missing values,
and since there are few missing values, it is decided
to delete the rows containing the missing values.
However, there are a lot of data in the variables,
and the possibility that these variables will have a
significant impact on game sales cannot be ruled out.
Therefore, the study decided to delete the rows
containing these missing values when building the
model to build the basic model.
In the preprocessing stage, rows containing
missing values are directly deleted in this model and
the resultant dataset is assigned to the new variables.
This method helps to identify the original dataset with
missing values for future development of more
complex models. Subsequently, the numeric
variables are analysed with descriptive statistics, use
one hot encoding approach to convert all features to
numeric data. A hot coding process involves
generating a different binary column for each variable.
If the value in the original column is associated with
a specific category, the value is assigned to 1;
Otherwise, it is assigned a value of 0.
2.2 Machine Learning Model-based
Prediction
This study used kernel density, Pearson correlation
coefficient, sklearn, evaluation metrics, and
hyperparametric grids in model establishment,
training and testing processes (Belete and Huchaiah,
2022). In the model evaluation phase, the Mean
Square Error (MAE) is used to evaluate the
performance of the model (Willmott, 2005)
ECAI 2024 - International Conference on E-commerce and Artificial Intelligence
46
During the model creation phase, Global_Sales is
used as the target variable for forecasting purposes.
This variable represents a numerical representation of
global sales. Secondly, this study adopted a
partitioning scheme, allocating 20% of the initial data
set to the test set in evaluating the validity of the
model and the remaining 80% to the training set in
training the model.
2.2.1 Linear Regression Model
This model assumes that the dependent variable is a
linear combination of the independent variables, plus
some random errors. In this study, Global_Sales is
used as the dependent variable and the median global
sales is calculated in the training set. This median is
then used as the predicted value for the baseline
model.
2.2.2 Support Vector Machine (SVM) Model
SVM is a supervised learning model for classification
and regression analysis. SVM classifies data into
different classes by finding an optimal hyperplane
with the aim of maximising the interval between the
two classes. For non-linear data, SVMs use a kernel
function to map the data to a higher dimensional
space, making it possible to find a linearly divisible
hyperplane in the higher dimensional space (Yue,
2003). In this paper, the parameters are as followed:
SVM-Kernel is radial, cost is 1, gamma is 0.25,
epsilon is 0.1, number of support Vectors is 3100
2.2.3 K- nearest Neighbor Model
KNN predicts the class or value of a new sample
based on a distance metric and determines the
outcome of the new sample by selecting the nearest K
neighbours in the sample space for classification or
regression. The KNN algorithm relies on a distance
metric to determine nearest neighbours. An important
feature of it is that it is very sensitive to the local
structure of the data, so it usually requires
normalisation of the data before use (Guo, 2003).
2.2.4 Random Forest Model
Random Forest is an integrated decision tree-based
learning method for classification and regression. It
obtains final predictions by constructing multiple
decision trees, making predictions on each tree, and
then regression or classification the results of all the
trees to obtain the final prediction. Random Forest
improves the generalisation ability and robustness of
the model by introducing randomness. In this study,
150 decision trees with a parameter of depth 1 are
used and their performance is evaluated based on test
data.
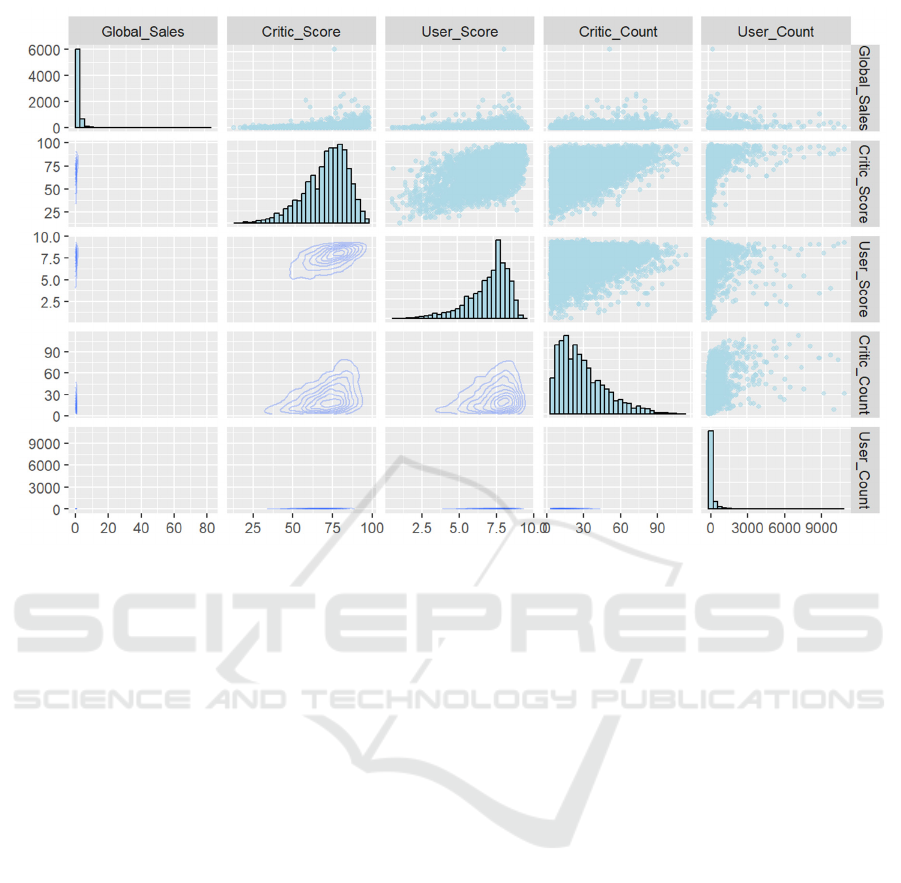
Figure 1: Scatter diagram, histogram and kernel density diagram between variables (Photo/Picture credit: Original).
Machine Learning Models-Based Video Game Sales Prediction
47
2.2.5 Gradient Boosting Model
Gradient Boosting is a boosting method for building
strong predictive models, typically for regression and
classification tasks. It does this by incrementally
adding weak learners (e.g., decision trees), each of
which attempts to correct the errors of the previous
learner. Gradient boosting optimises the model by
minimising the gradient of the loss function. In this
study, the residuals are computed to construct a new
learner to fit the residuals.
The model was updated where the proportions of
variables in the original GBM model were found to
be 42.00%, 35%, 22.20% and 0% and the optimised
proportions were 42.13%, 35.08%, 22.62% and 0.15%
respectively.
3 RESULTS AND DISCUSSION
Figure 1 reflects the relationship between global sales
and four variables. It can be found that critical count,
user count, critical score and user score have an
impact on global sales, but they are not significant,
and the highest correlation coefficient is only around.
Subsequently, the process of creating the model
begins. Firstly, this paper established a Mean
Absolute Error (MAE) function, which accepts two
parameters: the actual true value and the predicted
value. Then, the median of the target variable (global
sales) is calculated in the training set. This median is
then used as the predicted value of the baseline model.
Calculate the MAE of the baseline model on the test
set by using the previously constructed mean absolute
error function and baseline guess. The baseline guess
was determined as 0.29, and the MAE was calculated
as 0.686. In this particular scenario, the MAE
indicator indicates that the average difference
between the forecast made by the benchmark model
and the actual global sales is about 0.685.
In the following analysis, various simplified
models are compared by using different regression
techniques. This paper developed several models and
their performance on test data sets is evaluated by
calculating and displaying their MAE values shown
in Table 1. The models included in this study include
linear regression model, support vector machine
regression model, random forest regression model,
gradient regression model, K- nearest neighbor
regression model and ridge regression model. The
findings are as follows:
Table 1: Different model performance on test set.
Linear re
g
ression 0.733
Rid
g
e re
g
ression 0.731
Gradient enhanced re
g
ression 0.684
Random forest 0.680
K nearest neighbor regression 0.640
Support vector machine 0.592
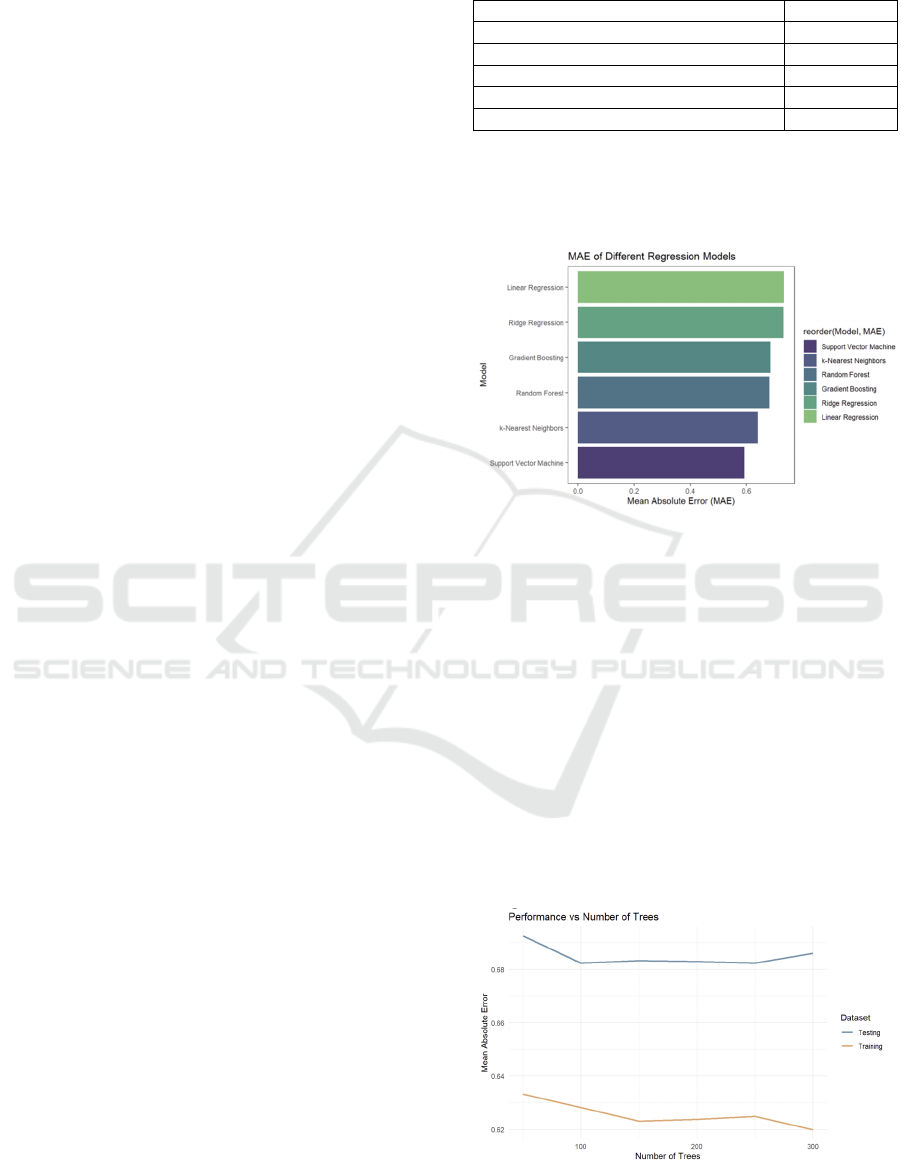
Next, the models are arranged based on the MAE
value, and the results are visualized by creating a bar
chart. This leads to the generation of Figure 2.
Figure 2: MAE value chart of each model (in order)
(Photo/Picture credit: Original).
Through the comparison of MAE, it is indicated
that the performance of the support vector machine
regression model is the best, and the MAE of the next
K- nearest neighbor regression model, random forest
regression model and gradient enhanced regression
model is also less than the baseline level, so it is
possible to build a superparametric grid for the
gradient propulsion model and carry out random
search to see if its performance can be improved. In
the next step, visually representing the grid search
results will be visualized, namely GridSearchCV
(Shuai, 2018). In addition, the influence of different
tree numbers on the MAE of the model was provided
in Figure 3.
Figure 3: Average absolute error of test and training based
on number of trees (Photo/Picture credit: Original).
ECAI 2024 - International Conference on E-commerce and Artificial Intelligence
48
The figure shows the evidence of over-fitting in
the model. The training error continues to decrease,
while the test error remains relatively stable. This
shows that the model is highly skilled in learning
from training examples but needs help in applying the
acquired knowledge to new and unfamiliar data. The
current model shows suboptimal performance.
However, this research will not change its structure,
but focus on solving the over-fitting problem in
advanced models by implementing input technology,
feature selection method and feature engineering
strategy.
The final model will determine the parameters as
150 decision trees with a depth of only 1 and evaluate
its performance according to the test data. The MAE
calculation results of the final model are as follows:
MAE = 0.685 > 0.684.
The average absolute error increases slightly,
which shows that over-fitting has a great influence on
the optimization model. The performance of the
model was not significantly improved by the
adjustment of hyperparameters. It is expected that
improving the over-fitting problem and then
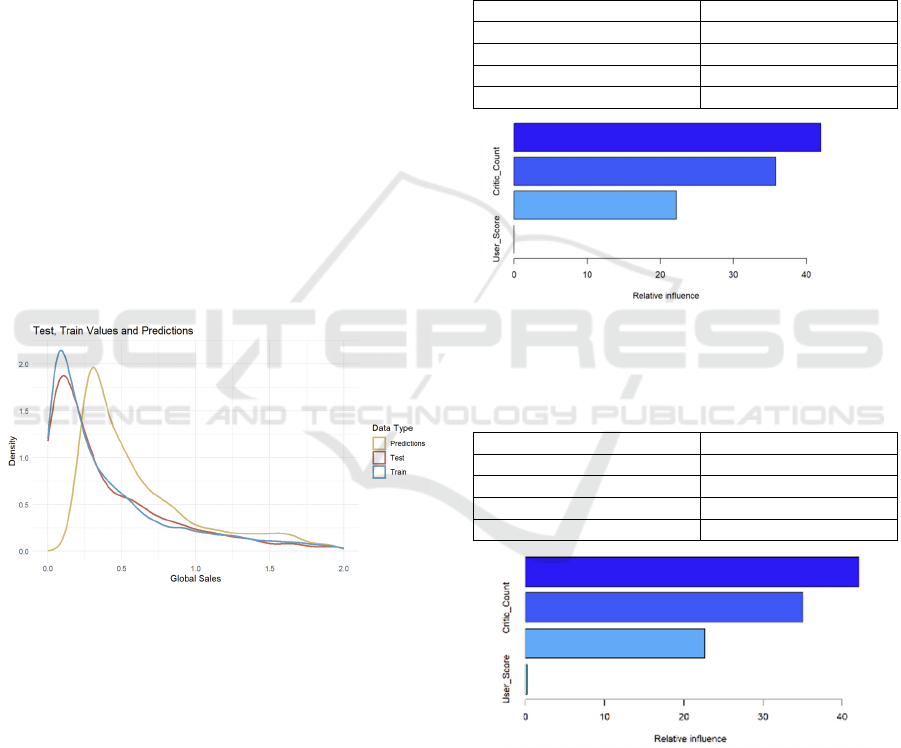
optimizing it may have better effect. Finally, the
training value, the test value and the predicted density
were compared, as shown in Figure 4.
Figure 4: Kernel Density of Three Groups of Data
(Photo/Picture credit: Original).
Since the MAE of the model after super-
parameter optimization has not decreased, this paper
speculates that it is because the model variables are
over-fitted, so this section want to further explore the
reasons for the model deterioration by observing the
coefficient ratio of the model. Table 2 and Table 3
provide parameter values of variables in the GBM
and optimized GBM model. Through observation, it
found that the proportions of variables in the original
GBM model were 42.00%, 35%, 22.20% and 0%
respectively shown in Figure 5, and the proportions
after optimization were 42.13%, 35.08%, 22.62% and
0.15% respectively shown in Figure 6. The original
proportion of user_score is 0, so it may be related to
other variables, which makes the model over-fitted. It
can be seen that the variable user_score should be
deleted in the follow-up study to make the model
better. In conclusion, using GBM model, the number
of users is the key factor of prediction, and the
number of comments and comments score also play
an important role. When optimizing the model, it
needs to focus on these variables to improve the
prediction performance.
Table 2: Parameter values of variables in GBM model.
va
r
rel.inf
User_Count 42.009
Critic_Count 35.791
Critic
_
Score 22.199
User
_
Score 0
Figure 5: Histogram of parameter values of variables in
GBM model (Photo/Picture credit: Original).
Table 3: Parameter values of each variable of the optimized
GBM.
va
r
rel.inf
User
_
Count 42.135
Critic_Count 35.089
Critic_Score 22.621
User_Score 0.153
Figure 6: Histogram of parameter values of each variable of
the optimized GBM (Photo/Picture credit: Original).
In short, the optimization of the model has not
changed the ranking of the good and bad models.
SVM model is the best, so the follow-up researchers
can refer to this model. In order to better show the
parameters of this model, this section outputs its
independent variable coefficients. In SVM model, the
Machine Learning Models-Based Video Game Sales Prediction
49

maximum coefficient of user count is 72.960,
followed by critic count of 27.320 and critic score of
22.993, and the minimum coefficient of user score is
6.397. In the use of SVM model, the number of users
is still the main factor of prediction, which is
consistent with GBM model. In these two models, the
number of users is always the most important
predictive variable, and the number of comments and
comment scores also play an important role.
Through the above conclusions, it can be helpful for
the future research on game sales.
4 CONCLUSIONS
This study developed a forecasting model to estimate
global video game sales. The research included data
preprocessing, feature selection, model selection,
evaluation, and hyperparameter tuning. Key factors
affecting sales were identified, including ratings,
platforms, genres, and publishers. Several models
were tested, with the gradient boosting model
performing best. The results provide valuable insights
for game developers and publishers, enabling better
strategic decisions. The developed model can predict
sales, enhancing inventory management, pricing
strategies, and marketing efforts. Future research can
further optimize the model and explore its application
in related fields like film or music sales prediction.
REFERENCES
Artrith, N., Butler, K. T., Coudert, F. X., Han, S., Isayev,
O., Jain, A., & Walsh, A. 2021. Best practices in
machine learning for chemistry. Nature
chemistry, 13(6), 505-508.
Babb, J., Terry, N., & Dana, K. 2013. The impact of
platform on global video game sales. The International
Business & Economics Research Journal (Online), 12
(10), 1273.
Belete, D. M., & Huchaiah, M. D. 2022. Grid search in
hyperparameter optimization of machine learning
models for prediction of HIV/AIDS test
results. International Journal of Computers and
Applications, 44(9), 875-886.
Boone, T., Ganeshan, R., Jain, A., & Sanders, N. R. 2019.
Forecasting sales in the supply chain: Consumer
analytics in the big data era. International journal of
forecasting, 35(1), 170-180.
Guo, G., Wang, H., Bell, D., Bi, Y., Greer, K. 2003. KNN
Model-Based Approach in Classification. In:
Meersman, R., Tari, Z., Schmidt, D.C. (eds) On The
Move to Meaningful Internet Systems 2003: CoopIS,
DOA, and ODBASE. OTM 2003. Lecture Notes in
Computer Science, vol 2888. Springer, Berlin,
Heidelberg.
Kaggle 2020, EDA-Video game sales,
https://www.kaggle.com/code/upadorprofzs/eda-
video-game-sales/input
Karthikeyan, C., Anandan, P., Prabha, R., Mohan, D., &
Babu, V. 2021. Predicting Stock Prices Using Machine
Learning Techniques. In 2021 6th International
Conference on Inventive Computation Technologies
(ICICT) (pp. 1-5). IEEE.
Mello, J. 2009. The impact of sales forecast game playing
on supply chains. Foresight, 13(13), 13-22.
Shuai, Y., Zheng, Y., & Huang, H. 2018, Hybrid software
obsolescence evaluation model based on PCA-SVM-
GridSearchCV. In 2018 IEEE 9th international
conference on software engineering and service science
(ICSESS) (pp. 449-453).
Wei, Y., Zhou, J., Wang, Y., Liu, Y., Liu, Q., Luo, J., ... &
Huang, L. 2020. A review of algorithm & hardware
design for AI-based biomedical applications. IEEE
transactions on biomedical circuits and systems, 14(2),
145-163.
Willmott, C. J., & Matsuura, K. 2005. Advantages of the
mean absolute error (MAE) over the root mean square
error (RMSE) in assessing average model
performance. Climate research, 30(1), 79-82.
Ya-jun, L. E. N. G., Zong-yu, W. U., Hao, S. H. I., & Peng-
fei, L. I. U. 2022. Comparison of Black-start Decision
Making Methods in the Power System
Restoration. Operations research and management
science, 31(7), 161.
Yue, S., Li, P., & Hao, P. 2003. SVM classification: Its
contents and challenges. Applied Mathematics-A
Journal of Chinese Universities, 18, 332-342.
ECAI 2024 - International Conference on E-commerce and Artificial Intelligence
50
