Sentiment Analysis with VADER and LM Using Linear Regression
for Stock Market Prediction
Xiaotong Luo
a
Shenzhen Audencia Financial Technology Institute, Shenzhen University, Shenzhen, China
Keywords: Sentiment Analysis, Stock Market Prediction.
Abstract: With the increasing popularity of stock trading, more and more researchers are focusing on stock prediction
with various machine-learning models. In addition, a growing number of individual investors prefer to share
their views on social media. As a result, market sentiment can influence the price of a stock. This paper is
going to talk about creating a model with two sentiment lexicons (VADER and LM) that is trained with a
linear regression algorithm and observing a relation between sentiment and real stock prices exists, especially
for some technology tickers. However, in this article, the Pearson correlation coefficient p-value of some
tickers is not statistically significant at a 95% confidence interval, which means the model do perform not
well in the whole dataset. The reason may be the limitations of the algorithm for splitting train and test data
or training models. Moving forward, the research intends to improve the method through feature engineering
and model selection in the future.
1 INTRODUCTION
Market sentiment is often derived from news articles,
social media posts, and financial reports. The
comments and tweets in public may affect the
behaviour of investors. Understanding the impact of
market sentiment on the stock price is worth doing,
particularly in the rapidly evolving financial markets.
If there are more positive tweets from a ticker, its
price may climb, which means the public is bullish on
this stock. Nonetheless, traditional financial analysis
methods primarily focus on historical data and
fundamental analysis. Although there are some
applications using machine learning algorithms to do
the prediction, they potentially overlook the effects of
sentiment.
This paper is about how to do a multimodal
analysis to predict the stock market. The study
integrates sentiment lexicons, Valence Aware
Dictionary and sEntiment Reasoner (VADER) and
Loughran-McDonald Master Dictionary (LM), with a
linear regression algorithm. Finally, the study
assesses the model’s performance by Mean squared
error (MSE) and Pearson correlation coefficient. For
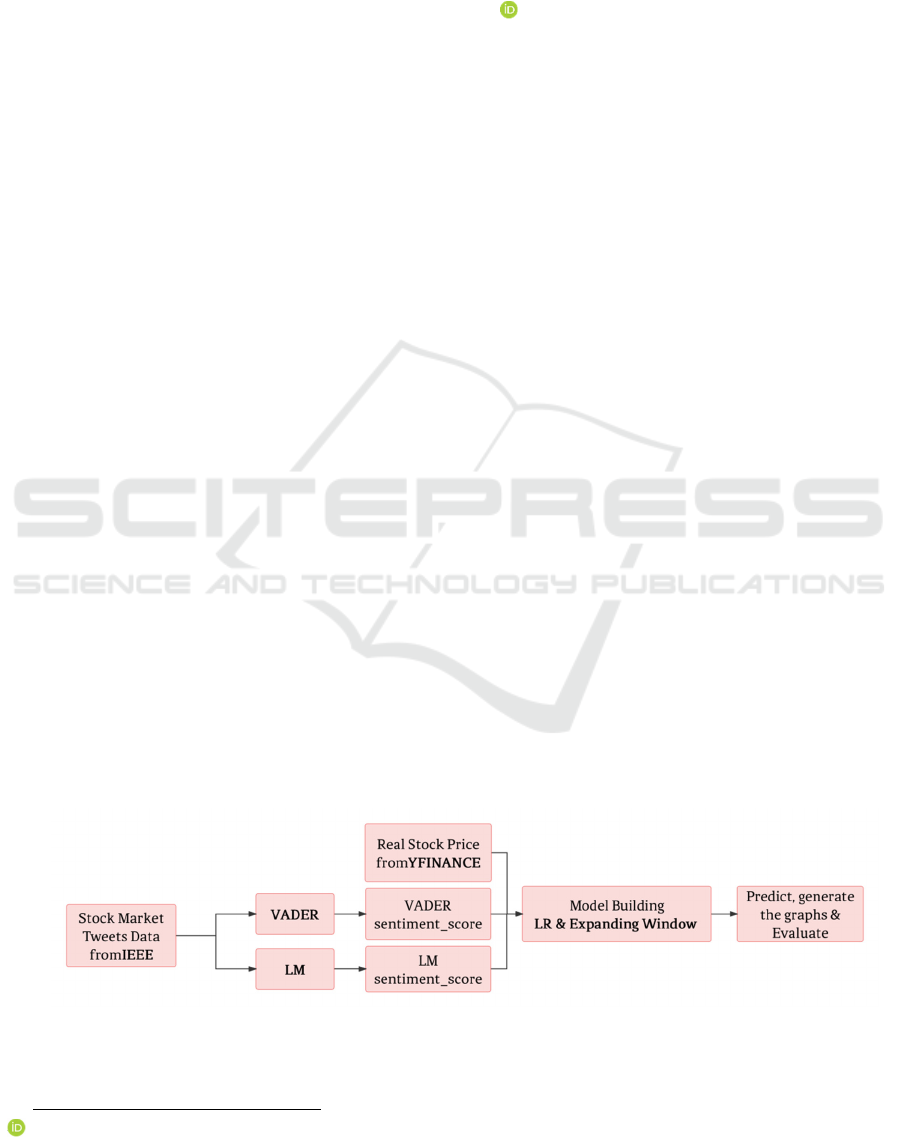
convenience, Figure 1 was drawn to represent the
research process.
Figure 1: The flow figure of the study
a
https://orcid.org/0009-0001-1810-7098
Luo, X.
Sentiment Analysis with VADER and LM Using Linear Regression for Stock Market Prediction.
DOI: 10.5220/0013205600004568
In Proceedings of the 1st International Conference on E-commerce and Artificial Intelligence (ECAI 2024), pages 33-38
ISBN: 978-989-758-726-9
Copyright © 2025 by Paper published under CC license (CC BY-NC-ND 4.0)
33

2 LITERATURE REVIEW
Based on this background, the research conducted a
literature review to understand what the previous
researchers had done on sentiment analysis and stock
market prediction.
2.1 Sentiment Analysis Tools
Traditional machine learning and deep learning
models are widely utilized in sentiment analysis (Tan
et al., 2023). Machine learning models, such as
Native Bayes, SVM, and Logistic Regression, are
straightforward to deploy and offer good
interpretability but may not perform well with some
complex text data. In terms of deep learning models
(CNN, RNN, LSTM, and GRU), they require
substantial data and computing resources.
Hutto and Gilbert (2014) introduced a rule-based
sentiment analysis model. They compared its
effectiveness to eleven typical state-of-practice
benchmarks, including LIWC, ANEW, the General
Inquirer, SentiWordNet, and machine learning
techniques based on Naive Bayes, Maximum
Entropy, and Support Vector Machine (SVM)
algorithms. Although it performs well in the social
media analysis, it also needs to be verified in the stock
market analysis.
Umar, Binji, and Balarabe (2024) overviewed
corpus-based approaches for sentiment analysis.
They suggested that there exist some limitations, like
data sparsity and context sensitivity, though this
model excels in handling complex language and
domain-specific data compared to dictionary-based
and rule-based methods.
2.2 Machine Learning and Stock
Prediction
Machine learning approaches are commonly
employed to stock price forecasting. Lumoring,
Chandra, and Gunawan (2023) conducted a
comparative study of various models, including SVM
and Random Forest, and emphasized that Long Short-
Term Memory (LSTM) is the most effective. Besides
the advanced machine learning models, the influence
of market sentiment should not be overlooked in
stock market predictions.
Furthermore, the widely renowned large language
model, ChatGPT, has achieved accuracy rates of 70%
for Microsoft and 63.88% for Google in predicting
stock trends (Mumtaz & Mumtaz, 2023). It is
noticeable that ChatGPT has not been trained for
stock market prediction and is limited only to
predicting trends.
2.3 Sentiment Analysis and Stock Market
Performance
More and more studies focus on the relationship
between sentiment analysis and stock market
performance. The researcher collected historical
stock market data for 10 major biotech companies and
utilized the VADER sentiment analysis tool in
conjunction with time series models for forecasting.
The study revealed a significant positive correlation
between a company’s sentiment scores and those of
its competitors (Avila, 2023).
It is found that current research lacks the
combination of sentiment analysis and stock price
prediction. This paper is going to introduce a more
comprehensive model that merges social media and
financial sentiment lexicons with a machine learning
model to forecast the stock market.
3 METHOD
3.1 Data Set
3.1.1 Stock Market Tweets Data
The study downloaded the Stock Market Tweets Data
from the IEEE (Taborda et al., 2021). This open-
access dataset collected 943,672 tweets created from
April 9 to July 16, 2020. It used Twitter tags
(#SPX500, #SP500, SPX500, SP500, $SPX, #stocks,
$MSFT, $AAPL, $AMZN, $FB, $BBRK.B,
$GOOG, $JNJ, $JPM, $V, $PG, $MA, $INTC
$UNH, $BAC, $T, $HD, $XOM, $DIS, $VZ, $KO,
$MRK, $CMCSA, $CVX, $PEP, and $PFE as search
parameters to collect the top 25 companies ticker
tweets in the S&P 500 index. There are two files in
this data set. One file includes 5,000 tweets, and out
of those 5,000 tweets, 1,300 were manually annotated
and reviewed by a second independent annotator.
Consequently, this article utilized unlabelled tweets
for ticker classification and predicted the trends of
each company in the model.
3.1.2 YFinance
Regarding the yfinance library, this paper
downloaded and normalised the historical stock price.
Through the expanding window algorithm, 20% data
was used to train the model at the beginning, and the
train set would expand, keeping the test set at 10%
ECAI 2024 - International Conference on E-commerce and Artificial Intelligence
34

length of the data. The last 10% was used to evaluate
the MSE of the method. Additionally, the research
conducted a correlation coefficient analysis between
sentiment signals and stock prices with the real stock
data from yfinance.
3.2 Data Processing
In terms of the data processing, an overview of the
tweets data set illustrates 923,673 rows and 2
columns. The information in the dataset includes
"Created_at" (the time when this tweet was created)
and "full_text" (the content of the tweet).
The next step is data cleansing. All the URLs and
mentioned information in the tweet were cleaned, the
English characters and stock tags were kept, and a
new column named "cleaned_tweet" was created to
store. Following that, the tweets were labelled with
tickers to get the sentiment score of each ticker later.
In the text preprocessing stage, the study applied
the NLTK library to define the stopwords and do the
tokenization, which means splitting the tweets into a
list of individual words.
3.3 Valence Aware Dictionary and
sEntiment Reasoner (VADER)
VADER (Hutto & Gilbert, 2014) is a lexicon
specially designed for analysing social media text.
This model looks up words in its sentiment lexicon,
sums their sentiment intensity scores, and computes
the initial sentiment intensity of a text on a scale from
-4 to 4.
As a rule-based dictionary, its 5 crucial rules and
heuristics are as follows:
Punctuation: The presence of an exclamation
point (!) in the text increments the sentiment score by
0.293.
Capitalization: If there is a capitalized character in
the emotion-related words, the model adds 0.733 to
the score.
Degree Modifiers: The model adjusts the score
according to different degree modifiers like
"extremely" and "marginally".
Contrastive Conjunction: The appearance of “but”
in the text signifies a shift in emotional polarity.
Negation Handling: If there is a negation, the
model will multiply -0.74 by the score.
Ultimately, the model normalises the score to a
range of -1 to 1 using the formula 1, where the α is
typically set to 15.
S
=
S
S
+ α
(1)
This research used the SentimentIntensity
Analyzer from NLTK to access sentiment scores
based on VADER and created a new column
(vader_sentiment_score).
3.4 Loughran-McDonald Master
Dictionary (LM)
“The Notre Dame Software Repository for
Accounting and Finance (SRAF) is a website
designed to provide a central repository for programs
and data used in accounting and finance research.
(Loughran & McDonald, 2024)” In this model, the
researchers used EDGAR 10-K files as a source of
business language and introduced a new list of
negative words, along with five other lists of words
that better reflect tone in financial texts (Loughran &
McDonald, 2011). Besides the classical categories
like positive, negative, and uncertainty, the LM
lexicon encompasses litigious, strong modal, weak
modal, and constraining columns.
The research separated the words within the LM
lexicon into positive and negative categories, scored
each tweet, and saved the sentiment score based on
LM.
3.5 Expanding Window
Due to the insufficient volume of data for each ticker,
the expanding window algorithm (Yang et al., 2022)
was employed to do the data splitting. Figure 2 shows
the principles of this approach. It starts with an initial
small window and adds a portion of new data to
increase the size of the training set gradually.
However, it keeps the test set at a fixed size. Given
that the interval of tweet data is about 3 months,
setting a small window size and step size allows for
timely capture of market fluctuations.
This study configured the window size and step
size to be 20% and 10% of the length of data,
respectively.
Sentiment Analysis with VADER and LM Using Linear Regression for Stock Market Prediction
35
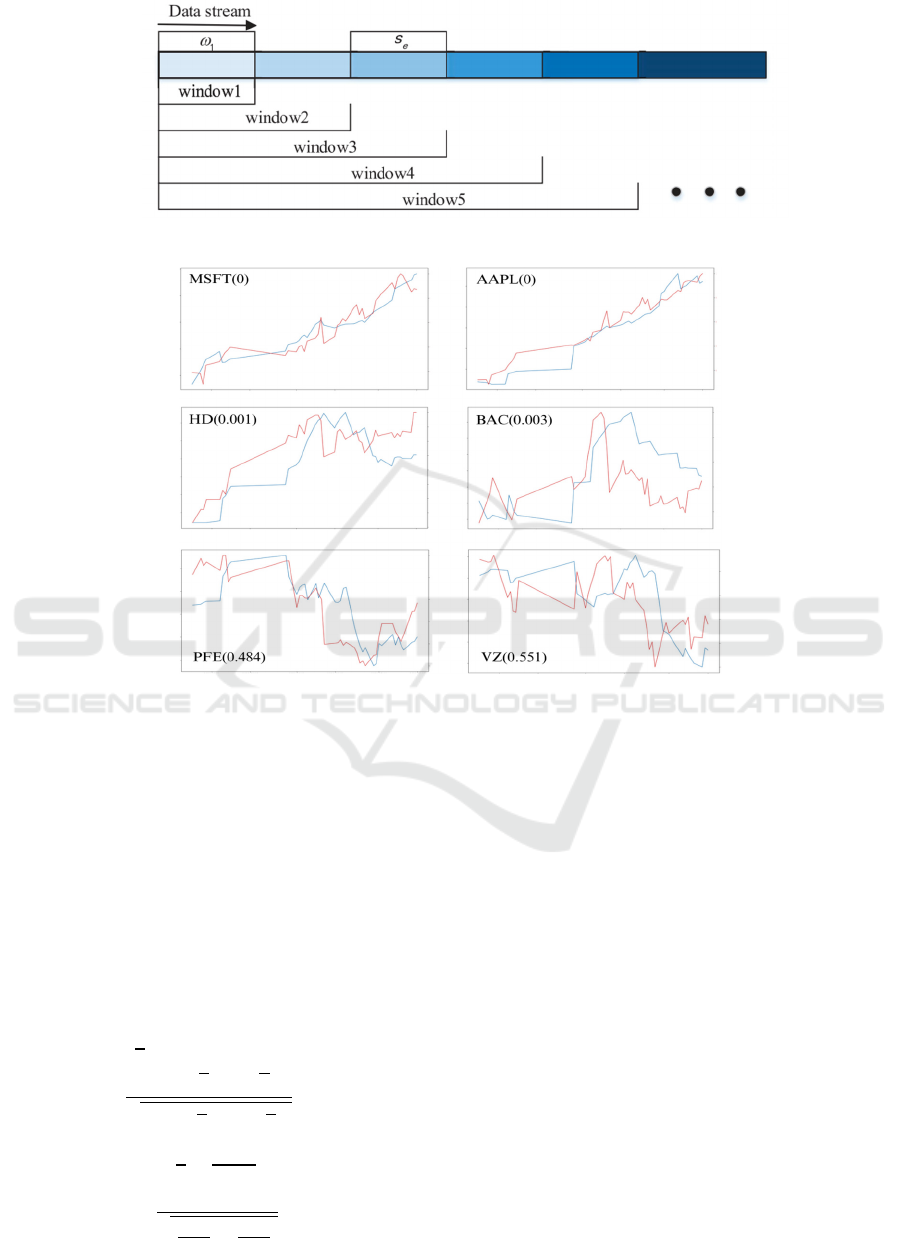
Figure 2: The principal of expanding window (Yang et al., 2022).
Figure 3: Six tickers sentiment signals VS normalised stock price.
𝑦
_
= 𝛽
+ 𝛽
𝑋
_
+ 𝛽
𝑋
_
+ 𝜀 (2)
3.6 Model Training and Evaluation
Following the data splitting, the model was trained
with linear regression, obtaining the parameters and
generating the sentiment signals (VADER and LM)
in comparison to normalised stock price comparisons.
The model was evaluated by MSE and Pearson
correlation coefficient (r). Additionally, the Fisher Z-
Transformation was applied to derive the Z-score and
corresponding p-value for statistical significance.
MSE =
1
n
y
y
(3)
r=
∑
X
X
Y
Y
∑
X
X
Y
Y
(4)
⎩
⎪
⎨
⎪
⎧
𝑍
=
1
2
𝑙𝑛
1+𝑟
1 𝑟
𝑍=
𝑍
𝑍
+
(5)
4 RESULTS
After implementing the methods mentioned above,
the study produced graphs depicting the relation
between sentiment signals and normalised stock
price, as well as the MSE and Pearson correlation p-
value of each ticker.
As for the comparison graphs, in this article, 2
tickers in each correlation level (high, medium, and
low) were selected to illustrate the varying degrees of
association between sentiment and stock price
movements.
In Fig. 3, The horizontal axis is time, and the blue
and red lines represent the sentiment signals and
normalised stock price of each ticker, respectively.
Some related results are shown in the following Table
1.
ECAI 2024 - International Conference on E-commerce and Artificial Intelligence
36

Table 1: Result MSE and correlation p-value table.
Ticker MSE Correlation P-Value Significant
MSFT 0.008 0 1
AAPL 0.009 0 1
AMZN 0.011 0 1
GOOG 0.021 0 1
DIS 0.146 0 1
CMCSA 0.098 0 1
MA 0.086 0 1
PG 0.121 0.001 1
KO 0.144 0.001 1
HD 0.056 0.001 1
BAC 0.128 0.003 1
XOM 0.077 0.004 1
INTC 0.086 0.004 1
CVX 0.07 0.018 1
JPM 0.118 0.061 0
PEP 0.055 0.12 0
UNH 0.08 0.142 0
V 0.097 0.324 0
PFE 0.073 0.484 0
VZ 0.093 0.551 0
JNJ 0.274 0.717 0
MRK 0.114 0.946 0
Due to some objective factors such as the change
of the ticker's name, the Table 1 illustrates the MSE
and correlation p-value of 22 tickers. As for the
SIGNIFICANT columns, a value of 1 is assigned if
the p-value < 0.05, indicating that the correlation is
statistically significant. This suggests that there is a
discernible correlation between sentiment signals and
stock prices, particularly for some technology
companies like Microsoft, Apple, Amazon, and
Google.
5 CONCLUSIONS
In summary, market sentiment can reflect the market
trend to some extent. Usually, the sentiment emerges
earlier and fades later than stock fluctuations. Only
employing conventional machine learning models
may not suffice to enhance the precision of stock
predictions. Also, integrating previous sentiment
analysis methods with other models is essential.
Furthermore, it is necessary to introduce a more
comprehensive framework to conduct stock forecasts
with sentiment analysis. This study demonstrates the
model’s efficacy in predicting certain technology
stocks when paired with VADER and LM sentiment
tools and trained with linear regression.
While most of the results obtained in this article
are statistically significant, there are several
limitations that should be addressed. As for the linear
regression model, the relationship between sentiment
and stock data may be nonlinear. Additionally, linear
regression is highly sensitive to outliers in the data,
especially in the multi-factor stock market. Regarding
Sentiment Analysis with VADER and LM Using Linear Regression for Stock Market Prediction
37

the expanding window algorithm, it may
overemphasise the early data and become less
responsive to recent changes as the influence of older
data points persists.
To enhance the accuracy and generalizability,
future research can be directed towards exploring the
following aspects: feature engineering and model
selection for enhancement. First, the study intends to
develop lagged features, smoothing out short-term
fluctuations and noise in time series data. Subsequent
investigations will delve into the application of word
embedding models such as Word2Vec to improve
contextual understanding. Secondly, the research will
embark on integrating more sophisticated machine
learning models like Random Forest or LSTM.
REFERENCES
Avila, C. S. R. (2023). Tweet Influence on Market Trends:
Analyzing the Impact of Social Media Sentiment on
Biotech Stocks. https://arxiv.org/pdf/2402.03353
Hutto, C. J., & Gilbert, E. (2014). VADER: a Parsimonious
Rule-Based Model for Sentiment Analysis of Social
Media Text. Proceedings of the International AAAI
Conference on Web and Social Media, 8(1), 216–225.
Loughran, T., & McDonald, B. (2011). When Is a Liability
Not a Liability? Textual Analysis, Dictionaries, and 10-
Ks. The Journal of Finance, 66(1), 35–65.
Loughran, T., & McDonald, B. (2024). Home // Software
Repository for Accounting and Finance // University of
Notre Dame. Software Repository for Accounting and
Finance. https://sraf.nd.edu/
Lumoring, N., Chandra, D., & Gunawan, A. A. S. (2023,
August 1). A Systematic Literature Review:
Forecasting Stock Price Using Machine Learning
Approach. IEEE Xplore.
Mumtaz, U., & Mumtaz, S. (2023). Potential of ChatGPT
in predicting stock market trends based on Twitter
Sentiment Analysis. ArXiv.org.
https://arxiv.org/abs/2311.06273
Taborda, B., de Almeida, A., Dias, J. C., Batista, F., &
Ribeiro, R. (2021). Stock Market Tweets Data. IEEE
Dataport.
Tan, K. L., Lee, C. P., & Lim, K. M. (2023). A Survey of
Sentiment Analysis: Approaches, Datasets, and Future
Research. Applied Sciences, 13(7), 4550.
Umar, M., Binji, H. I., & Balarabe, A. T. (2024). Corpus-
based Approaches for Sentiment Analysis: a Review.
Asian Journal of Research in Computer Science, 17(7),
95–102.
Yang, J., Shi, Z., & Ji, J. (2022). Design of Improved
Expanding-Window BATS Codes. IEEE Transactions
on Vehicular Technology, 71(3), 2874–2886.
ECAI 2024 - International Conference on E-commerce and Artificial Intelligence
38
