
Machine Learning for Smart Cities: LSTM Model-Based Taxi OD
Demand Forecasting in New York
Ziyan Chen
a
Information Management and System, Shanghai University, Jiading, Shanghai, China
Keywords: Taxi OD Demand Forecasting, LSTM Model, Machine Learning, Model Optimization.
Abstract: This study delves into the realm of advanced machine learning techniques, with a particular focus on
employing the Long Short-term Memory Network (LSTM) model for forecasting Taxi Origin-Destination
(OD) demand in New York City. In the quest for the most accurate predictive model, this paper conducted a
comparative analysis between the Decision Tree (DT), Random Forest (RF), and the aforementioned LSTM
model. The findings of this study reveal that the LSTM model outperforms its counterparts in both prediction
accuracy and generalization capability. The model's coefficient of determination (R²) stands at an impressive
0.9657, signifying that it captures a substantial 96.57% of the variance within the dataset. Through model
optimization, this study has further minimized the error index, highlighting the sensitivity of the model to its
configuration and the potential for enhanced performance. As looking towards the horizon, future research
endeavors will concentrate on overcoming current limitations and bolstering the robustness and applicability
of the LSTM model. The further study plans to extend its application to various urban settings and integrate
real-time data streams to augment its predictive prowess. Additionally, examining the model's efficacy in a
multi-modal traffic context and exploring the synthesis of LSTM with other machine learning algorithms to
forge hybrid models could lead to the development of more sophisticated and precise demand forecasting
tools. These advancements will be instrumental in facilitating smarter urban transport planning and
management, thereby revolutionizing the way approaching Taxi OD demand forecasting in the era of machine
learning.
1 INTRODUCTION
The progression of smart city development has
positioned the sophistication and efficacy of urban
transportation systems as key performance indicators
of urban advancement. In the vibrant epicenter of
global economic and cultural activity that is New
York City, the fine-tuning of its transportation
infrastructure is of utmost importance. Since the turn
of the decade, there has been a discernible downturn
in the prevalence of the iconic yellow taxis, while the
adoption of app-based ride-hailing services has
experienced a meteoric rise, culminating in a record
92.5 million passengers in 2016 (New York City
Government, 2017). This surge is mirrored by a
twofold increase in the registration of rental vehicles,
including both taxis and private car services, which
underscores the burgeoning demand for a multiplicity
of rental vehicle services. These data collectively
a
https://orcid.org/0009-0003-0792-9947
delineate a trend where the sharing economy and the
proliferation of mobile technology are propelling a
pronounced preference for the convenience and
efficiency of online ride-hailing services.
The forecasting of Taxi Origin-Destination (OD)
demand is a pivotal component of intelligent
transportation systems, tasked with the precision
prediction of taxi service demand at specific temporal
and spatial junctures. Traditional forecasting
methodologies have demonstrated efficacy in the
analysis of linear time series data but have
encountered limitations when confronted with the
intricacies of nonlinear relationships and the
amalgamation of multi-source datasets. The incursion
of machine learning into this domain has heralded a
new epoch of forecasting approaches. For instance,
Guo et al. adeptly harnessed the Gradient Boosting
Decision Tree (GBDT) model to predict future taxi
demand trends with considerable success (Guo and
Chen, Z.
Machine Learning for Smart Cities: LSTM Model-Based Taxi OD Demand Forecasting in New York.
DOI: 10.5220/0013205400004568
In Proceedings of the 1st International Conference on E-commerce and Artificial Intelligence (ECAI 2024), pages 27-32
ISBN: 978-989-758-726-9
Copyright © 2025 by Paper published under CC license (CC BY-NC-ND 4.0)
27

Shen, 2018). Similarly, Saadi et al. have integrated a
plethora of external factors (Saadi and Wang, 2017),
such as pricing and meteorological conditions, into
their predictive models, employing a diverse array of
algorithms including decision trees, ensemble
decision trees, and random forests. The foray of deep
learning into this realm has marked a significant leap
in forecasting capabilities due to their excellent
performance in many tasks (Lin, 2024; Wang, 2019).
Ke et al. have adeptly integrated deep learning with
machine learning techniques, employing Long Short-
Term Memory networks (LSTM) to encapsulate
temporal dependencies and Convolutional Neural
Networks (CNN) to model spatial correlations (Ke
and Zheng, 2017). Li has introduced Radial Basis
Function (RBF) neural network model, optimized via
quantum particle swarm optimization, which takes
into account an array of influencing factors such as
historical demand, traffic congestion indices, and
meteorological conditions (Li and Wen, 2018).
Despite these methodological advancements, the
ubiquitous challenge of reconciling supply and
demand in taxi services persists, adversely affecting
the operational efficiency of transportation systems
and the commuting experience of urban dwellers.
This paper aims to address this challenge by
conducting a comparative analysis of five distinct taxi
OD demand forecasting methodologies, utilizing data
analytics and machine learning algorithms, and
culminating in the identification of the LSTM model
as the most efficacious predictive instrument.
The rest of this paper is segmented into three
chapters, with the principal content of each chapter
delineated as follows: the method section details the
dataset and analytical methods; the results and
discussion section evaluate the performance of
Decision Tree (DT), LSTM, and random forest
models; and the conclusion reviews the research,
discusses limitations, and suggests future directions.
2 METHOD
2.1 Dataset Preparation
The dataset used in this study is sourced from the
Microsoft Azure Open Dataset. It encompasses a vast
collection of taxi trip records from 2009 to 2018,
totalling approximately 80 million entries
(TPSearchTool, 2022). Each entry is rich with details
such as precise latitude and longitude of pick-up and
drop-off locations, service dates and times, trip
distances, and fare amounts. The dataset's extensive
temporal and spatial coverage provides a
comprehensive view of taxi travel patterns in New
York City, offering valuable insights for urban
transportation planning and taxi service optimization.
The dataset includes several features such as Pickup
and Dropoff Latitude/Longitude, Passenger Count
and Payment Type.
The target variable for this study is the Taxi OD
demand, which is calculated by grouping data by start
and end points, demand date, and demand time, and
counting the number of orders from the same start
point to the same end point within the same hour.
This study also conducted a series of data
preprocessing steps on this dataset to ensure the
effectiveness of model training and the accuracy of
predictions. Initially, normalization was implemented
by applying the MinMaxScaler technique, which
scales the data to a range suitable for model training,
typically between 0 and 1. Following this, this paper
performed a train-test split, dividing the dataset into a
training set, which accounts for approximately 65%
of the total data, and a test set, comprising the
remaining 35%. This division is crucial for evaluating
the model's generalization capabilities. Additionally,
this study carried out data cleaning by filtering out
outliers based on geographical location and logical
inconsistencies within the data. For instance, records
with negative values for fare amount or passenger
count were identified and excluded to ensure the
quality and consistency of the dataset. Finally, to
reduce data dimensionality and facilitate model
training, K-Means clustering was employed. Using
this algorithm, this paper grouped the geographical
coordinates into seven distinct classes, streamlining
the data structure and enhancing the model's
efficiency in processing the information. This enables
model to predict Taxi OD demand more accurately
and provide robust data support for intelligent
transportation systems and urban planning.
The preprocessing steps were implemented using
Python, with libraries such as Pandas for data
manipulation, Scikit-learn for scaling and splitting the
dataset, and Matplotlib for visualization. Figures
illustrating the clustering results before and after
applying K-Means provide a visual representation of
the geographic distribution of taxi pick-up and drop-
off points. Figure 1 and Figure 2 below show the
location visualization after K-means clustering.
ECAI 2024 - International Conference on E-commerce and Artificial Intelligence
28
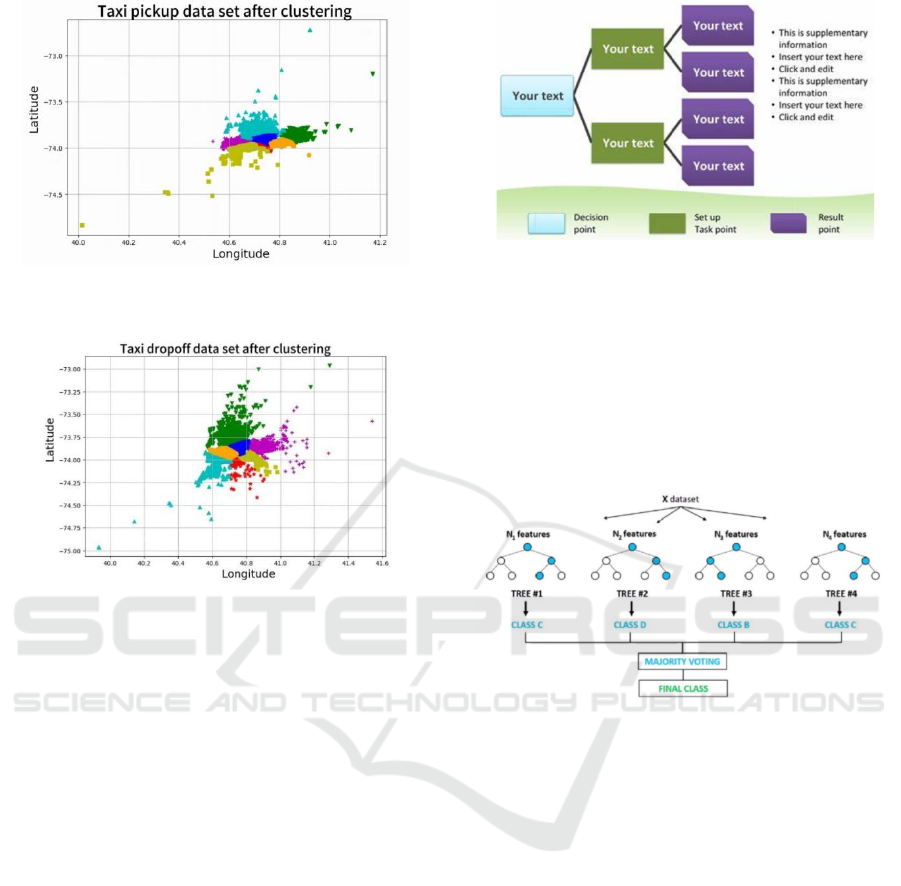
Figure 1: Distribution of taxi pick-up locations after
clustering (Photo/Picture credit : Original).
Figure 2: Distribution of taxi drop-off locations after
clustering (Photo/Picture credit : Original).
2.2 Machine Learning-based
Prediction
This study employed several machine learning
models to predict Taxi OD demand, including
Decision Trees, Random Forests, and Long Short-
Term Memory networks. The models were evaluated
using metrics such as Mean Squared Error (MSE),
Root Mean Squared Error (RMSE), and Mean
Absolute Error (MAE) to assess prediction accuracy
and generalization. The models were implemented
using popular machine learning libraries such as
Scikit-learn for DT and Random Forest (RF), and
TensorFlow for LSTM due to its capability to handle
complex neural network architectures.
Decision Trees shown in Figure 3 is an intuitive
and non-parametric supervised learning method used
for both classification and regression. It splits the
dataset into homogenous subsets recursively, creating
a tree-like model of decisions. The core principle of
DT is to partition the data space into regions that are
as pure as possible with respect to the target variable.
Figure 3: Schematic diagram of Decision tree
(TPSearchTool, 2022).
Random Forests shown in Figure 4 is an ensemble
learning method that constructs multiple DTs and
merges them to improve prediction accuracy and
control overfitting. RF reduces the variance of the
model by averaging the predictions of multiple trees,
each trained on a different subset of the data.
Figure 4: Schematic diagram of random forest algorithm
(Lee, 2020).
Long Short-term Memory network shown in
Figure 5 is a type of recurrent neural network (RNN)
capable of learning long-term dependencies. It is
particularly suited for time series prediction and tasks
requiring the memory of information over extended
periods. Critical LSTM hyperparameters
include units for the number of neurons in the LSTM
layer, batch_size for the number of samples per
gradient update, and epochs for the number of times
the training dataset is fed forward and backward
through the neural network.
Machine Learning for Smart Cities: LSTM Model-Based Taxi OD Demand Forecasting in New York
29
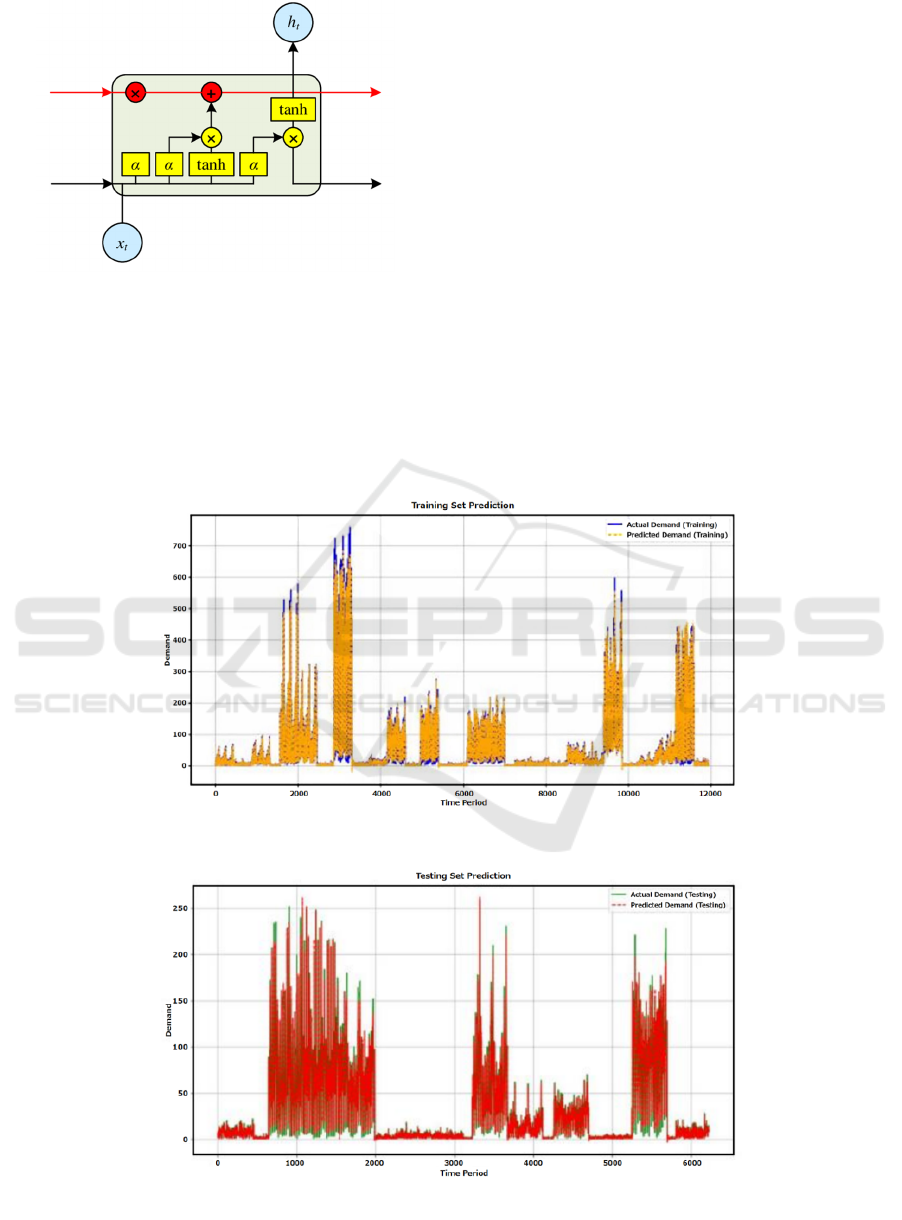
Figure 5: Schematic diagram of Long Short-term Memory
network (Wang, 2024).
The paper specifies a single LSTM layer in the
model architecture. The LSTM layer is configured
with four neurons, which are designed to capture the
long-term dependencies within the time series data.
LSTM layers use the hyperbolic tangent or a similar
function for the cell state activation. The output layer,
which is a Dense layer with a single output
dimension, likely uses a linear activation function
since this is a regression task. The model was
compiled using the MSE loss function, which is
standard for regression problems. The Adam
optimization algorithm was chosen for training the
LSTM model. Adam is known for its effectiveness in
handling different kinds of optimization problems
and is widely used due to its adaptive learning rate
properties. The model underwent 50 epochs of
iterative training. Each epoch processes the entire
dataset once.
Figure 6: Fitting effect of LSTM model on training set (Photo/Picture credit : Original).
Figure 7: Fitting effect of LSTM model on test set (Photo/Picture credit : Original).
ECAI 2024 - International Conference on E-commerce and Artificial Intelligence
30

3 RESULTS AND DISCUSSION
The results of this study offer compelling insights into
the predictive capabilities of the LSTM model for
forecasting taxi OD demand in New York City. The
model's performance was rigorously evaluated
through a series of metrics, including MSE, RMSE,
and MAE. The LSTM model demonstrated
outstanding precision, with an MSE of 340.94, an
RMSE of 18.46, and an MAE of 9.46%. These results
were graphically represented in Figure 6 and Figure
7, which illustrate the model's fitting effects on both
the training and testing datasets, respectively.
The determination coefficient (R²) of the LSTM
model was calculated to be 0.9657, indicating that the
model accounts for approximately 96.57% of the
variance in taxi OD demand. This high R² value
underscores the model's proficiency in capturing the
complex spatiotemporal dynamics inherent in the
data. The LSTM model's superior performance over
the DT and RF models is evident when comparing the
evaluation metrics. The DT model reported an MSE
of 6857.76, an RMSE of 82.81, and an MAE of
50.67%, while the RF model showed an MSE of
6280.10, an RMSE of 79.25, and an MAE of 48.59%.
The LSTM model's significantly lower error metrics
suggest its enhanced ability to model the intricate
patterns of taxi demand.
The LSTM model's success can be attributed to its
architecture, which is adept at uncovering long-term
dependencies within the data. This is particularly
beneficial in the context of taxi demand forecasting,
where understanding patterns that extend over
extended periods is crucial. The model's ability to
learn from historical data and adapt to the temporal
dynamics of demand is a key factor in its predictive
accuracy. The discussion for drawbacks of decision
tree and random forest.
In optimizing the LSTM model, adjustments to
the hyperparameters, such as the sliding window size
and the number of iterations, were made. The first
optimization increased the number of iterations to
100, resulting in a stable model loss and no significant
changes in performance metrics. The second
optimization adjusted the sliding window to 450,
leading to a slight decrease in MSE, RMSE, and
MAE, and a final model loss of 6.1441e-04. These
adjustments highlight the model's sensitivity to its
configuration and the potential for further refinement.
Table 1 shows the complete results.
Table 1: OD demand prediction results of different models.
Method MSE RMSE MAE
DT 357.76 19.81 13.63
RF 373.52 26.25 7.43
LSTM 340.94 18.46 9.46
While this study focuses on the application of the
LSTM model to taxi OD demand in New York City,
it is worth noting the broader context of demand
forecasting research. Traditional methods, such as
time series analysis, have been eclipsed by machine
learning approaches, which offer more nuanced
predictions. The LSTM model's performance in this
study aligns with the growing body of literature that
supports the use of deep learning for time series
forecasting, particularly in the transportation sector.
The LSTM model is superior to RF and DT, possibly
because LSTM, as a deep learning model, is able to
capture long-term dependencies in time series data,
with which OD demand prediction is often correlated.
This ability of the LSTM model may allow it to more
accurately capture trends in the data when making
predictions, thus performing better on the average
absolute error. If there are large outliers in the
prediction error, MSE and RMSE will be greatly
affected because they calculate the square or square
root of the error. The sensitivity of MAE to outliers is
low. Also, LSTM may overfit during training, which
will also result in lower performance on the test set
than RF and DT.
The findings of this study lead to the conclusion
that the LSTM model is a robust tool for predicting
taxi OD demand. Its high R² value and low error
metrics indicate a strong correlation between the
model's predictions and actual demand patterns. The
model's ability to generalize, as evidenced by its
performance on the test dataset, suggests that it can
be effectively applied to other cities and traffic
scenarios with potential adjustments.
Future research should consider expanding the
LSTM model's application to diverse urban
environments and integrating real-time data streams
for enhanced predictive power. Additionally,
exploring the model's performance in a multi-modal
transportation context could provide a more
comprehensive understanding of urban mobility
patterns. The integration of real-time data sources,
such as traffic flow monitoring, weather changes, and
major events, could further enhance the model's
adaptability and accuracy in dynamic traffic
conditions. Moreover, the potential for combining the
LSTM model with other machine learning algorithms
to create hybrid models should not be overlooked.
Machine Learning for Smart Cities: LSTM Model-Based Taxi OD Demand Forecasting in New York
31

Such hybrid models could leverage the strengths of
multiple algorithms to improve predictive
performance. The exploration of these avenues could
pave the way for more sophisticated and accurate
demand forecasting tools that can support smarter
urban transportation planning and management.
4 CONCLUSIONS
In conclusion, this study effectively harnesses the
power of the LSTM model to predict the Origin-
Destination demand for taxis in New York City,
presenting a notable contribution to the field of urban
transportation planning. The primary methodology
used in this study encompasses the utilization of
sophisticated data analytics techniques and machine
learning algorithms, culminating in the development
of an LSTM model that surpasses other models in
terms of predictive accuracy and generalization
capability. The results not only validate the LSTM
model's superior predictive prowess but also highlight
its ability to capture intricate demand patterns, as
evidenced by a high R² of 0.9657.
While the study has made significant strides, it
also acknowledges the limitations that accompany
such an advanced model. Among these is the model's
sensitivity to hyperparameter tuning, which can be a
complex process requiring extensive computational
resources and expertise. Additionally, the model's
performance is contingent upon access to large
volumes of high-quality historical data, which may
not always be readily available or up-to-date. In the
future, efforts will be directed towards improving the
model's generalizability, enabling it to perform
effectively across a variety of urban settings with
diverse traffic patterns and characteristics. This will
involve testing the model in different cities and under
various traffic conditions to ensure its predictions
remain reliable and accurate.
REFERENCES
Guo, X., & Shen, Y. 2018. Demand prediction of e-taxi
based on gradient lifting regression tree [In Chinese]. In
Proceedings of the 2018 World Transport Congress (pp.
310-320). Beijing, China.
Ke, J., Zheng, H., Yang, H., et al. 2017. Short-term
forecasting of passenger demand under on-demand ride
services: A spatio-temporal deep learning approach.
Transportation Research Part C: Emerging
Technologies, 85, 591-608.
Lee, K., Claridades, A. R. C., & Lee, J. 2020. Improving a
street-based geocoding algorithm using machine
learning techniques. Applied Sciences, 10(16), 5628.
Li, J., Wen, H., Lin, L., et al. 2018. Prediction model of car-
hailing demand based on QPSO_RBF Neural Network
[In Chinese]. Journal of Guangxi University (Natural
Science Edition), 43(2), 272-281.
Lin, Z., Zhu, G., Deng, Y., Chen, X., Gao, Y., Huang, K.,
& Fang, Y. 2024. Efficient parallel split learning over
resource-constrained wireless edge networks. IEEE
Transactions on Mobile Computing.
New York City Government. 2017. New York City
Mobility Report.
Saadi, I., Wong, M., Farooq, B., et al. 2017. An
investigation into machine learning approaches for
forecasting spatio-temporal demand in ride-hailing
service. arXiv preprint arXiv:1703.02433.
TPSearchTool. 2022. How to make a decision tree in Excel:
A free template decision tree images. Retrieved August
7, 2024, from https://www.tpsearchtool.com/
images/how-to-make-a-decision-tree-in-excel-a-free-
template-decision-tree
Wang, F., Casalino, L. P., & Khullar, D. 2019. Deep
learning in medicine—promise, progress, and
challenges. JAMA internal medicine, 179(3), 293-294.
Wang, J. 2024. Study on the influencing factors of the
development of art education in colleges and
universities based on the deep learning model. Applied
Mathematics and Nonlinear Sciences.
ECAI 2024 - International Conference on E-commerce and Artificial Intelligence
32
