
A Comparison Between Arima and Ann Models for Guntur Red
Chillies Price Forecasting
P Soumya
1,* a
and M Srikala
2b
1
Institute of Agribusiness Management, S V Agricultural College, ANGRAU, Tirupati, India
2
Department of Agricultural Economics, S V Agricultural College, ANGRAU, Tirupati, India
Keywords: Chilli, Non-Linearity, ARIMA, ANN, RMSE.
Abstract: Red chillies is one of the most important spices produced in Andhra Pradesh. Guntur APMC is the major
market that trades red chillies in Andhra Pradesh. The current study is an attempt to forecast red chilli prices
in Guntur market. In this study secondary data were used for the purpose of analysis. The price data of red
chillies for a period of 10 years were obtained from APMC, Guntur. Training data from July 2013 to December
2022 and testing data from January 2023 to June 2023 was considered for the purpose of study. The red chilli
prices of Guntur were forecasted by employing Autoregressive Integrated Moving Average (ARIMA) and
Artificial Neural Network (ANN) models. The data analysis software R is used for modelling and forecasting
Guntur red chilli prices. The results revealed the superiority of ANN models over ARIMA due to presence of
non-linearity in the data. Government should take steps to provide accurate forecasted chilli price data to
farmers which result in better price realization by farmers. Government should also frame trade policies in
such a way that the country can be benefited through trade by comparing prices of commodity in our country
with other countries.
1 INTRODUCTION
Chilli is one of the oldest spices used in almost every
cuisine in the world (Sarojam et al., 2020). Red chilli
is produced and exported most frequently in the globe
by India (Swami et al., 2022). Indian chilli is highly
preferred by other countries because of its colour,
quality and pungency (Deepthi & Kumar, 2020; Gade
et al., 2020). It is one of the most important
commercial crops that is being cultivated in India. In
the year 2021-22, 18.36 lakh tonnes of red chilli were
produced in an area 8.8 lakh ha. in our country. Major
chilli producing states in India are Andhra Pradesh,
Telangana, Madhya Pradesh, Karnataka and Orissa.
These states contribute nearly 90 per cent of chilli
production in India. Though the area under chilli crop
is largest in Andhra Pradesh, production of chilli crop
is highest in Telangana due to highest productivity
(4.15 t/ha) of the crop in that state (Spices Board of
India, 2022).
Guntur market, which is reputed as Asia’s biggest
red chilli market draws in produce from throughout
a
https://orcid.org/0000-0002-1759-0225
b
https://orcid.org/0000-0003-3797-2770
the state as well as international purchasers. During
peak season lakhs of farmers flood to the Guntur
market to sell their produce. The chilli farmers have
to sell their produce in Guntur market through e-
National Agriculture Market (e-NAM) only. The
trading of produce through e-NAM influence the
costs and returns of farmers (Malleswari et al., 2023).
Though the market yard consists of well-equipped
quality assaying laboratory, it is practically
impossible to test produce of each and every farmer
as the number of farmers coming to market to sell
their produce are very high. The place in the market
yard is also not sufficient for formation of lots. The
lots may be drenched during rainy season. All these
problems resulted in decreased efficiency in
marketing of chillies through e-NAM.
In general, price of an agricultural commodity
influenced by quantity of arrivals. These prices
fluctuate more when compared to other commodities
due to presence of non-linearity and non-stationarity
of data (Vijay & Mishra, 2018; Sun et al., 2023). So,
there is presence of risk and uncertainty while
Soumya, P. and Srikala, M.
A Comparison Between Arima and Ann Models for Guntur Red Chillies Price Forecasting.
DOI: 10.5220/0012883900004519
Paper published under CC license (CC BY-NC-ND 4.0)
In Proceedings of the 1st International Conference on Emerging Innovations for Sustainable Agriculture (ICEISA 2024), pages 137-142
ISBN: 978-989-758-714-6
Proceedings Copyright © 2025 by SCITEPRESS – Science and Technology Publications, Lda.
137

forecasting prices of these agricultural commodities
(Naveena et al., 2017). This affects the policies on
price stabilization of agricultural commodities that
are framed by the government. This in turn result in
loss to the society as well as to the economy of the
country (Prasetyo et al., 2023).
Accurate price forecasting of agricultural
commodities is vital issue that need to be addressed
at present. The importance of price forecasting of
agricultural commodities increased recently due to
increased price volatility (Rathod et al., 2017). In
general, price volatility is high for vegetables but
recently volatility of commercial crops has also
increased which in turn increase the need for accurate
model for price forecasting.
The time series forecasting of agricultural
commodities plays a vital role for sustainability of
economy for developing countries as the economy of
these countries depend on agriculture. The
agricultural prices are influenced by many factors
such as weather, pests and diseases, political changes
etc. The accuracy of a model can be increased if we
include all these factors in the forecasting model but
in the current study, the forecasting model is built by
using only the past price data of the commodity. The
primary goal of present study is to assess the
forecasting ability of ARIMA and ANN models.
The objectives of the current study are
1. To forecast the red chilli prices in Guntur Market
using ARIMA and ANN models
2. To compare the accuracy of both the models
2 MATERIALS AND METHODS
In the current study, secondary data were used for the
purpose of analysis. The price data of red chillies
were obtained from market yard of Guntur. Monthly
price data for a period of 10 years were used for
analysis. Of which data from July 2013 to December
2022 were used to derive Autoregressive Integrated
Moving Average and Artificial Neural Network
models. Chilli prices from January 2023 to June 2023
were forecasted using these models and the forecasted
data were compared with actual prices of red chillies.
The data analysis software R is used for modelling
and forecasting of red chilli prices in Guntur market.
2.1 Autoregressive Integrated Moving
Average (ARIMA) Model
ARIMA is one of the classical techniques for non-
stationary analysis. ARIMA models can be described
with historical or lagged values and random error
terms. ARIMA models are also known as a family of
mixed models. The forecasting process more
complicated in mixed models but they result in
accurate predictions. A pure model is nothing more
than a model that has only AR or MA components but
not both. The integration term (I) is the inverse
process of variance and is used to generate estimates.
ARIMA model stands for ARIMA (p d q). The
ARIMA model is shown as follows;
∅(𝐵)(1−𝐵)
𝑑
𝑌
𝑡
= 𝜃(𝐵)𝜀
𝑡
(1)
𝑌
𝑡
= ∅
1
𝑌
𝑡
−1
+ ∅
2
𝑌
𝑡
−2
+ ⋯ + ∅
𝑝
𝑌
𝑡
−
𝑝
+ 𝜀
𝑡
−𝜃
1
𝜀
𝑡
−1
−
𝜃
2
𝜀
𝑡
−2
− ⋯ − 𝜃
𝑞
𝜀
𝑡
−
𝑞
(2)
The model parameters are ∅𝑖 and θj; the time
series is denoted by 𝑌𝑡, random error is represented
by 𝜀𝑡, the number of autoregressive terms is p, the
number of moving terms is q, and the backshift
operator is B such that, 𝐵𝑌
𝑡
=𝑌
𝑡
−1
(Box & Jenkins
1994; Brockwell & Davis, 1996). In the past, all types
of data were exclusively analysed with the ARIMA
model. However, as analytical software has
advanced, a plethora of new methodologies have
emerged that have aided in precise prediction
(Abdulali & Masseran, 2021).
2.2 Artificial Neural Network (ANN)
ANN functions just like central nervous system of
brain. It's the machine learning technology that's been
employed the most in recent years. ANN is often
called as regressive neural network because it uses
independent observations as inputs (Varshney &
Srivastava, 2023). The framework for ANN can be
modelled mathematically using neural network as
well as physical parameters. The general expression
of the final output Y
t
of the multi-layer feed forward
autoregressive neural network is as follows;
𝑌
=𝛼
+
∑
𝛼
𝑔𝛽
+
∑
𝛽
+𝑌
+ 𝜀
(3)
where, 𝛼
𝑗
(𝑗 = 0,1,2, … , 𝑞) and 𝛽
𝑖𝑗
(𝑖 = 0,1,2, … , 𝑝, 𝑗
= 0,1,2, . . . , 𝑞) are the model parameters, also called
as the synopsis weights, p is the number of input
nodes, q is the number of hidden nodes and 𝑔 is the
activation function. The difference between real and
anticipated values is lessened with ANN training. The
following is the autoregressive ANN's error function.
𝐸=
∑
𝑒
(4)
ICEISA 2024 - International Conference on ‘Emerging Innovations for Sustainable Agriculture: Leveraging the potential of Digital
Innovations by the Farmers, Agri-tech Startups and Agribusiness Enterprises in Agricu
138
𝐸=
∑
𝑋
𝑤
+
∑
𝑤
𝑔𝑤
+
∑
𝑤
𝑋
(5)
where, N represented total number of residual terms.
The parameters of the neural network w
ij
change
when changes occur in Δw
ij
as Δw
ij
= −η𝜕𝐸/𝜕w
ij
,
where, η represented learning rate.
2.3 Testing Accuracy of the Model
The accuracy of the model used for forecasting is
tested with the help of a measure, Mean Absolute
Percentage Error (MAPE). MAPE is simple average
of absolute percentage errors. It is a relative measure
that uses absolute values. It is represented as follows
MAPE =
∑
100 (6)
Where d
j
means the actual value of j, y
j
represented
forecasted value and n represented total number of
observations.
Lewis (1982) has categorised the accuracy of
forecasting model based on MAPE. If MAPE is ≤
10% then the accuracy of model considered to be
excellent, if it is in the range of 10% to 19% then the
model is good and if the range is in between 20% and
49% then the model reasonable. If the value of MAPE
is more than 50% then the model is considered as not
accurate.
3 RESULTS AND DISCUSSION
The data set of Guntur red chilli prices from July 2013
to December 2022 was used for the purpose of
building the model and from January 2023 to June
2023 was used for checking the validation of the
model.
3.1 Price Movement of Dry Chillies in
Guntur Market
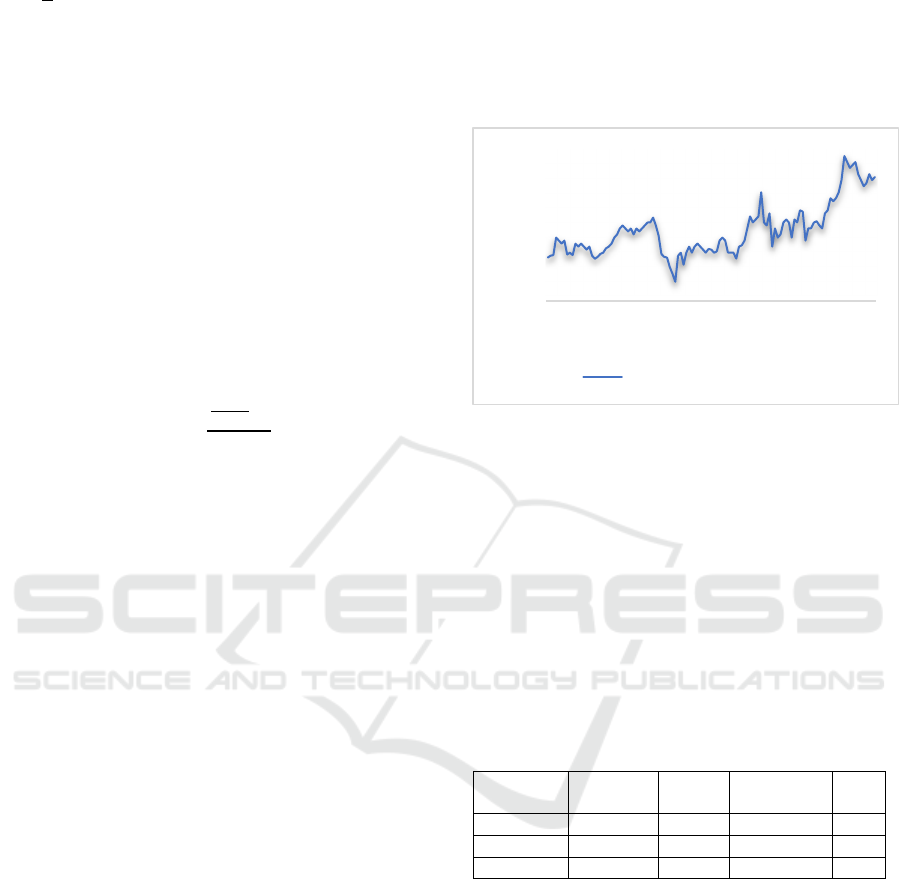
Chilli prices obtained from Guntur market for the
period from July 2013 to June 2023 and found to be
varied from Rs.7300 in 2013 (July) to Rs. 20500 in
2023 (June). In the span of 10 years chilli prices have
increased more than double in the Guntur market. The
average price recorded for the period from 2006 to
2016 was Rs. 11637 and in that period the prices of
chilli per quintal was at its minimum in June 2017 i.e.,
Rs. 3200 and maximum price was realized in July of
2022 i.e., Rs. 24000 which was presented in Figure 1.
It can be clearly observed from the graph that prices
of chilli in Guntur market yard are increasing over the
years. The maximum price in the year 2022 is because
failure of crop due to black thrip infestation.
Figure 1: Time series data of red chilli prices in Guntur
market
3.2 ARIMA Model Building
ARIMA model is built in statistical software R with
the help of tseries and forecast packages. The best
ARIMA model is ARIMA (2,1,1) out of all the
models. The parameters pertaining to this model are
tabulated and represented in Table 1. The coefficients
of all the parameters in ARIMA model are found to
be significant at 1 per cent probability level.
Table 1: Estimation of parameter for ARIMA (2,1,1) model
for Guntur red chilli prices
Estimate Std.
Error
Z value Sig.
AR Lag 1 -1.1103 0.1019 -10.8899 0.00
AR Lag 2 -0.2797 0.0923 -3.0309 0.00
MA La
g
1 0.9579 0.0623 15.3694 0.00
The ARIMA model is best model if the data is
linear. But if the data is non-linear then this model is
not suitable. So, with the help of Brock, Dechert and
Scheinkman (BDS) test the non-linearity of data is
checked. The results of the BDS test were presented
in Table 2. Non-linearity checked for both 2 and 3
dimensions. The results reveal that data is non-linear
in nature.
0
5000
10000
15000
20000
25000
2013
2014
2015
2016
2017
2018
2019
2020
2021
2022
2023
Red chilli prices in Rs.
A Comparison Between Arima and Ann Models for Guntur Red Chillies Price Forecasting
139
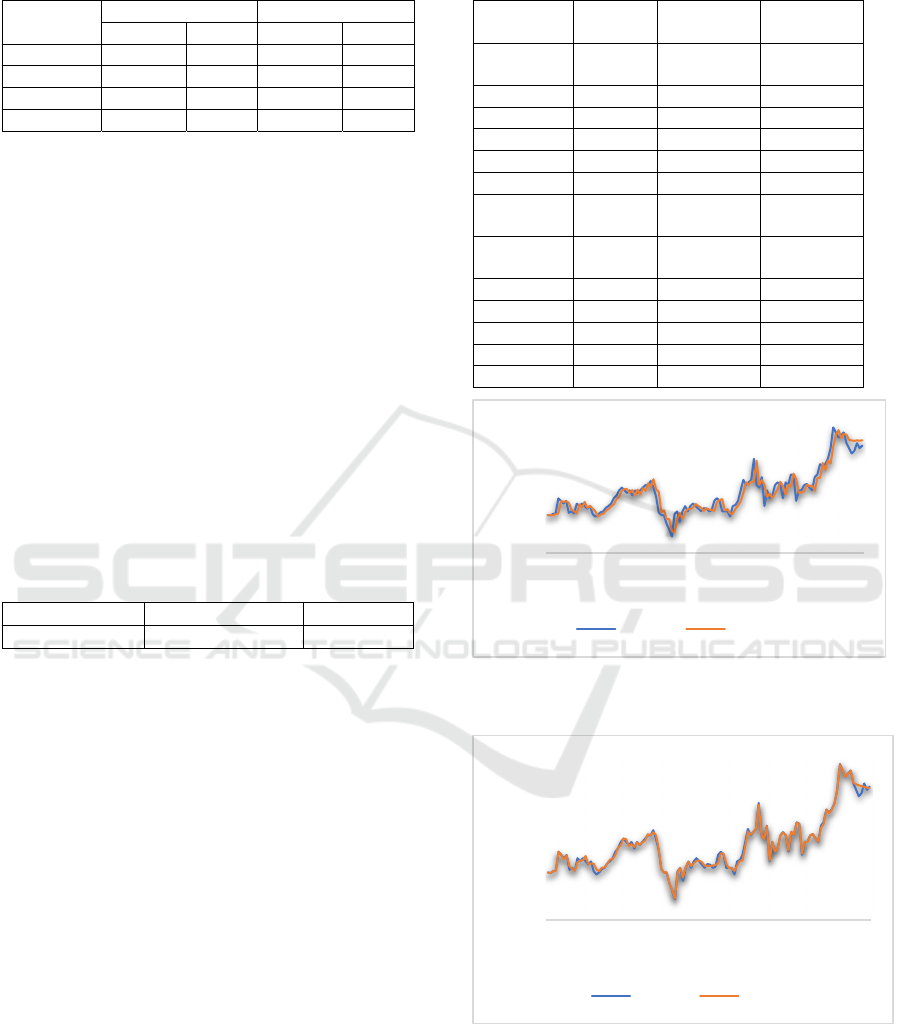
Table 2: Test of non-linearity for residuals ARIMA for
Guntur red chilli prices
Parameter
m=2 m=3
Statistic Prob. Statistic Prob.
2169.953 35.7509 0.000 51.7245 0.000
4339.905 19.0427 0.000 21.5662 0.000
6509.858 16.2100 0.000 16.2278 0.000
8679.811 16.0743 0.000 15.5886 0.000
3.3 Building of ANN Model
The neural network is shown to have an input layer
with an input node and hidden layer with a single
hidden node and output layer with an output node.
The software showed the best ANN model is NNAR
(1,1).
3.4 Evaluation of Models
The MAPE values of both the models are presented
in Table 3. The MAPE value of ARIMA model and
ANN model are 11.12 and 9.36 respectively.
According to Lewis, ARIMA model is good and ANN
model is excellent based upon the MAPE values. This
is due to non-linearity nature of data.
Table 3: Results of accuracy test for forecasted models of
Guntur red chilli prices
ARIMA fitted ANN fitted
MAPE 11.12 9.36
In Table 4, the forecasted prices red chillies of
Guntur market are presented. The prices are
forecasted for a period of six months i.e., from
January 2023 to June 2023. The actual prices of
chillies in these six months lies within the range of
Rs. 19000 per quintal to Rs. 21000 per quintal. The
forecasted chilli price values through ARIMA model
lies in the range of Rs. 21406.43 to Rs. 21555.47 per
quintal. Whereas through ANN model the predicted
prices of chillies have shown a gradual decrease and
the prices decreased from Rs. 20842.91 per quintal in
January 2023 to Rs. 20266.72 per quintal in June
2023. The errors in ARIMA model are from Rs. 524
to Rs. 2498 per quintal. The errors in ANN model are
from Rs. 233 to Rs. 1703 per quintal. The errors in
ARIMA model in forecasted values are huge when
compared to errors in ANN models (Mohammad et
al., 2024). It can be clearly observed that the
forecasted prices through ANN model are nearer to
actual values when compared to forecasted prices
through ARIMA model (Kumar et al., 2018).
Table 4: Forecasted prices of Red Chilli in Guntur market -
ARIMA vs ANN
Actual
data
ARIMA
fitte
d
Error in
ARIMA
2023-
Januar
y
20000 21555.47 -1555.47
Februar
y
19000 21498.14 -2498.14
March 19500 21406.43 -1906.43
A
p
ril 21000 21524.30 -524.30
Ma
y
20000 21419.08 -1419.08
June 20500 21502.93 -1002.93
Actual
data
ANN
fitte
d
Error in
ANN
2023-
Januar
y
20000 20842.91 -842.91
Februar
y
19000 20702.86 -1702.86
March 19500 20577.15 -1077.15
April 21000 20463.65 536.35
May 20000 20360.64 -360.64
June 20500 20266.72 233.28
Figure 2: Comparision of Actual and ARIMA fitted red
chilli prices
Figure 3: Comparision of Actual and ANN fitted red Chilli
price
The same can be depicted in figures. Figure 2
present the comparision of Actual and ARIMA fitted
red chilli prices. The graph showed clear demarcation
0
5000
10000
15000
20000
25000
2013
2014
2015
2016
2017
2018
2019
2020
2021
2022
2023
Actual ARIMA
0
5000
10000
15000
20000
25000
2013
2014
2015
2016
2017
2018
2019
2020
2021
2022
2023
Actual ANN
ICEISA 2024 - International Conference on ‘Emerging Innovations for Sustainable Agriculture: Leveraging the potential of Digital
Innovations by the Farmers, Agri-tech Startups and Agribusiness Enterprises in Agricu
140

and there we can able to observe two price lines and
there is not much overlapping of lines.
In Figure 3 showed comparision of Actual and
ANN fitted red chilli prices. Both the graphs are
overlapping and most part of the graph, we can able
to observe only single line because of this
overlapping.
During 2023, the forecasted red chilli prices are
deviating from actual prices because price
fluctuations during that particular period were high as
a result crop failure due to black thrips infestation.
4 CONCLUSIONS
The nature of data that is considered for the study
purpose will determine the model suitable for
predicting prices. This is a matter of major concern
while predicting agricultural commodity prices. The
current analytical study concluded that Artificial
Neural Network model is the best model when
compared to ARIMA model due to presence of non-
linearity nature in the data.
The accuracy of the
forecasting can still be increased by usage of hybrid
models where we can use ARIMA for linear part of
data and ANN for non-linear part of data.
Accurate price forecasting of agricultural
commodities is vital and helpful for attaining
sustainability of an agrarian economy. Accurate price
forecasting before the sowing season can help the
farmers in taking decision on selection of crop for
sowing which in turn result in better returns. If the
farmer is informed about the market which provides
the best price, then the farmer can plan in advance and
sell the produce in that market and get better price
realisation.
Government should take steps to inform the
accurate prices to farmers which result in better price
realization by farmers. Government should also frame
trade policies in such a way that the country can be
benefited through trade by comparing prices of
commodity in our country with other countries.
REFERENCES
Abdulali, B. A. A., & Masseran, N., 2021. Artificial neural
network (ANN) and ARIMA models for better forecast
of the air pollution data in Malaysia. Scholars journal
of Physics, Mathematics and Statistics, 8(10), 184-196.
https://doi.org/10.36347/sjpms.2021.v08i10.001
Box G. E. P., & Jenkins G., 1994. Time series analysis:
Forecasting and control, Prentice Hall, Englewood
Cliffs. New Jersey, 3
rd
edition.
Brock, W. A., Dechert, W. D., Scheinkman, J. A. &
Lebaron, B., 1996. A test for independence based on the
correlation dimension. Econometric reviews, 15, 197-
235.
Brockwell, P. J., & Davis, R. A., 1996. Introduction to time
series and forecasting, Springer texts in statistics. New
York, 1
st
edition.
Deepthi, P., & Kumar, P.P., 2020. A study on the marketing
of dry Chillies in Guntur district of Andhra Pradesh.
Journal of Pharmacognosy and Phytochemistry. 9(6),
517-520.
Gade, P. A., More, S. S., Shelke, R. D., & Nalegaonkar, A.
R., 2020. Growth and instability in area, production and
yield of chilli in India. International Journal of Current
Microbiology and Applied Sciences, 9(11), 2647-2654.
https://doi.org/10.20546/ijcmas.2020.911.321
Kumar, V. K., Bhat, A. R. S., Pavithra, N. L., & Megha, J.,
2018. Comparative performance of ANN and ARIMA
models in redgram price forecasting - Kalaburagi
market. Journal of Pharmacognosy and
Phytochemistry, 7(5), 1630-1632.
Lewis, C. D., 1982. Industrial and business forecasting
methods: A practical guide to exponential smoothing
and curve fitting, Butterworth scientific. London, 1
st
edition.
Malleswari, B., Devi, K. U., Srikanth, R., & Suseela, K.,
2023. Economic efficiency of farmers Adopting E-
Commerce for production and marketing of chilli in
Guntur district of Andhra Pradesh. Biological Forum –
An International Journal, 15(3), 147-155.
Mohammad, M. J., Hamza, H. A., & Khalil, D. M., 2024.
Monthly gold price forecasting using ANN and
ARIMA. Migration Letters, 21(4), 539–559.
Naveena, K., Singh, S., Rathod, S., & Singh, A., 2017.
Hybrid ARIMA-ANN modelling for forecasting the
price of Robusta coffee in India. International Journal
of Current Microbiology and Applied Sciences, 6(7),
1721-26.
https://doi.org/10.20546/ijcmas.2017.607.207.
Prasetyo, K., Putri, D. D., Wijayanti, I. K. E., & Zulkifli, L.,
2023. Forecasting of red chilli prices in Banyumas
Regency: The ARIMA approach. Web of Conferences.
444, 02017, 1-7.
Rathod, S., Mishra, G. C., & Singh, K. N., 2017. Hybrid
Time Series Models for Forecasting Banana Production
in Karnataka State, India. Journal of the Indian Society
of Agricultural Statistics, 71(3), 193-200.
Sarojam, S., Mohan, N., Paul, S. S., Chacko, B. K., Nema,
N. K. Z., & Jacob, V., 2020. A comparative study on
cultivars of Capsicum: Critical assessment based on
colour values, pungency and total Capsaicinoids
content. The Open Food Science Journal, 12, 9-16.
https://doi.org/ 10.2174/1874256402012010009
Sun, F., Meng, X., Zhang, Y., Wang, Y., Jiang, H., & Liu, P.,
2023. Agricultural product price forecasting methods: A
review. Agriculture, 13,1671, 1-20.
https://doi.org/10.3390/agriculture13091671
Swami, C. Y., Kumaran, G. S., Naik, R. K., Reddy, B. S., &
Rathinakumari, C. A., 2022. Constraints in dry chilli
cultivation practices and mechanization of harvesting in
A Comparison Between Arima and Ann Models for Guntur Red Chillies Price Forecasting
141

Southern India Journal of Horticultural Sciences,
17(1), 204-208.
https://doi.org/10.24154/jhs.v17i1.1089
Varshney, S., & Srivastava, P., 2023. A comparative study
of future stock price prediction through Artificial
Neural Network and ARIMA modelling. NMIMS
Management Review, 31(4), 229-239.
https://doi.org/10.1177/0971102324123
Vijay, N., & Mishra, G.C., 2018. Time series forecasting
using ARIMA and ANN Models for production of Pearl
millet (Bajra) crop of Karnataka, India. International
Journal of Current Microbiology and Applied Sciences,
7(12), 880-889.
https://doi.org/10.20546/ijcmas.2018.712.110
ICEISA 2024 - International Conference on ‘Emerging Innovations for Sustainable Agriculture: Leveraging the potential of Digital
Innovations by the Farmers, Agri-tech Startups and Agribusiness Enterprises in Agricu
142
