
A Study on Financial Ratio Analysis of Indian Farmers Fertiliser
Cooperative Limited (IFFCO)
C. H. Deepa
1,*
, S. Rajeswari
1
, N. Vani
1
and B. Ramana Murthy
2
1
Department of Agricultural Economics, S.V. Agricultural College, Tirupati, India
2
Dept. of Statistics and Computer Applications, S.V. Agricultural College, Tirupati, India
Keywords: IFFCO, Ratio Analysis, Trend Analysis, Liquidity, Solvency, Profitability, Efficient Utilization of Assets.
Abstract: Financial ratio analysis is a potent analytical tool that assesses the performance of the firm's liquidity,
solvency, asset utilization efficiency and profitability. The information gleaned from a company's financial
statements via ratio analysis can be useful to decision-makers such as managers, competitors, and investors.
This study is an assessment of performance of Indian Farmers Fertiliser Cooperative Limited (IFFCO), a
globally diversified and successful cooperative by adopting financial ratio analysis. Established in 1967 with
a mere 57 cooperatives, IFFCO has expanded to encompass nearly 36,000 Indian cooperatives with a diverse
range of operations, including general insurance, organic food production, fertilizer production, food
processing, microfinance, and rural communications with 5 manufacturing units, 21 state offices and 501 field
offices and with its backward and forward integration, IFFCO represents the hopes and aspirations of millions
of farmers as its members. The financial statements of last six financial years i.e., FY2017-18 to 2022-23
from the annual reports of the cooperatives are considered for the analysis. The study revealed that the overall
financial performance of the IFFCO is good. The Turnover of the IFFCO Group during the year 2022-23 was
Rs. 60224 Crore, as against Rs. 40171.67 Crore during the year 2021-22. Current ratio shows an increasing
trend from 3.6 to 4.01. Return on Capital Employed grew from 0.10 to 0.14. Proprietary Ratio is 0.71 in 2022-
23 as against 0.69 in 2021-22. Operating ratio declined from 0.17 to 0.14 during 2022-23, which shows
reduced operating expenses per unit sale. This indicates that IFFCO has ability to meet current obligations
and is able to utilize its assets efficiently.
1 INTRODUCTION
Achieving the profitability and solvency goals of a
business hinges on managers making informed
decisions based on a comprehensive evaluation of the
organization's financial position. Various methods
exist for such assessments. Time series analysis
delves into a firm's historical performance, tracking
changes in financial variables over time to identify
trends and assess improvement or deterioration.
Cross-sectional or interfirm analysis, on the other
hand, scrutinizes the performance of multiple firms
within the same industry at a specific point in time,
aiding in benchmarking and strategic decision-
making. Pro forma analysis involves predicting the
future financial position by projecting statements
based on current financial data, providing a forward-
looking perspective for planning and decision-
making. Each of these approaches offers unique
*
deepanush18@gmail.com
insights, enabling managers to navigate challenges
and capitalize on opportunities, ultimately steering
the business towards its financial objectives.
A singular numerical value lacks inherent
meaning, but the concept of ratios in accounting and
finance provides a relative measure by establishing
quantitative relationships between two variables.
Financial ratios, expressed as proportions, fractions,
or percentages, enable the comparison of related
information within a set of financial statements.
These ratios serve as crucial tools for analyzing and
understanding a company's financial performance,
shedding light on the connections between key
elements. By offering a contextual framework,
financial ratios empower stakeholders to assess and
compare various aspects of a company's financial
position, facilitating informed decision-making.
Ratios can be divided into four major categories:
Deepa, C. H., Rajeswari, S., Vani, N. and Murthy, B. R.
A Study on Financial Ratio Analysis of Indian Farmers Fertiliser Cooperative Limited (IFFCO).
DOI: 10.5220/0012882500004519
Paper published under CC license (CC BY-NC-ND 4.0)
In Proceedings of the 1st International Conference on Emerging Innovations for Sustainable Agriculture (ICEISA 2024), pages 93-102
ISBN: 978-989-758-714-6
Proceedings Copyright © 2025 by SCITEPRESS – Science and Technology Publications, Lda.
93
• Liquidity ratios: These are the measures of
firm's ability to pay off its short-term debts .
• Leverage Ratios or Solvency Ratios or Capital
Structure Ratios: These ratios determine the
proportion of debt and equity in financing
assets of a firm.
• Activity or Turnover Ratios or Working Capital
Ratiosmeasures the efficiency with which
firm utilizes its assets.
• Profitability Ratios measures the firm's use of
its assets and control of its expenses to
generate an acceptable rate of return.
Indian Farmers Fertiliser Cooperative Limited
(IFFCO) is a multi-state cooperative society head
quatered at New Delhi and established in 1967. It has
grown into the world's largest cooperative. IFFCO
specializes in the manufacturing and marketing of
fertilizers, addressing the heightened demand during
the 1960s. Owned by Cooperative Societies of India,
IFFCO plays a pivotal role in supporting farmers by
providing essential agricultural inputs, contributing
significantly to India's agricultural sector since its
registration on November 3, 1967. It has five
manufacturing units located in Kalol and Kandla of
Gujarat, Phulpur and Aonla of Uttar Pradesh and
Paradeep, Odisha. The basic objective of the study
was to analyse the liquidity ratios, leverage ratios,
turnover ratios and profitability ratios of IFFCO.
2 REVIEW OF LITERATURE
In a study conducted by Preeti et al. (2020), the
financial profitability of Hindustan Petroleum
Corporation Limited (HPCL) was analyzed using
various financial tools over a five-year period from
2014-15 to 2018-19. The current ratio fluctuated
during this period, starting at 0.63 in 2014-15,
decreasing to 0.48 in 2015-16, rising to 0.59 and 0.62
in 2016-2017 and 2017-2018 respectively, and then
decreasing again to 0.54 in 2018-2019. Additionally,
the Gross Profit exhibited a notable increase of 99.70
in 2017-2018, contrasting with a decrease of 6.02 in
2014-2015.
In Srividhya et al.'s (2020) analysis of Planys
Technologies Pvt. Ltd., liquidity ratios fluctuated
over five years (2015-2020), indicating improving
overall financial performance. Efforts to reduce
operating expenses for higher net profit are
suggested.
In a comprehensive study, Irfan et al. (2022)
conducted financial statement and ratio analysis of
Britannia Industries, spanning from FY 2017-18 to
2021-22. Utilizing audited annual reports, the
analysis included trend assessment of financial
position and performance through various ratios.
Notably, the proportion of Debt to Capital Employed
rose from 0.80% in 2017-18 to 23.81% in 2021-22.
3 METHODOLOGY
The financial statements of past six financial years
i.e., FY 2017-18 to 2022- 23 from the annual reports
of IFFCO were considered for the analysis.
3.1 Liquidity Ratios
1. Current ratio = Current Assets ÷ Current
Liabilities
• It measures the short-term liquidity of a firm.
• A firm with a higher ratio has better liquidity.
• Ideal ratio is 2:1
2. Quick ratio = Quick Assets ÷ Current Liabilities
• To have a better idea about liquid position of the
firm.
• Ideal ratio is 1:1.
3. Cash Ratio = Cash and Cash Equivalents ÷
Current Liabilities
• To know whether the firm is able to pay liquid
liabilities immediately.
3.2 Solvency or Leverage Ratios
1. Debt-Equity Ratio = Total Debt or Liabilities ÷
Shareholders’ Fund
• It shows the proportion of long-term Debt or
Liabilities with Shareholders’ Funds.
2. Debt to Capital Employed Ratio
= Total Debt or Liabilities ÷ Capital Employed
• It shows the proportion of long-term debt or
Liabilities with capital employed.
3. Proprietary Ratio = Shareholders’ Fund ÷
Capital Employed
• It shows the proportion of Proprietary’s fund with
Capital Employed.
4. Debt-Total Assets Ratio = Total Debts ÷ Total
Assets
• It shows the proportion of Long-term Debt with
Total Assets.
ICEISA 2024 - International Conference on ‘Emerging Innovations for Sustainable Agriculture: Leveraging the potential of Digital
Innovations by the Farmers, Agri-tech Startups and Agribusiness Enterprises in Agricu
94
3.3 Activity or Turnover or Efficiency
Ratios
1. Inventory Turnover Ratio
= Turnover ÷ Average Inventory
• It indicates how fast the inventory is sold.
2. Capital Employed Turnover Ratio = Capital
Employed ÷ Turnover
• To know the efficiency of Capital Employed in the
business.
3. Fixed Assets Turnover Ratio = Fixed Assets ÷
Turnover
• To know the efficiency of Fixed Assets utilised in
the business
4. Working Capital Turnover Ratio = Net Working
Capital ÷ Turnover
• To know the efficiency of Working Capital utilised
in the business.
3.4 Profitability Ratios
1. Net Profit Ratio = Net Profit After Tax ÷ Sales
• It measures the Net Profitability in relation to
sales.2. Return on Equity Shareholders’ Funds =
Profit After Tax (PAT) ÷ Equity Shareholders’
Funds
• To know the profitability from the view point of
Equity shareholders.
3. Operating Ratio = Total Expenses ÷ Sales
•It shows the operational efficiency of the business.
•Lower the operating ratio, higher the operating
profit and vice versa.
•It measures the expense per sale.
4. Return on Capital Employed or Investment
= Profit Before Interest and Tax (PBIT) ÷ Capital
Employed
•It measures the profitability of the total funds per
investment of a firm. It shows the profitability of the
business.
5. Earnings Per Share (EPS)
= Profit After Tax (PAT) ÷ Number of Basic Equity
Shareholders
•To know the Earnings Per Share.
6. Book Value per Share
=Equity Shareholder's Fund ÷ Number of Equity
shareholders
• To know the Book Value Per Share
4 RESULTS AND DISCUSSION
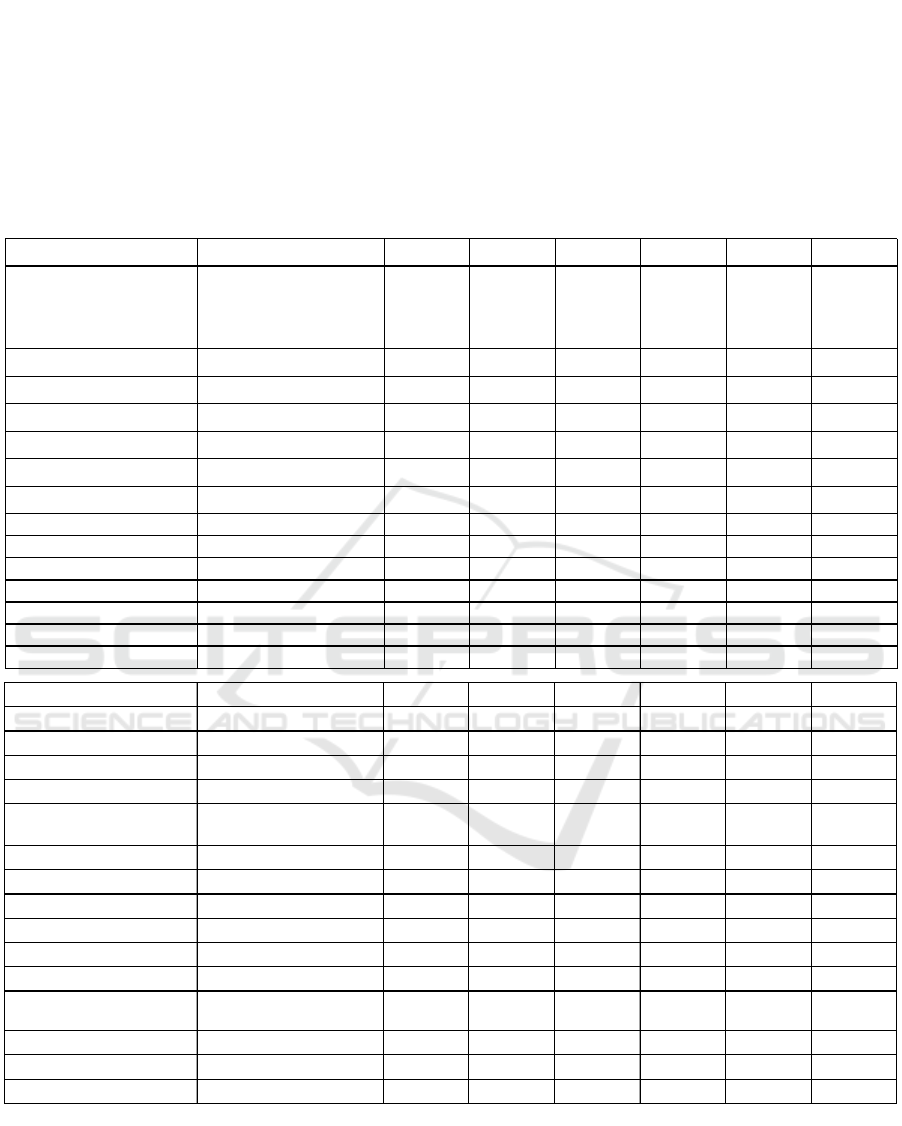
4.1 Balance Sheet of IFFCO ltd
A balance sheet is a financial statement providing a
snapshot of a company's assets, liabilities, and
shareholder's equity on a specific date. IFFCO's
balance sheets for six fiscal years, as of March 31,
illustrate significant growth in Shareholder's Funds,
Rising from 15,306.87 crores in 2017–18 to 23,452.4
crores in 2022–2023, inclusive of Share Capital,
Reserves, and Surplus. Although total liabilities have
slightly increased, total assets surged from 30,248.1
crores in 2017–18 to 39,185.6 crores in 2022–2023,
indicating an enhanced and more sustainable
financial position for the cooperatives.
4.2 Profit and Loss Statement of
IFFCO Ltd
The Profit and Loss (P&L) statement, a financial
summary of revenues, costs, and expenses within a
specific period, is presented in the following table for
six financial years of IFFCO. Notably, Sales, PBDIT,
and PAT have experienced substantial growth,
ascending from 20,787.55, 2,471.32, and 937.17
crores in 2017-18 to 60,224, 5,362.49, and 3,052.73
crores in 2022-23. This substantial increase
underscores the significant improvement in the
financial performance of the cooperatives over the
specified years.
4.3 Ratio Analysis
4.3.1 Liquidity Ratios
The current ratio for IFFCO exhibited variations over
the fiscal years, standing at 4.25 in 2017–18,
increasing to 5.08 in 2018–19, reaching 4.99 in 2019–
2020, but subsequently declining to 4.44 in 2020–21
and further to 3.6 in 2021–22. In 2022-23, the current
ratio improved slightly to 4.01. The trend indicates a
diminishing proportion of cash and equivalents
relative to current obligations, dropping from 0.82 in
2017–18 to 0.73 in 2022–23, raising concerns.
Notably, 2021–22 saw a significant drop in liquid
assets, reflected in liquidity ratios—3.6 current ratio,
2.55 quick ratio, and 0.82 cash ratio—indicating a
declining trend from 2017–18 to 2022–23,
particularly in the quick ratio.
A Study on Financial Ratio Analysis of Indian Farmers Fertiliser Cooperative Limited (IFFCO)
95
4.3.2 Solvency or Leverage Ratios
The Debt-Equity Ratio and Debt-Total Assets Ratio
for IFFCO have seen a decline from 0.69 and 0.35 in
2017-18 to 0.42 and 0.25 in 2022-23, respectively.
Additionally, the proportion of Debt to Capital
Employed decreased from 0.46% in 2019-20 to
0.29% in 2022-23, indicating reduced reliance on
external funds by the cooperatives. Conversely, a
positive trend is observed in the proprietary ratio,
rising from 0.59 in 2017-18 to 0.71 in 2022-23,
signaling an increase in shareholder's funds and
enhanced reliability of the cooperatives.
Table 1.
(Amount in Crores)
2017-18 2018-19 2019-20 2020-21 2021-22 2022-23
( a ) Share Capital ( 1 ) Shareholders ' Funds 420.55 627.57 628.34 627.01 634.29 612.65
( b ) Reserves and Surplus ( 1 ) Shareholders ' Funds 14886.32 15641.91 16545.2 18170.36 19924.34 22839.75
( 1 ) Shareholders ' Funds Total 15306.87 16269.48 17173.54 18797.37 20558.63 23452.4
( a ) Long Term Borrowings ( 2 ) Non - Current Liabilities 1125 750 975 450 1000 675
( b ) De fe rred Ta x Lia bilities ( N e t ) ( 2 ) N on - Current Liabilities 770.7 808.75 575.95 535.68 508.41 492.01
( C ) O the r Long Term Liabilities ( 2 ) N on - Current Liabilities 13.88 6.54 6.31 10.2 21.5 26.53
( d ) Long Term Provisions ( 2 ) Non - Current Liabilities 374.14 401.45 435.57 456.34 440.18 440.98
( 2 ) Non - Current Liabilities Total 2283.72 1966.74 1992.83 1452.22 1970.09 1634.52
( a ) Short Term Borrowings ( 3 ) Current Liabilities 9412.78 13282.17 13494.55 7472.98 8247.7 9095.39
( b ) Trade Payables ( 3 ) Current Liabilities 1521.32 1537.29 1760.2 1258.23 2974.75 2885.12
( c ) Other Current Liabilities ( 3 ) Current Liabilities 1382.35 1548.67 1649.59 1257.77 1527.52 1593.27
( d ) Short Term Provisions ( 3 ) Current Liabilities 341.06 445.83 530.19 501.3 555.26 524.87
( 3 ) Current Liabilities Total 12657.51 16813.96 17434.53 10490.28 13305.23 14098.65
I. EQUITY AND LIABILITIES 30248.1 35050.18 36600.9 30739.87 35833.95 39185.57
Particulars 2017-18 2018-19 2019-20 2020-21 2021-22 2022-23
( a ) Property , Plant and Equipment ( 1 ) Non - Current Assets 12716.89 12681.65 12631.39 12605.32 12838.43 13378.91
( b ) Intangible Assets ( 1 ) Non - Current Assets 10.01 8.06 9.44 5.93 20.28 25.79
( c ) Capital Work - in - Progress ( 1 ) Non - Current Assets 508.05 604.98 575.53 644.49 699.99 1359.31
( d ) Non Current Investments ( 1 ) Non - Current Assets 2933.79 3541.18 3449.57 3791.28 3767.44 3935.76
( e ) Long Term Loans and
Advances
( 1 ) Non - Current Assets 284.97 258.98 266.28 301.93 311.31 425.43
Other Non Current Assets ( 1 ) Non - Current Assets 0 0 0 7.9 11.02 11.25
( 1 ) Non - Current Assets Total 16453.71 17094.85 16932.21 17356.85 17648.47 19136.45
( a ) Current Investments ( 2 ) Current Assets 0 85 568.5 138.94 209.97 85.06
( b ) Inventories ( 2 ) Current Assets 2123.63 3586.38 3177.17 2328.65 5330.85 5124.27
( c ) Trade Receivables ( 2 ) Current Assets 2807.44 2870.43 2982.72 1060.27 445.07 1773.02
( d ) Cash and Bank Balances ( 2 ) Current Assets 2663.09 2475.87 1961.86 6426.56 4143.18 3657.39
( e ) Short Term Loans and
Advances
( 2 ) Current Assets 161.69 127.56 187.53 137.86 217.16 179.25
Other Current Assets ( 2 ) Current Assets 6038.54 8810.09 10790.91 3300.67 7879.56 9230.13
( 2 ) Current Assets Total 13794.39 17955.33 19668.69 13392.95 18225.79 20049.12
TOTAL ASSETS 30248.1 35050.18 36600.9 30749.8 35874.26 39185.57
ICEISA 2024 - International Conference on ‘Emerging Innovations for Sustainable Agriculture: Leveraging the potential of Digital
Innovations by the Farmers, Agri-tech Startups and Agribusiness Enterprises in Agricu
96
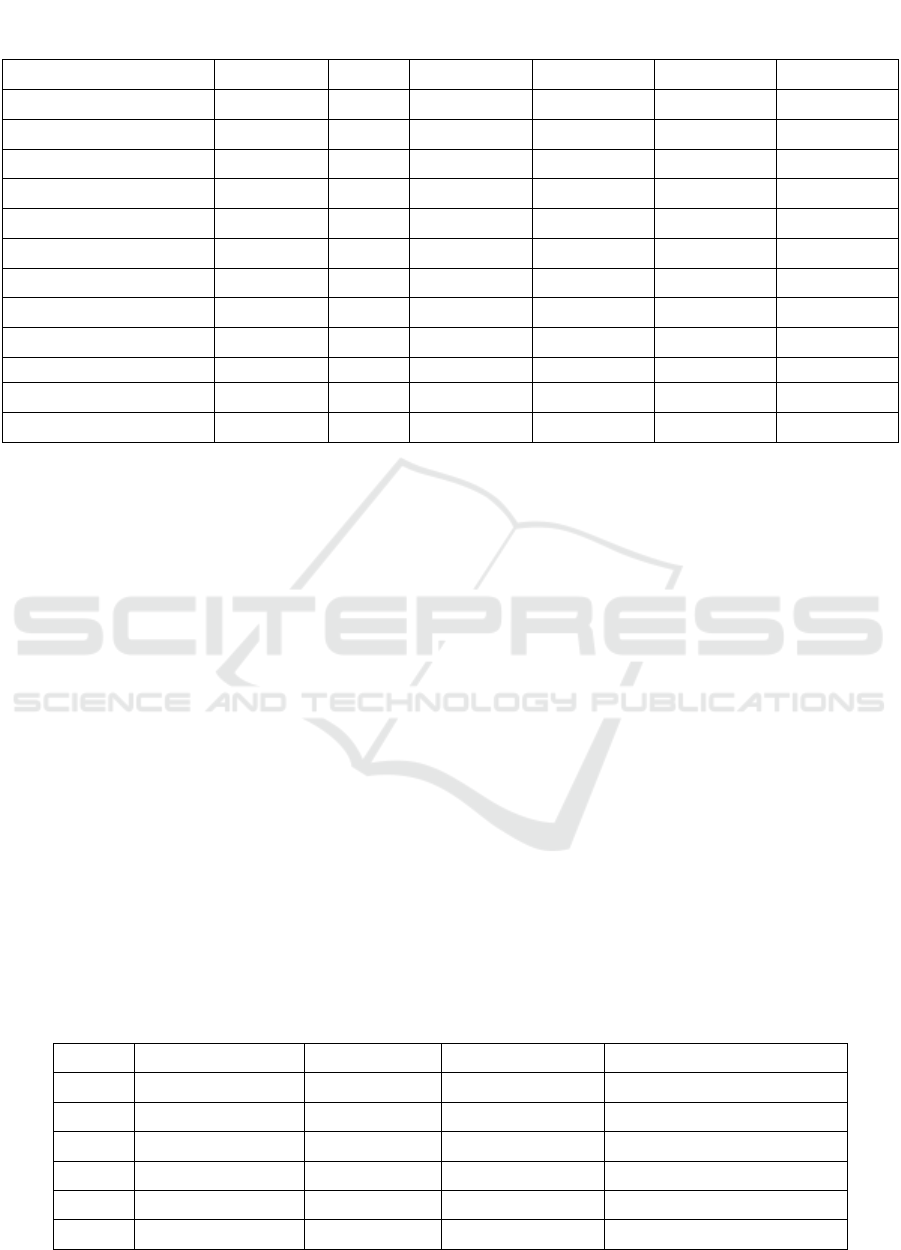
Table 2.
(Amount in Crores)
Particulars 2017-18 2018-19 2019-20 2020-21 2021-22 2022-23
Sales 20787.55 27851.74 29412.44 27836.86 40171.67 60224
COGS 14493.72 18551.59 19017.58 16792.14 31630.57 48859.82
Gross Profit 6293.83 9300.15 10394.86 11044.72 8541.1 11364.18
Other Revenue 2726.31 694.3 629.78 818.18 1726.55 2665.76
Operating Expenses 6548.82 7342.24 8161.28 8256.45 6793.67 8667.45
PBDIT 2471.32 2652.21 2863.36 3606.45 3473.98 5362.49
Depreciation/ Amortisation 450.1 498.13 523.9 547.25 608.59 655.71
PBIT 2021.22 2154.08 2339.46 3059.2 2865.39 4706.78
Finance Cost 763.98 995.85 1059.03 689.42 364.41 699.97
Profit Before Tax (PBT) 1257.24 1158.23 1280.43 2369.78 2500.98 4106.81
Tax 320.07 316.65 275.87 615.89 617.21 1054.08
Profit After Tax (PAT) 937.17 841.58 1004.56 1753.89 1883.77 3052.73
4.3.3 Activity or Turnover or Efficiency
Ratios
The Inventory Turnover Ratio for IFFCO has shown
a consistent increase from 23.39 in 2017-18 to 24.40
in 2022-23, indicating a swift turnover of inventory.
Moreover, there is a positive trend in the Capital
Employed Turnover Ratio, escalating from 0.80 in
2017-18 to 1.81 in 2022-23, suggesting efficient
utilization of capital. The Fixed Assets Turnover
Ratio exhibited substantial growth, climbing from
1.26 in 2017-18 to 3.15 in 2022-23, highlighting
improved efficiency in fixed asset utilization.
Similarly, the Working Capital Turnover Ratio
increased from 0.05 in 2017-18 to 0.10 in 2022-23,
underscoring enhanced efficiency in working
capital utilization.
4.3.4 Profitability Ratios
The Cooperatives has maintained a still
performance as per Net Profit Ratio at 0.05.
Operating ratio declined from 0.17 in 2021-22 to
0.14 during 2022-23, which shows reduced
operating expenses per unit sale. Return on Capital
Employed showed increasing trend from 0.10 in
2021-222 to 0.14 in 2022-23 which shows the
profitability of the business. Return on Equity
Shareholders’ Fund increased to 0.13 in 2022-23
from 0.09 in 2021-22 which shows profitability
from the view point of Equity shareholders.
Earnings Per Share (EPS) and Book Value per Share
also showed increasing trend from 41738.01 and
455510.13 rupees in 2021-22 to 67975.91 and
522220.49 rupees in 2022-23 revealing the
profitability and the reliability of the Cooperatives.
Following are the tables depicting the trends of
financial ratios computed from financial statements
of past six financial years i.e., FY 2017-18 to 2022-
23 from the annual reports of IFFCO Ltd. Amounts
of all financial particulars are indicated in crores.
4.3.5 Liquidity Ratios
Table 3: Current ratio.
Sl. No. Financial Year Current Assets Current Liabilities Ratio in Proportion
1 2017-18 13794.39 3244.73 4.25:1
2 2018-19 17955.33 3531.79 5.08:1
3 2019-20 19668.69 3939.98 4.99:1
4 2020-21 13392.95 3017.3 4.44:1
5 2021-22 18225.79 5057.53 3.60:1
6 2022-23 20049.12 5003.26 4.01:1
A Study on Financial Ratio Analysis of Indian Farmers Fertiliser Cooperative Limited (IFFCO)
97
Table 4: Quick ratio.
Sl. No. Financial Year Quick Assets Current Liabilities Ratio in Proportion
1 2017-18 11670.76 3244.73 3.60:1
2 2018-19 14368.95 3531.79 4.07:1
3 2019-20 16491.52 3939.98 4.19:1
4 2020-21 11064.3 3017.3 3.67:1
5 2021-22 12894.94 5057.53 2.55:1
6 2022-23 14924.85 5003.26 2.98:1
Table 5: Cash ratio.
Sl. No. Financial Year Cash & Cash equivalents Current Liabilities Ratio in Proportion
1 2017-18 2663.09 3244.73 0.82:1
2 2018-19 2475.87 3531.79 0.70:1
3 2019-20 1961.86 3939.98 0.50:1
4 2020-21 6426.56 3017.3 2.13:1
5 2021-22 4143.18 5057.53 0.82:1
6 2022-23 3657.39 5003.26 0.73:1
4.3.6 Solvency or Leverage Ratios
Table 6: Debt-Equity Ratio.
Sl. No. Financial Year Total Debt Shareholder's Fund Ratio in Percentage
1 2017-18 10537.78 15306.87 68.84
2 2018-19 14032.17 16269.48 86.25
3 2019-20 14469.55 17173.54 84.25
4 2020-21 7922.98 18797.37 42.15
5 2021-22 9247.7 20558.63 44.98
6 2022-23 9770.39 23452.4 41.66
Table 7: Debt to Capital Employed Ratio.
Sl. No. Financial Year Total Debt Capital Employed Ratio in Percentage
1 2017-18 10537.78 25844.65 40.77
2 2018-19 14032.17 30301.65 46.31
3 2019-20 14469.55 31643.09 45.73
4 2020-21 7922.98 26720.35 29.65
5 2021-22 9247.7 29806.33 31.03
6 2022-23 9770.39 33222.79 29.41
ICEISA 2024 - International Conference on ‘Emerging Innovations for Sustainable Agriculture: Leveraging the potential of Digital
Innovations by the Farmers, Agri-tech Startups and Agribusiness Enterprises in Agricu
98
Table 8: Proprietary Ratio.
Sl. No. Financial Year Shareholder's Fund Capital Employed Ratio in Percentage
1 2017-18 15306.87 25844.65 59.23
2 2018-19 16269.48 30301.65 53.69
3 2019-20 17173.54 31643.09 54.27
4 2020-21 18797.37 26720.35 70.35
5 2021-22 20558.63 29806.33 68.97
6 2022-23 23452.4 33222.79 70.59
Table 9: Debt-Total Assets Ratio.
Sl. No. Financial Year Total Debt Total Assets Ratio in Percentage
1 2017-18 10537.78 30248.1 34.84
2 2018-19 14032.17 35050.18 40.03
3 2019-20 14469.55 36600.9 39.53
4 2020-21 7922.98 30749.8 25.77
5 2021-22 9247.7 35874.26 25.78
6 2022-23 9770.39 39185.57 24.93
4.3.7 Activity or Turnover or Efficiency Ratios
Table 10: Inventory Turnover Ratio.
Sl. No. Financial Year Turnover
Opening
inventory
Closing
inventory
Average
inventory
Ratio in proportion
1 2017-18 20787.55 966.47 810.99 888.73 23.39:1
2 2018-19 27851.74 810.99 1961.74 1386.365 20.09:1
3 2019-20 29412.44 1961.74 1690.46 1826.1 16.11:1
4 2020-21 27836.86 1690.46 766.8 1228.63 22.66:1
5 2021-22 40171.67 766.8 2270.23 1518.515 26.45:1
6 2022-23 60224 2270.23 2666.43 2468.33 24.40:1
Table 11: Capital Employed Turnover Ratio.
Sl. No. Financial Year Turnover Capital Employed Ratio in Proportion
1 2017-18 20787.55 25844.65 1.24:1
2 2018-19 27851.74 30301.65 1.09:1
3 2019-20 29412.44 31643.09 1.08:1
4 2020-21 27836.86 26720.35 0.96:1
5 2021-22 40171.67 29806.33 0.74:1
6 2022-23 60224 33222.79 0.55:1
A Study on Financial Ratio Analysis of Indian Farmers Fertiliser Cooperative Limited (IFFCO)
99
Table 12: Fixed Assets Turnover Ratio.
Sl. No. Financial Year Turnover Fixed assets Ratio in Proportion
1 2017-18 20787.55 16453.71 0.79:1
2 2018-19 27851.74 17094.85 0.61:1
3 2019-20 29412.44 16932.21 0.58:1
4 2020-21 27836.86 17356.85 0.62:1
5 2021-22 40171.67 17648.47 0.44:1
6 2022-23 60224 19136.45 0.32:1
Table 13: Working Capital Turnover Ratio.
Sl. No. Financial Year Turnover Net Working Capital Ratio in Proportion
1 2017-18 20787.55 1136.88 0.05:1
2 2018-19 27851.74 1141.37 0.04:1
3 2019-20 29412.44 2234.16 0.08:1
4 2020-21 27836.86 2902.67 0.10:1
5 2021-22 40171.67 4920.56 0.12:1
6 2022-23 60224 5950.47 0.10:1
4.3.8 Profitability Ratios
Table 14: Net Profit Ratio.
Sl. No. Financial Year Profit after Tax Sales Ratio in Percentage
1 2017-18 937.17 20787.55 4.51
2 2018-19 841.58 27851.74 3.02
3 2019-20 1004.56 29412.44 3.42
4 2020-21 1753.89 27836.86 6.30
5 2021-22 1883.77 40171.67 4.69
6 2022-23 3052.73 60224 5.07
Table 15: Operating Ratio.
Sl. No. Financial Year Total Expense Sales Ratio in Percentage
1 2017-18 6548.82 20787.55 31.50
2 2018-19 7342.24 27851.74 26.36
3 2019-20 8161.28 29412.44 27.75
4 2020-21 8256.45 27836.86 29.66
5 2021-22 6793.67 40171.67 16.91
6 2022-23 8667.45 60224 14.39
ICEISA 2024 - International Conference on ‘Emerging Innovations for Sustainable Agriculture: Leveraging the potential of Digital
Innovations by the Farmers, Agri-tech Startups and Agribusiness Enterprises in Agricu
100
Table 16: Return on Capital Employed or Investment.
Sl. No. Financial Year PBIT Capital Employed Ratio in Percentage
1 2017-18 2021.22 25844.65 7.82
2 2018-19 2154.08 30301.65 7.11
3 2019-20 2339.46 31643.09 7.39
4 2020-21 3059.2 26720.35 11.45
5 2021-22 2865.39 29806.33 9.61
6 2022-23 4706.78 33222.79 14.17
Table 17: Return on Equity Shareholders’ Funds.
Sl. No. Financial Year PAT Shareholder's Fund Ratio in Percentage
1 2017-18 937.17 15306.87 6.12
2 2018-19 841.58 16269.48 5.17
3 2019-20 1004.56 17173.54 5.85
4 2020-21 1753.89 18797.37 9.33
5 2021-22 1883.77 20558.63 9.16
6 2022-23 3052.73 23452.4 13.02
Table 18: Earnings Per Share (EPS).
Sl. No. Financial Year PAT Number of Equity shareholders Earnings per Share
1 2017-18 937.17 409317 0.00229
2 2018-19 841.58 450214 0.00187
3 2019-20 1004.56 450396 0.00223
4 2020-21 1753.89 450251 0.00389
5 2021-22 1883.77 451332 0.00417
6 2022-23 3052.73 449090 0.00679
Table 19: Book Value per Share.
Sl. No. Financial Year Equity Shareholder's Fund Number of Equity shareholders Book value per share
1 2017-18 15306.87 409317 0.03739
2 2018-19 16269.48 450214 0.03614
3 2019-20 17173.54 450396 0.03813
4 2020-21 18797.37 450251 0.04174
5 2021-22 20558.63 451332 0.04555
6 2022-23 23452.4 449090 0.05222
5 CONCLUSION
The comprehensive analysis of the financial
performance of the Cooperatives over the five-year
period from 2017-18 to 2021-22 indicates a positive
overall outlook. Despite the need for improvement in
liquidity and solvency for long-term sustainability,
the company demonstrates good financial
A Study on Financial Ratio Analysis of Indian Farmers Fertiliser Cooperative Limited (IFFCO)
101

performance in various aspects. Notably, reduced
dependence on debts, efficient utilization of capital
employed and working capital, along with minimized
operating expenses, contribute to the success of
IFFCO as a cooperative. The findings suggest a
foundation of financial strength and strategic
management in ensuring the cooperative's success.
REFERENCES
Deepika, S and Dhivya, B. 2019. A study on Financial
statement Analysis of Oil and Natural Gas Corporation
limited. International Journal of Applied Research.
3(3):537-540.
Divya, B.R and Ramya, N. 2020. A study on Financial
performance analysis of Indian Oil Corporation
Limited. EPRA International Journal of Research and
Development. 5(3):250-255.
Elayabharathi, V., Praveena, M and Rathika, S. 2019. A
study on Financial Performance Analysis with
reference to TNSC Bank, Chennai. International
Journal of Advance Research and Innovative Ideas in
Education. 5(2):2949-2955.
Gokulapriya, V and Dhanya, P. 2020. A study on Financial
performance of Maruti Suzuki motors. EPRA
International Journal of Research and Development
(IJRD). 5(11): 2455-7838
Hasanaj, P and Kuqi, B. 2019. Analysis of Financial
Statements: The Importance of Financial Indicators in
Enterprise. Humanities and Social Science Research.
2(2): 2576-3024.
Irfan, M., Gracy, C.P., Ganapathy, M.S., Siddayya, Gaddi,
G.M and Sharif, M. 2022. Study on Financial Ratio
Analysis of a Food Industry Company. Asian Journal
of Agricultural Extension, Economics & Sociology.
40(12):68-78
Preeti, J. A. and Kalimuthu, M. 2020. A study on Financial
performance analysis of Hindustan petroleum
corporation limited. EPRA International Journal of
Research and Development (IJRD). 5(11): 2455-7838.
Srividhya, S., Senthilnathan, C.R., Kengatharan, N and
Umadevi, R. 2020. A study on Financial ratio analysis
of Planys technologies Pvt. Ltd. India. Ilkogretim
Online – Elementary Education Online. 19(3):4642-
4652.
ICEISA 2024 - International Conference on ‘Emerging Innovations for Sustainable Agriculture: Leveraging the potential of Digital
Innovations by the Farmers, Agri-tech Startups and Agribusiness Enterprises in Agricu
102
