
Artificial Intelligence-Powered Large Language Transformer Models
for Opioid Abuse and Social Determinants of Health Detection for
the Underserved Population
Don Roosan
1a
, Yanting Wu
2b
, Jay Chok
3c
, Christopher P. Sanine
4
, Tiffany Khou
1d
,
Yawen Li
5e
and Hasiba M. Khan
6f
1
Western University of Health Sciences, College of Pharmacy, 309 E 2
nd
Street, Pomona, CA, U.S.A.
2
Indiana University School of Medicine, Division of Clinical Pharmacology, 340 W 10th Street, Indianapolis, IN, U.S.A.
3
Westcliff University, 17877 Von Karman Ave 4th floor, Irvine, CA 92614, U.S.A.
4
Emanate Health Inter-Community Hospital, 210 W San Bernardino Road, Covina, CA, U.S.A.
5
School of Social Work, California State University, San Bernardino, CA, U.S.A.
6
Tekurai Inc, 2000 NW Military Highway #10, San Antonio, TX, U.S.A.
Keywords:
Artificial Intelligence, Cognitive Task Analysis, Electronic Health Record, Data Visualization, Opioid Use
Disorder.
Abstract: The rise of big data in healthcare, particularly within electronic health records (EHRs), presents both
challenges and opportunities for addressing complex public health issues such as opioid use disorder (OUD)
and social determinants of health (SDoH). Traditional data analysis methods are often limited by their reliance
on structured data, overlooking the wealth of valuable insights embedded within unstructured clinical
narratives. Leveraging advancements in artificial intelligence (AI), Large Language Models (LLM) and
natural language processing (NLP), this study proposes a novel approach to detect OUD by analyzing
unstructured data within EHRs. Specifically, a Bidirectional Encoder Representations from Transformers
(BERT)-based NLP method is developed and applied to clinical progress notes extracted from the EHR
system of Emanate Health System. The study created a data analytics platform utilizing user-centered design
for improving clinical decisions. This study contributes to the ongoing effort to combat the opioid crisis by
bridging the gap between technology-driven analytics and clinical practice, ultimately striving for improved
patient wellbeing and equitable healthcare delivery.
1
INTRODUCTION
Big data pertains to large volumes of diverse datasets
that cannot be analyzed, managed, or contained by
traditional methods in industries such as business,
marketing, or social media (Collins et al., 2003;
Kong, 2019). In the healthcare sector, big data exists
in various forms such as mobile health applications,
medical monitoring devices, and electronic health
records (EHRs). Much real-world evidence research
a
https://orcid.org/0000-0003-2482-6053
b
https://orcid.org/0000-0001-8509-5114
c
https://orcid.org/0000-0002-2082-0079
d
https://orcid.org/0009-0002-1239-7327
e
https://orcid.org/0000-0001-5636-678X
f
https://orcid.org/0009-0003-1404-0994
utilizes structured data for comparative effectiveness
studies, retrospective analysis, and predicting disease
progression (Desautels et al., 2016; Fiks et al., 2012;
Klompas et al., 2013; L.-T. Wu et al., 2011).
Structured EHR data refers to standardized datasets
that can be easily retrieved to store lab values, ICD-
10 codes, or patient demographics (Raghupathi &
Raghupathi, 2014). Unstructured data, on the other
hand, refers to datasets that are not as easily
retrievable and exist mainly as free texts such as
Roosan, D., Wu, Y., Chok, J., Sanine, C., Khou, T., Li, Y. and Khan, H.
Artificial Intelligence-Powered Large Language Transformer Models for Opioid Abuse and Social Determinants of Health Detection for the Underserved Population.
DOI: 10.5220/0012717200003756
Paper published under CC license (CC BY-NC-ND 4.0)
In Proceedings of the 13th International Conference on Data Science, Technology and Applications (DATA 2024), pages 15-26
ISBN: 978-989-758-707-8; ISSN: 2184-285X
Proceedings Copyright © 2024 by SCITEPRESS – Science and Technology Publications, Lda.
15

physician, nurse, or pharmacy progress notes, MRIs,
EKGs, etc. More than 80% of healthcare data is
unstructured, containing diverse and vital patient
information with numerous potential applications
(Kong, 2019). Unfortunately, unstructured data
remains underutilized because it is not as easily
accessible for information processing. Therefore,
functionalities with the ability to process the
unstructured data must be created to allow clinicians
to understand better the clinical complexities existing
in healthcare (Hernandez- Boussard et al., 2019;
Islam et al., 2014, 2015; Islam, Mayer, et al., 2016;
Islam, Weir, et al., 2016). Unstructured data provides
a more comprehensive and detailed representation of
the patient’s diagnosis, disease progression, and
disease burden and can provide insight into non-
medical factors that can impact health outcomes
(Kharrazi et al., 2018; Morelli, 2023).
Many aspects of a person’s life contribute to their
health status, quality of life, and life expectancy.
Studies have identified non-medical factors that
influence health outcomes such as economic stability,
education access and quality, healthcare access and
quality, social and community context, and
environment, which are referred to as Social
Determinants of Health (SDoH) (Hacker et al., 2022).
Specific examples of SDoH include working life
conditions, food insecurity, early childhood
development, structural conflict, social inclusion, and
non-discrimination. SDoH contributes to the presence
of health disparities and inequalities in society as they
significantly impact well-being and quality of life.
Additionally, the mental and physical stress arising
from less-than-ideal SDoH can further compound any
existing health challenges. SDoH has significantly
impacted health outcomes more than genetic factors
or access to healthcare services (Hacker et al., 2022).
Research has shown that up to 72% of deaths are
attributable to social determinants such as income,
education, and employment, whereas medical care is
responsible for eliminating only 10 to 15% of
preventable deaths (Morelli, 2023; Stringhini et al.,
2010). Addressing SDoH is essential for promoting
equity, preventing diseases, improving overall well-
being, and creating a healthcare system that is
effective, efficient, and accessible to all.
Healthcare providers recognize the impact of
SDoH and are encouraged to screen patients and
provide interventions to help address SDoH.
However, there are many barriers that prevent
healthcare professionals from providing interventions
referrals in actual medical practice. Common
challenges reported by physicians include lack of
time, lack of training and resources, and lack of
compensation (Morelli, 2023). Recent advancements
in large language models (LLM) show promise in the
ability to utilize unstructured data such as clinical
patient notes written by healthcare providers to
extract pertinent information. This capability can play
a crucial role in recognizing and addressing SDoH
which is essential for mitigating inequalities and
enhancing patient health outcomes.
The opioid crisis represents one of the most
devastating public health challenges of our time, with
its impact reverberating across communities,
healthcare systems, and economies. The intricate
nature of opioid use disorder (OUD) necessitates a
multifaceted approach to detection, treatment, and
prevention. SDoH significantly influences the
development, progression, and management of OUD.
Socioeconomic status, access to healthcare, lack of
social support, and housing instability are common
factors that play a role in OUD (Sadana & Blas,
2013). In this landscape, EHRs emerge as a pivotal
resource. These digital repositories, detailing patient
interactions, treatments, and outcomes, are a
goldmine for insights into patient health trajectories
and potential indicators of OUD (Li, Chok, Cui, et al.,
2023). However, the utilization of EHRs in
combating OUD is not without its challenges. The
traditional methods of data extraction and
interpretation are often constrained by their reliance
on structured data, neglecting the rich tapestry of
unstructured clinical narratives embedded within
EHRs. These narratives, if harnessed correctly, hold
the key to understanding the nuanced patient stories
that structured data alone cannot tell.
By combining artificial intelligence (AI) with
natural language processing (NLP) methods, clinical
progress notes can be text-mined and used to explore
unstructured data. NLP is an area of computer science
that consists of studying, identifying, and retrieving
the human language in its natural form to extract
information (Chowdhury, 2003; Roosan, 2023). NLP
integrated with various AI methods can be used to
verify, extract, and analyze information from
unstructured datasets, as can be seen in multiple
successful studies (Chu et al., 2018; Hernandez-
Boussard et al., 2019; Hong et al., 2018; Jagannatha
& Yu, 2016; Sung et al., 2018). Utilizing prompt
engineering and LLMs such as Bidirectional Encoder
Representations from Transformers (BERT), an AI-
based method can be created to help medical
providers detect SDoH and form strategies to address
health disparities.
BERT is an NLP pre-training technique and
model developed by Google. Unlike previous models
that read the text in a unidirectional manner, BERT
DATA 2024 - 13th International Conference on Data Science, Technology and Applications
16

utilizes “masked language model” (MLM) to read
text bi-directionally. This key innovation allows for
the capture of richer contextual information and a
better understanding of the nuances of language. The
two steps in the framework for BERT are pre-training
and fine-tuning. During pre-training, “the model is
trained on unlabeled data over different pre-training
tasks” while during fine-tuning, “all of the parameters
are fine-tuned using labeled data from the
downstream tasks” using the same architectures
except for the output layer (Devlin et al., 2019).
BERT is the first NLP technique to utilize self-
attention mechanism exclusively but it is also pre-
trained in masked language modeling and next
sentence prediction. These features allow for
downstream tasks such as Question Answering and
Natural Language Interference. Leveraging the
capabilities of BERT, healthcare providers can
process larger volumes of data and text from clinical
patient notes for faster analysis, predict potential
SDoH, detect OUD with accuracy, and facilitate the
necessary interventions and referrals.
This is where the integration of AI and NLP marks
a paradigm shift. AI and NLP technologies have
unlocked new possibilities in data analytics, offering
sophisticated tools to delve into and decipher the
complex language of clinical narratives. The
application of these technologies in analyzing EHRs
signifies a transformative approach to identifying
OUD, moving beyond the limitations of structured
data to a more holistic understanding of patient
profiles (Roosan, Clutter, et al., 2022). Advanced
NLP techniques, particularly those powered by
cutting-edge language models like GatorTron, are at
the forefront of this transformation. These models,
trained on vast datasets, excel in interpreting the
intricacies of clinical language, offering
unprecedented insights into patient conditions,
behaviors, and risk factors associated with OUD. By
harnessing the potential of AI and NLP, healthcare
professionals are equipped with powerful analytical
tools, enabling them to pinpoint signs of OUD early
in the patient journey. This not only paves the way for
timely interventions but also opens up new avenues
for personalized treatment strategies, tailored to the
unique needs and circumstances of each patient.
In this context, the current study aims to leverage
the prowess of AI and NLP in transforming the
landscape of OUD detection and intervention.
Through a meticulous analysis of EHRs, the study
seeks to unveil the subtle patterns and indicators of
OUD, hidden within the depths of clinical narratives.
The ultimate goal is to provide healthcare
practitioners with a robust, data-driven toolkit,
empowering them to make informed decisions, devise
effective treatment plans, and offer comprehensive
care to those grappling with OUD. In doing so, the
study aspires to contribute to a broader effort to
mitigate the impact of the opioid crisis, fostering a
healthcare environment where technology and human
expertise converge to safeguard and enhance patient
wellbeing.
In this study, we created a BERT-based NLP
method to detect opioid disorder from EHRs of the
Emanate Health System and created dashboard
analytics using an innovative NLP model.
2
METHODS
The study took place at Emanate Health and was
approved by the Institutional Review Board at
Western University of Health Sciences.
2.1 BERT-Based NLP Creation
2.1.1 Model Creation
For model creation, the BERT-based NLP model is
customized for the healthcare domain. This involves
adapting the pre-trained BERT model to understand
medical terminology and patient narratives. Pre-
processing steps include tokenization of text, where
clinical notes are broken down into tokens
understandable by the model. Special attention is
given to the handling of medical jargon, ensuring the
model can interpret terms accurately. The pre-
processing also includes context preservation,
ensuring that the sequence of words and their clinical
significance are maintained.
2.1.2 Datasets
Datasets are meticulously curated from de-identified
EHRs. Structured data, including demographic
details, diagnosis codes, and medication logs, are
combined with unstructured data, such as physician's
notes and patient narratives. Data cleaning involves
removing any irrelevant information and
standardizing medical terms to a common format.
Privacy concerns are paramount, with all patient-
identifiable information removed. The dataset is then
divided into training, validation, and test sets,
ensuring a balanced representation of various patient
demographics and medical scenarios.
Artificial Intelligence-Powered Large Language Transformer Models for Opioid Abuse and Social Determinants of Health Detection for the
Underserved Population
17

2.1.3 Model Training
In model training, BERT is first pre-trained on a large
corpus of general language to understand basic
language constructs. It is then fine-tuned on the
healthcare-specific dataset, allowing the model to
adapt to the nuances of medical language. During
training, the model learns to identify linguistic
patterns and clinical indications of opioid use
disorder. Techniques such as cross-validation are
employed to ensure the model's robustness and ability
to generalize. Hyperparameter tuning is conducted to
optimize model performance, adjusting parameters
like learning rate, batch size, and the number of
training epochs.
2.1.4 Training Environment
For the training of the BERT-based NLP model,
Amazon EC2 P4d instances powered by NVIDIA
A100 Tensor Core GPUs were utilized, providing a
highly optimized environment for machine learning
workloads. These instances offer high-performance
computing, substantial memory, and high-speed
networking, which are essential for large-scale model
training. The EC2 infrastructure also supports elastic
scalability, allowing the training environment to be
tailored to the model's needs, ensuring efficient
resource utilization and reduced training time. The
integration with AWS services streamlines the model
deployment and management process, fostering an
agile and robust training pipeline.
2.1.5 Model Evaluation
The final step is model evaluation, where the trained
model's performance is rigorously tested using
unseen data. Evaluation metrics are carefully chosen
to reflect the model's accuracy and its ability to
identify true cases of opioid use disorder. Precision
and recall are particularly important in the medical
context to minimize false positives and negatives.
The model's interpretability is also assessed, ensuring
that healthcare professionals can understand and trust
the model's predictions. Feedback from domain
experts is incorporated to refine the model further,
ensuring its practical applicability in a clinical setting.
In our methodology, the incorporation of ICD-10
codes is instrumental for the precise detection of
opioid-related instances from both structured and
unstructured datasets. The structured data employs
these codes directly, identifying patient records
linked with opioid usage, while in unstructured data,
NLP techniques like Named Entity Recognition
locate
and
interpret
these
codes
within
clinical
narratives. This dual approach, integrated into the
BERT-based model's feature set, significantly
enriches its learning, harnessing the standardized
ICD-10 framework to bolster the model's predictive
accuracy in identifying opioid-related abuse within
EHRs.
Table 1: Terms used to mine and train the BERT model.
Cate
g
or
y
Terms
Opioid
Terms
morphine, oxycodone, hydrocodone,
fentanyl, heroin, methadone, tramadol,
buprenorphine, codeine,
dihydrocodeine, hydromorphone,
oxymorphone, percocet, vicodin, lortab,
meloxicam, kratom, carfentanil,
naloxone, naltrexone,
pentazocine, tapentadol
Disorder
Terms
addiction, withdrawal, dependency,
misuse, abuse, overuse, craving, taper,
detox, overdose, substance
use disorder, polysubstance abuse,
intravenous drug use/abuse
Specific
NLP
Terms
tokenization, lemmatization, named
entity recognition, sentiment analysis,
topic modeling, parsing, classification,
negation detection, regular expression
searches, entity resolution
2.2 Dashboard Analytics Creation
2.2.1 Dashboard Creation
There were three steps to create the dashboard. The
first step began with understanding user requirements
using cognitive task analysis (CTA). In the second
step, the results from user requirements were utilized
to design the AI-based analytics dashboard for
visualizing unstructured data. Finally, a System
Usability Scale (SUS) survey was given to assess the
functionalities of the data analytics dashboard.
2.2.2 Cognitive Task Analysis
In this research, we used CTA to identify user
requirements to develop an efficient visualization
dashboard to organize patient data. We used cognitive
interview techniques for understanding requirements.
Interviews took place with 8 stakeholders including 5
nurses, and 3 pharmacists. A qualitative thematic
analysis was conducted iteratively by three
independent reviewers with healthcare backgrounds.
The content analysis was accomplished by
DATA 2024 - 13th International Conference on Data Science, Technology and Applications
18
initially reviewing the entire transcriptions, coding
the data, and creating an overall theme to encompass
the various codes (Islam et al., 2015). The analysis
was finalized through multiple sessions to refine the
selected themes. The themes were verified, and
discrepancies were discussed among the research
team until a consensus was reached.
2.2.3 Health Analytics Dashboard
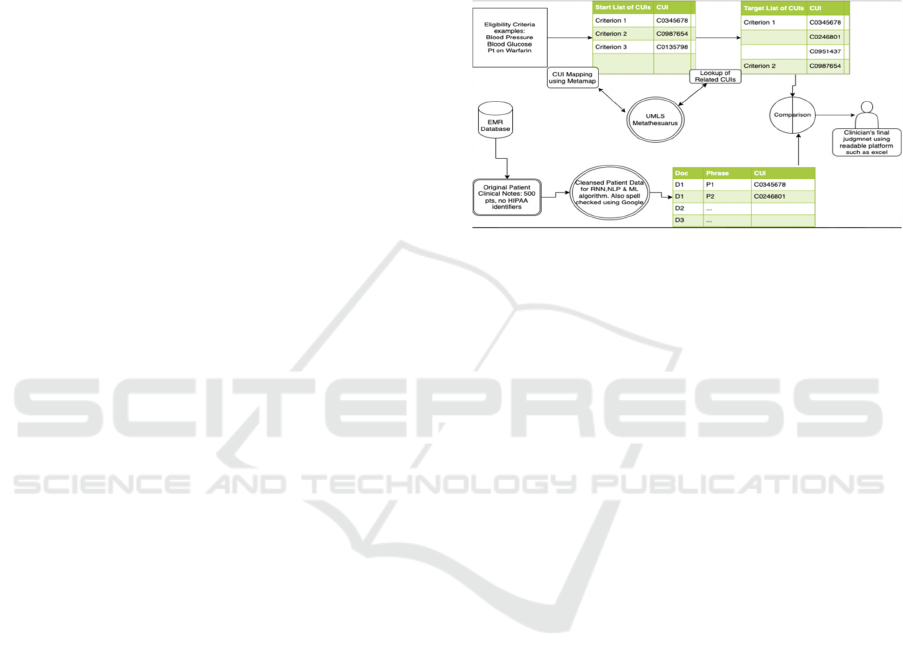
We collected data from EHR on 500 inactive patients
and removed all HIPAA identifiers. The dataset was
curated in an Excel file and cleaned using NLP and
AI algorithms. The details of this process are outlined
in Figure 1.
In this study, we used MetaMap, an NLP tool to
extract biomedical concepts from a free-front text
developed by the National Library of Medicine
(NLM) (Aronson, 2001). Our research team input text
into words or phrases through a lexical/syntactic
analysis including sentence boundary determination,
parts of speech tagging, parsing, and generating
variants of the phrase words. Using the United
Medical Language System (UMLS), MetaMap then
identifies all possible candidate terms to evaluate the
matched phrases retrieved in the previous process
based on measures of centrality, variation,
cohesiveness, and coverage. After categorizing, a
concept unique identified (CUI) with a score between
0 to 1000 on the strength of mapping is generated
(Aronson & Lang, 2010). A series of text
preprocessing identifies the CUIs from the EHR’s
dataset. We used Google’s spell checker API to
correct any misspelled words. We created a list with
the scoring system to apply the ML algorithm to the
dataset.
Recursive neural network (RNN) is a type of
artificial neural network with feedback features to
store memory and feedforward to learn and anticipate
the next output (Fine, 1996). We used a previously
validated context-specific recursive neural network
(CRNN) proven with high sensitivity and specificity
of texts. These networks can induce distributed
feature presentations for never seen words and texts.
Moreover, the CRNN model accurately predicts
phrase structure trees with syntactic information
(Socher et al., 2010). Using this model, our backend
data server created a pivot table of sparse texts with
scoring and created a loop learning method. Finally,
we used a Python script to pull the texts and
associated lab values to create the analytics
visualization dashboard. This visualization can utilize
the CRNN model to predict a specific patient’s trend
as well as show the past trend. For example, if a
patient has a high blood glucose level for the last 3
days, based on the ML model, our system can predict
blood glucose level in the next 3 days with more than
80% accuracy while using other clinical data. A
finalized data analytics dashboard using unstructured
data from a separate deidentified source was
presented to clinicians for feedback. The research
team incorporated all feedback in the design until no
further issues were identified.
Figure 1: The process of curating the dataset is outlined and
shown in this figure.
2.2.4 System Usability (SUS) Survey
Twenty participants were chosen to complete an SUS
survey. SUS is a 10-item questionnaire that studies
the user experience and reviews the platform for
design iterations. The survey contained a 5-point
Likert scale ranging from 1 = Strongly Disagree to 5
= Strongly Agree. The raw data was multiplied by 2.5
to get the final score between 0 and 100 (Mclellan et
al., 2011).
3
RESULTS
3.1 BERT-Based NLP Creation
3.1.1 Datasets
The datasets used are extensive, containing a
multitude of patient-related information. This
richness and diversity in data allow for a more
nuanced model training, ensuring that the model can
recognize a wide range of indicators related to opioid
use disorder. The inclusion of both structured and
unstructured data ensures that the model benefits from
the breadth (structured data) and depth (unstructured
narratives) of information available in EHRs.
3.1.2 Prediction Models
The BERT-based NLP model leverages the power of
Artificial Intelligence-Powered Large Language Transformer Models for Opioid Abuse and Social Determinants of Health Detection for the
Underserved Population
19
bidirectional context in understanding clinical
language, enabling it to discern subtle cues and
patterns indicative of opioid use disorder. This
context-awareness ensures that the model can make
predictions based on a comprehensive understanding
of the text, rather than isolated keyword recognition.
Important features include:
1.
Clinical Narratives: These provide in-depth,
qualitative insights into patient conditions,
offering a richer context for model predictions.
2.
Treatment Information: Detailed records of
medication and treatment histories offer crucial
signals for recognizing patterns of opioid use or
misuse.
3.
Patient Demographics: Demographic
information is crucial for understanding the
broader context of a patient's health and
potential risk factors.
4.
Diagnosis Codes: These standardized codes
help in categorizing and quantifying medical
conditions, providing a structured way to
assess patient health data.
Table 2: This table displays the demographics of people
with OUD in the current prediction model and the BERT-
based model.
Demographic
Feature
Current
Model
(n=795)
BERT
Model
(n=890)
Total
(n=1685)
Numbe
r
of
Patients
795 890 1685
Age (mean ± SD) 45 ± 15 50 ± 12 47.5 ± 13.7
Gender (%)
M: 55% M: 60% M: 57.5%
F: 45% F: 40% F: 42.5%
Moderate
Condition
60% 50% 55%
Severe Condition 40% 50% 45%
Comorbid
Diabetes (%)
20% 25% 22.5%
Comorbid
Hypertension(%)
30% 35% 32.5%
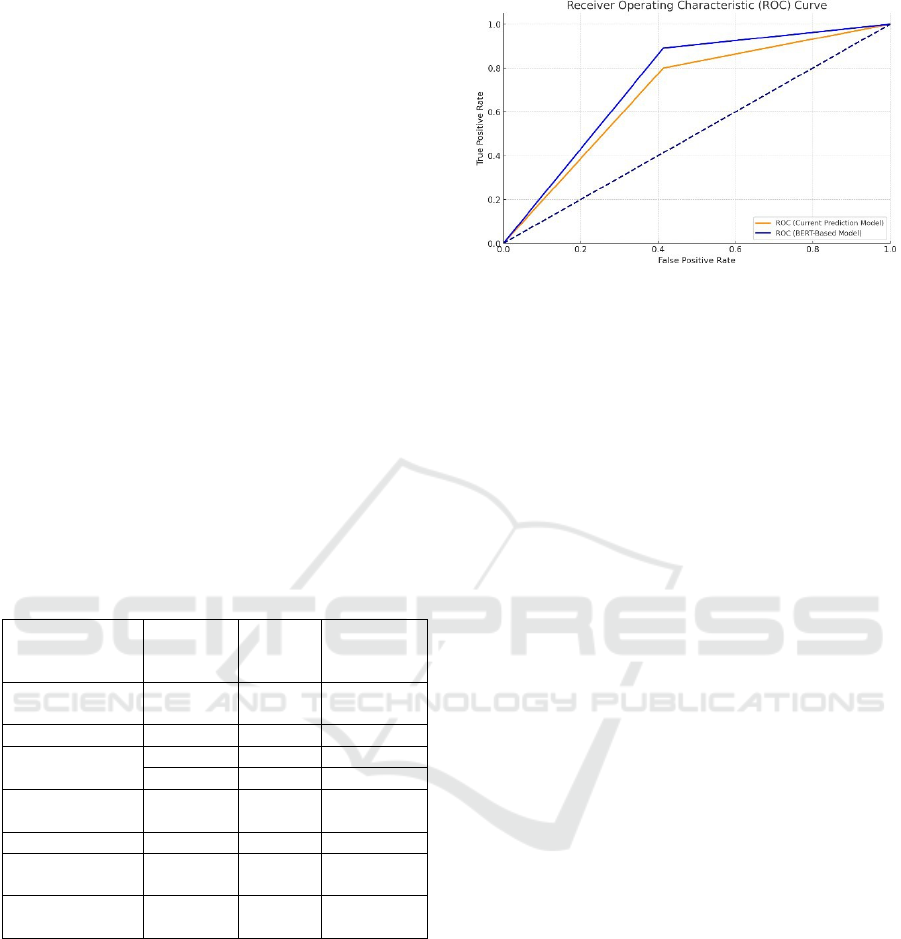
3.1.3 Comparative Analysis
The BERT-based model's high precision indicates a
low rate of false positives, crucial in medical settings
where misidentification can lead to improper
treatment. The improved recall signifies the model's
effectiveness in identifying true cases of opioid use
disorder, ensuring that high-risk patients are not
overlooked. The F1 score, being the harmonic mean
of precision and recall, confirms the model's balanced
performance in both aspects.
Figure 2: The Receiver Operating Characteristic (ROC)
curve based on the precision, recall, and F1 scores from the
table. The curve illustrates the performance of the Current
Prediction Model and the BERT-based Model in
distinguishing between prescription and non-prescription
data extracted from EHRs. The curves show how each
model performs in terms of the trade-off between true
positive rate (Recall) and false positive rate, providing a
visual representation of their predictive capabilities. The
model showed better efficacy in predicting opioid abuse
than just prescription data.
3.2 Dashboard Analytics Creation
3.2.1 Cognitive Task Analysis
The coded themes and examples are outlined in Table
1) Responses to questions were similar across all
stakeholders. Five overarching themes were
identified including 1) gathering patient
information,
2) filtering and searching for necessary information,
3) subjective, objective, assessment, and plan, 4)
visualization of unstructured EHR data, and 5)
trends of patient progression and comparisons in
graphs.
For the current workflow, all interviewees are
required to know patient's diagnosis and
demographics, insurance status, and side effects of
medications. However, it is difficult to find the
necessary information from the current EHR due to
disjointed information. Instead of manually searching
for each piece of information, the workflow allowed
a single place to view and verify patient information.
To improve workflow, stakeholders desired the
ability to quickly vet information through pulling and
filtering free text information. Manually reading
through every single progress and chart note is time-
consuming. Thus, the code selected for an easier
workflow was to filter and search for necessary
information. Stakeholders mentioned this would save
time and provide the ability to stratify patients,
ultimately improving workload and workflow.
Stakeholders desired a platform where they could
DATA 2024 - 13th International Conference on Data Science, Technology and Applications
20
easily see unstructured patient data and any trends in
patient progress. Stakeholders mentioned the current
method of displaying patient information involves
utilizing multiple pages. Instead, they suggested
visualizing all patient information in one place with
multiple patients as a table format, charts, or graphs.
Table 3: The table compares the performance of traditional
prediction models with the newly developed BERT-based
model in terms of precision, recall, and F1 score.
Model Precision Recall F1 Score
Current Model
0.85 0.80 0.82
BERT-Based
Model
0.92 0.89 0.90
The BERT-based model exhibits superior
performance across all metrics, highlighting its
effectiveness in accurately identifying opioid use
disorder from EHRs. The improvement in precision
and recall demonstrates the model's ability to
minimize false positives and false negatives, ensuring
reliable and accurate predictions.
3.2.2 Health Analytics Dashboard
The developed dashboard included three main
functionalities. First, the machine learning algorithm
processed unstructured EHR data and parsed it into
meaningful information. The visualized information
can help clinicians understand patient severity and
acuity in a single snapshot. Second, visualization
snapshots of patient progress use clear graphics and
visual tools to instantly comprehend the patient’s lab
trends and testing results. The AI algorithm can also
display a subset of patients based on factors such as
race or ethnicity. Third, the data from the platform
can be downloaded into any file format such as a
Microsoft Excel sheet or CSV file for further use and
analysis.
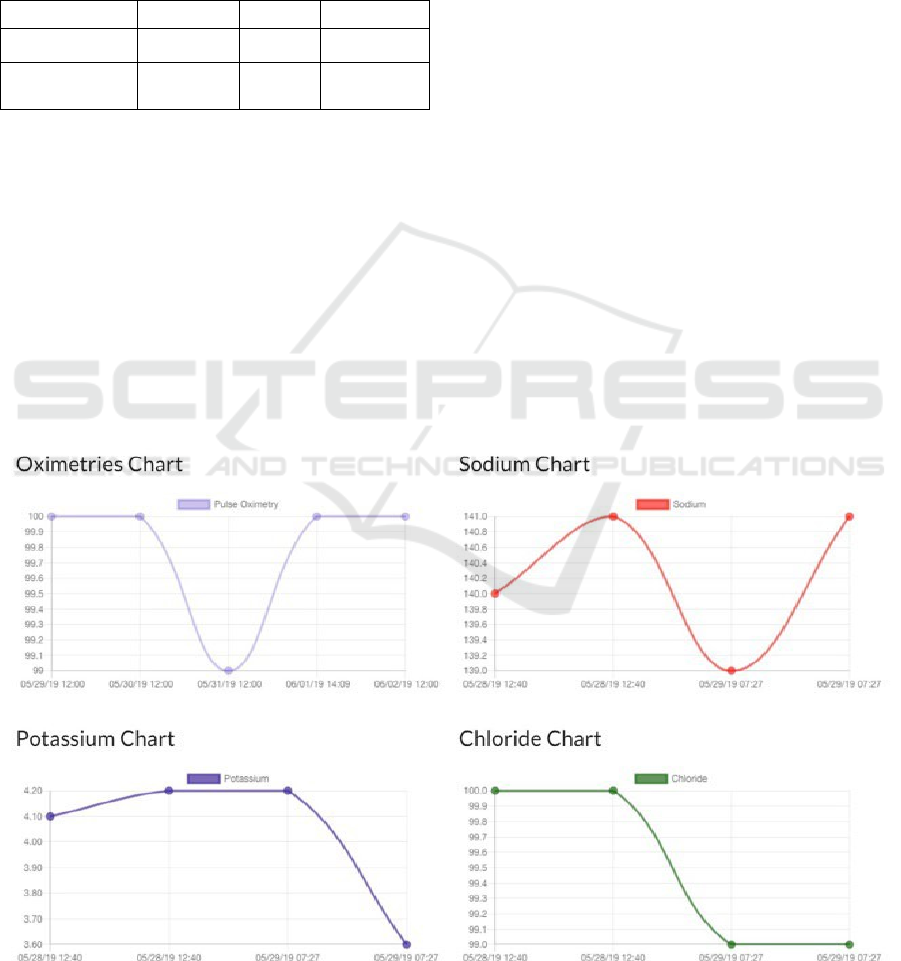
Figure 3 presents snapshots of the platform.
Figure 3 were created in response to multiple
comments regarding the ability to visualize trends in
vitals and laboratory values in one place instead of
navigating through multiple areas of the EHR to find
data. Clinicians and nurses can view any trends and
make appropriate interventions as necessary. For each
patient, trends were depicted as scattered plots
connected with lines. In the search bar of the
developed dashboard, clinicians can type in certain
measures such as “blood pressure >120” to quickly
identify patients who have elevated blood pressure
requiring intervention. Figure 4 portrays an instance
of a clinician searching for patients who take
warfarin, an anticoagulant medication notorious for
its many interactions and potential adverse events.
The search results include categorization of
patients who are currently on warfarin and patients
Figure 3: Features of the developed dashboard to increase efficiency and improve workflow can be seen in Figure 3.
Artificial Intelligence-Powered Large Language Transformer Models for Opioid Abuse and Social Determinants of Health Detection for the
Underserved Population
21
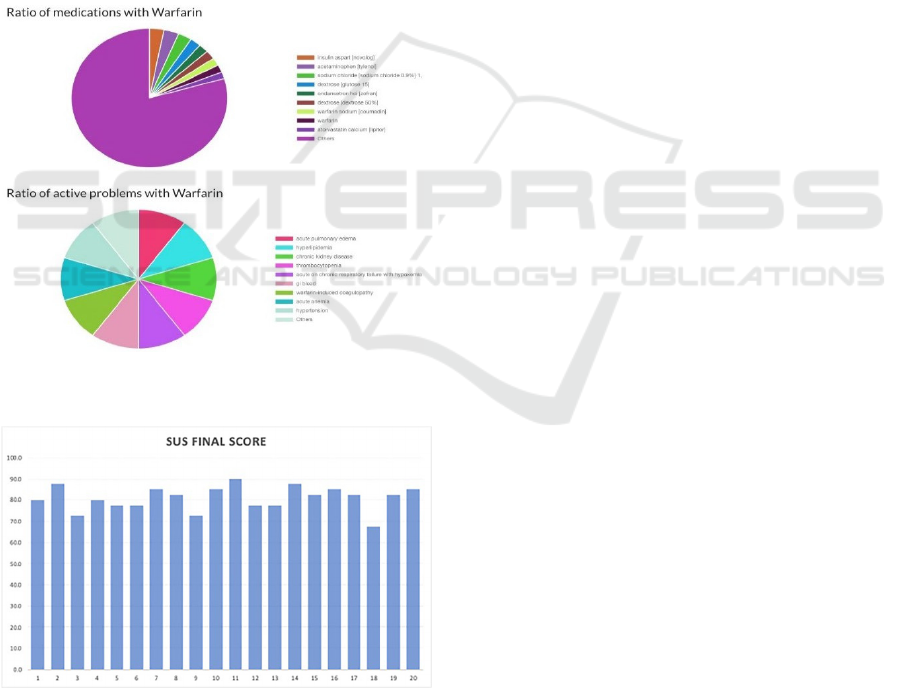
who have active problems from taking warfarin. The
results are represented in a pie chart and include the
percentage of patients on other concomitant
medications such as insulin and atorvastatin. This
feature allows clinicians to view and assess potential
drug-drug interactions and adverse drug events,
which is particularly useful in monitoring patients on
medications such as warfarin. Problems that patients
on warfarin commonly experience also include
hypertension, anemia, and active bleeding. Users can
also search for other medications to see the impact on
the patient population.
The visualization utilized the CRNN model to
make predictions of patient-specific trends based on
their past trends. For example, if a patient has a blood
glucose level of 160 for the last 3 days, based on the
ML model, our system can predict blood glucose
level in the next 3 days with more than 80% accuracy.
Figure 4: Features of the developed dashboard that allows
for the search of patients on specific medications.
Figure 5: Individual results of the SUS survey from all 20
participants.
3.2.3 System Usability Scale (SUS) Survey
Participants of the SUS survey included clinicians,
pharmacy coordinators, nurses, hospital
administrators, and social case workers. Of the 20
participants, 14 were female and 6 were male. All 20
participants completed the SUS survey. The average
raw score was 32.35 and the average final score was
80.9 with a standard deviation of 5.69. The individual
scores are graphed as shown in Figure 5.
4
DISCUSSIONS
In the realm of healthcare informatics, the
incorporation of a BERT-based NLP model to discern
OUD from EHRs signifies a monumental stride in the
domain of data-driven healthcare interventions. The
empirical evidence presented, denoting superior
precision, recall, and F1 scores of the BERT-based
model relative to its traditional counterparts, not only
reaffirms the model's efficacy but also broadens the
horizon for AI's application in healthcare, particularly
in the intricate sphere of substance abuse detection
and management. Our model also demonstrated great
success in detecting and visualizing the social
determinants of health from unstructured datasets for
underserved populations.
The model's proficiency, particularly evident
through the AUC-ROC curve, underscores its
capability in meticulously distinguishing between
prescription and non-prescription data entries, a
crucial distinction in the context of OUD where the
delineation between therapeutic use and potential
abuse is often nuanced. The precision of the model
serves as a bulwark against the high costs—both
human and material—associated with false positives
in medical diagnostics. Concurrently, the
commendable recall rate ensures the identification of
at-risk individuals, thus playing a pivotal role in
curtailing the progression of OUD and its
concomitant healthcare repercussions.
This study sheds light on the paramount
importance of leveraging sophisticated NLP
techniques to decode the wealth of information
ensconced in unstructured clinical narratives, a facet
often overlooked by models preoccupied with
structured data. The ability of the BERT model to
contextually parse and analyze unstructured data is
indicative of a broader shift towards a more
comprehensive and integrative approach in healthcare
data analytics (Green et al., 2023).
The ramifications of this research for future
algorithmic developments in healthcare are profound.
The success of the BERT-based model not only paves
the way for the integration of more nuanced AI
models in healthcare but also propels the field
DATA 2024 - 13th International Conference on Data Science, Technology and Applications
22

towards predictive analytics, wherein models could
potentially forecast the onset of OUD based on subtle,
longitudinal patient data trends (Roosan, Padua, et al.,
2023). The universality of the model's underlying
principles and methodologies holds the promise of
transformative applications across a myriad of
healthcare domains, heralding an era of personalized
and pre-emptive healthcare solutions (Green et al.,
2023). However, the deployment of such advanced AI
models in healthcare is not devoid of challenges.
Issues pertaining to data privacy, the interpretability
of models, and the imperative for comprehensive and
diverse training datasets necessitate meticulous
attention. The ethical deployment of AI, safeguarding
patient confidentiality, and ensuring transparency in
model predictions are foundational to this
technological evolution in healthcare (Roosan, Wu, et
al., 2022). Moreover, such models can be utilized to
understand genomics data to improve health equity
among underserved populations (Roosan, Chok, et
al., 2023; Roosan, Wu, et al., 2023; Y. Wu et al.,
2024).
Moving forward, it is paramount to harness this
momentum, addressing the inherent challenges while
capitalizing on the opportunities presented by AI and
NLP, to cultivate a healthcare ecosystem that is more
adaptive, more personalized, and more efficacious in
addressing patient needs (Li, Phan, Law, et al., 2023;
Y. Wu et al., 2024). This exploration is not the
culmination but rather the commencement of an
exciting journey in the integration of AI in healthcare,
a journey replete with the potential for profound and
positive transformation.
Previous studies developed analytics dashboards
from population data for research in various settings
(Roosan et al., 2016, 2017). One particular study used
data from EHRs to better study cancer registries (Cha
et al., 2019). Other studies mined data for
pharmacovigilance, phenotyping genetic diseases,
and mobile health technology (A. G. Agúndez &
García-Martín, 2022; Ross et al., 2014). However,
very few studies have considered user-friendly
interface designs while developing the systems. This
paper contributes to population-level unstructured
data literature by creating an AI with NLP based
approach to managing unstructured datasets with the
integration of results from the CTA. We were able to
successfully incorporate CTA results into our web-
based HIPAA-protected platform to efficiently
represent unstructured patient data. The ability to
search for medications would be a more effective way
for clinicians to monitor patients and select patients
who need to be closely observed. For instance, the
warfarin search would be useful not only to determine
the number of patients affected by warfarin but also
to provide monitoring parameters for these patients
with active problems. This key feature can potentially
be used with machine learning algorithms such as
aTarantula to extract ADE information from social
media and to further improve detection and
monitoring (Roosan, Law, et al., 2022). One of the
main issues stakeholders were concerned about the
current EHRs was that it was not easy to find patient
information all in one place. They had to sift through
multiple pages in different areas to find each piece of
information. Current EHR designs hold lab values in
the results section, but the results of EKGs and MRIs
might be stored either in the notes or images section.
Our web-based platform addressed stakeholders’
concerns efficiently. The SUS score totalled to 80.9
from 20 participants, which is interpreted as a high
score when compared to the average of 68. A score of
80.9 would be in the top 10 percentile describing a
high usability.
Data that is visually analyzed and presented can
not only impact providers but also patients and
population health. Using our innovative visualization
of unstructured data, clinicians can monitor patients
more effectively and efficiently. The research team
previously designed innovative games and
dashboards efficiently (Li, Chok, Chui, et al., 2023;
Li, Chok, Cui, et al., 2023).
The developed dashboard was strategically
selected to be web-based due to the accessibility of
health information exchange (HIE). HIE is the ability
to exchange patient information in a secure manner to
promote efficient patient care and interoperability.
The contemporary fragmented healthcare system in
the United States and different EHR companies result
in the inability to exchange information. Health data
standards are a crucial element for data sharing which
range from genomics to clinical data (Roosan,
Hwang, et al., 2020; Roosan, Chok, et al., 2023). As
a result, health information is not easily obtainable or
transferrable through technology. Interoperability
would not only improve patient care, and continuity
of care, and reduce the administrative burden on
practitioners, but it would also provide a more precise
picture for real-world research. Standards exist for
EHR messaging including HL7 Clinical Document
Architecture (CDA) and HL7 Fast Healthcare
Interoperability Resources (FHIR) (Dolin et al., 2001;
Index - FHIR v5.0.0, n.d.; Karwowski, 2005; Roosan,
Chok, et al., 2020, 2022; Roosan, Hwang, et al.,
2020). However, established standards have yet to
provide an all-inclusive method for every type of data
in EHRs (Roosan et al., 2021). Although the study
concludes that more work is required for a fully
Artificial Intelligence-Powered Large Language Transformer Models for Opioid Abuse and Social Determinants of Health Detection for the
Underserved Population
23

capable interoperable system, it provides insight into
a feasible method. Thus, our developed dashboard
data is interoperable and shareable across multiple
EHR vendors.
5
LIMITATIONS
Despite its innovative approach, this project faces
limitations such as potential biases in EHR data, the
need for extensive computational resources for model
training, and challenges in the interpretability of the
BERT-based model's decisions. Moreover, changes
in medical coding practices over time could affect the
model's applicability and the generalizability of the
findings may be limited by the specific characteristics
of the dataset used.
There were two main limitations to our data
analytics dashboard. The first limitation is that the
backend data from the dashboard did not
automatically transfer data from the EHR.
Unstructured data was pulled separately and
integrated into the dashboard. The second limitation
is the lack of analytical features since the dashboard
was not directly connected to the EHR. For example,
physicians would not be able to open the EHR to view
patients’ records through the dashboard.
6
CONCLUSIONS
Within the landscape of healthcare informatics, the
integration of a BERT-based NLP model for
distinguishing OUD within EHRs marks a
momentous leap forward in the realm of data-driven
healthcare interventions. This innovative approach
not only streamlines the identification process but
also holds the potential to enhance treatment
strategies and patient outcomes by providing
clinicians with invaluable insights gleaned from vast
amounts of patient data. The utilization of advanced
NLP techniques like BERT represents a powerful tool
in the ongoing efforts to harness the wealth of
information within EHRs for more effective and
personalized healthcare delivery.
We successfully developed web-based dashboard
analytics from unstructured data to provide
visualizations to support clinician workflow through
AI and NLP methods. The visualizations for the
dashboard were designed based on a CTA. The results
from CTA were used to create the design of the
interface including word searches for patients on
certain medications or specific clinical markers,
graphical representations of patient progress, and a
single page for patient status. The SUS survey was
completed by 20 participants, with a score of 80.9,
which was a high usability. The AI-based dashboard
demonstrated an intuitive interface displaying
unstructured data to support our clinicians in directly
improving patient care.
REFERENCES
A. G. Agúndez, J., & García-Martín, E. (2022). Insights in
Pharmacogenetics and Pharmacogenomics: 2021.
Frontier Media SA. https://doi.org/ 10.3389/978-2-
88976-103-6
Aronson, A. R. (2001). Effective mapping of biomedical
text to the UMLS Metathesaurus: The MetaMap
program. Proceedings. AMIA Symposium, 17–21.
Aronson, A. R., & Lang, F.-M. (2010). An overview of
MetaMap: Historical perspective and recent advances.
Journal of the American Medical Informatics
Association: JAMIA, 17(3), 229–236. https://doi.org/
10.1136/jamia.2009.002733
Cha, H. S., Jung, J. M., Shin, S. Y., Jang, Y. M., Park, P.,
Lee, J. W., Chung, S. H., & Choi, K. S. (2019). The
Korea Cancer Big Data Platform (K-CBP) for Cancer
Research. International Journal of Environmental
Research and Public Health, 16(13), 2290.
https://doi.org/10. 3390/ijerph16132290
Chowdhury, G. G. (2003). Natural language processing.
Annual Review of Information Science and Technology,
37(1), 51–89. https://doi.org/10.1002/aris.1440370103
Chu, J., Dong, W., He, K., Duan, H., & Huang, Z. (2018).
Using neural attention networks to detect adverse
medical events from electronic health records. Journal
of Biomedical Informatics, 87, 118–130. https://doi.org/
10.1016/j.jbi.2018.10.002
Collins, F. S., Morgan, M., & Patrinos, A. (2003). The
Human Genome Project: Lessons from Large-Scale
Biology. Science, 300(5617), 286–290.
https://doi.org/10.1126/ science.1084564
Desautels, T., Calvert, J., Hoffman, J., Jay, M., Kerem, Y.,
Shieh, L., Shimabukuro, D., Chettipally, U., Feldman,
M. D., Barton, C., Wales, D. J., & Das, R. (2016).
Prediction of Sepsis in the Intensive Care Unit with
Minimal Electronic Health Record Data: A Machine
Learning Approach. JMIR Medical Informatics, 4(3),
e28. https://doi.org/10.2196/medinform.5909
Devlin, J., Chang, M.-W., Lee, K., & Toutanova, K. (2019).
BERT: Pre-training of Deep Bidirectional
Transformers for Language Understanding (arXiv:
1810.04805). arXiv. https://doi.org/10.48550/arXiv.
1810.04805
Dolin, R. H., Alschuler, L., Beebe, C., Biron, P. V., Boyer,
S. L., Essin, D., Kimber, E., Lincoln, T., & Mattison, J.
E. (2001). The HL7 Clinical Document Architecture.
Journal
of
the American Medical
Informatics
Association, 8(6), 552–569. https://doi.org/10.1136/
jamia. 2001.0080552
DATA 2024 - 13th International Conference on Data Science, Technology and Applications
24

Fiks, A. G., Grundmeier, R. W., Margolis, B., Bell, L. M.,
Steffes, J., Massey, J., & Wasserman, R. C. (2012).
Comparative Effectiveness Research Using the
Electronic Medical Record: An Emerging Area of
Investigation in Pediatric Primary Care. The Journal of
Pediatrics, 160(5), 719–724. https://doi.org/10.1016/j.
jpeds.2012.01.039
Fine, T. L. (1996). Fundamentals of Artificial Neural
Networks [Book Reviews]. IEEE Transactions on
InformationTheory, 42(4), 1322. https://doi.org/10.
1109/TIT.1996.508868
Green, T., Ponzetto, S. P., & Glavaš, G. (2023). Massively
Multilingual Lexical Specialization of Multilingual
Transformers. In A. Rogers, J. Boyd-Graber, & N.
Okazaki (Eds.), Proceedings of the 61st Annual
Meeting of the Association for Computational
Linguistics (Volume 1: Long Papers) (pp. 7700–7715).
Association for Computational Linguistics.
https://doi.org/10.18653/v1/2 023.acl-long.426
Hacker, K., Auerbach, J., Ikeda, R., Philip, C., & Houry, D.
(2022). Social Determinants of Health—An Approach
Taken at CDC. Journal of Public Health Management
and Practice, 28(6), 589. https://doi.org/10.1097/
PHH.0000000000001626
Hernandez-Boussard, T., Monda, K. L., Crespo, B. C., &
Riskin, D. (2019). Real world evidence in
cardiovascular medicine: Ensuring data validity in
electronic health record-based studies. Journal of the
American Medical Informatics Association, 26(11),
1189–1194. https://doi.org/10.1093/jamia/ocz119
Hong, N., Wen, A., Shen, F., Sohn, S., Liu, S., Liu, H., &
Jiang, G. (2018). Integrating Structured and
Unstructured EHR Data Using an FHIR-based Type
System: A Case Study with Medication Data. AMIA
Joint Summits on Translational Science Proceedings.
AMIA Joint Summits on Translational Science, 2017,
74–83.
Index—FHIR v5.0.0. (n.d.). Retrieved January 24, 2024,
from https://www.hl7.org/fhir/
Islam, R., Mayer, J., & Clutter, J. (2016). Supporting novice
clinicians cognitive strategies: System design
perspective. 2016 IEEE-EMBS International
Conference on Biomedical and Health Informatics
(BHI), 509–512. https://doi.org/10.1109/BHI.2016.74
55946
Islam, R., Weir, C., & Del Fiol, G. (2016). Clinical
Complexity in Medicine: A Measurement Model of
Task and Patient Complexity. Methods of Information
in Medicine, 55(1), 14–22.
https://doi.org/10.3414/ME15-01-0031
Islam, R., Weir, C., & Fiol, G. D. (2014). Heuristics in
Managing Complex Clinical Decision Tasks in
Experts’ Decision Making. 2014 IEEE International
Conference on Healthcare Informatics, 186–193.
https://doi.org/ 10.1109/ICHI.2014.32
Islam, R., Weir, C. R., Jones, M., Del Fiol, G., & Samore,
M. H. (2015). Understanding complex clinical
reasoning in infectious diseases for improving clinical
decision support design. BMC Medical Informatics and
Decision Making, 15(1), 101.
https://doi.org/10.1186/s12911-015-0221-z
Jagannatha, A. N., & Yu, H. (2016). Bidirectional RNN for
Medical Event Detection in Electronic Health Records.
Proceedings of the Conference. Association for
Computational Linguistics. North American Chapter.
Meeting, 2016, 473–482. https://doi.org/10.18653
/v1/n16-1056
Karwowski, W. (2005). Ergonomics and human factors:
The paradigms for science, engineering, design,
technology and management of human-compatible
systems. Ergonomics, 48(5), 436–463.
https://doi.org/10.1 080/00140130400029167
Kharrazi, H., Anzaldi, L. J., Hernandez, L., Davison, A.,
Boyd, C. M., Leff, B., Kimura, J., & Weiner, J. P.
(2018). The Value of Unstructured Electronic Health
Record Data in Geriatric Syndrome Case Identification.
Journal of the American Geriatrics Society, 66(8),
1499–1507. https://doi.org/10.1111/jgs.15411
Klompas, M., Eggleston, E., McVetta, J., Lazarus, R., Li,
L., & Platt, R. (2013). Automated Detection and
Classification of Type 1 Versus Type 2 Diabetes Using
Electronic Health Record Data. Diabetes Care, 36(4),
914–921. https://doi.org/10.2337/dc12-0964
Kong, H.-J. (2019). Managing Unstructured Big Data in
Healthcare System. Healthcare Informatics Research,
25(1), 1. https://doi.org/10.4258/hir.2019.25.1.1
Li, Y., Chok, J., Chui, G., Roosan, D., & Shultz, K. (2023).
Factors Associated with Electronic Health Record
Adoption Among Adult Day Services in the US.
Innovation in Aging, 7 (Supplement_1), 31.
https://doi.org/10.1093/geroni/igad 104.0103
Li, Y., Chok, J., Cui, G., Roosan, D., & Shultz, K. (2023).
Electronic health record adoption among adult day
services: Findings from the national study of long-term
care providers. Journal of the American Geriatrics
Society, 71(12), 3941–3943. https://doi.org/10.1111
/jgs.18549
Li, Y., Phan, H., Law, A. V., Baskys, A., & Roosan, D.
(2023). Gamification to Improve Medication
Adherence: A Mixed-method Usability Study for
MedScrab. Journal of Medical Systems, 47(1), 108.
https://doi. org/10.1007/s10916-023-02006-2
Mclellan, S., Muddimer, A., & Peres, S. (2011). The Effect
of Experience on System Usability Scale Ratings.
Journal of Usability Studies, 7.
Morelli, V. (2023). Social Determinants of Health: An
Overview for the Primary Care Provider. Primary
Care: Clinics in Office Practice, 50(4), 507–525.
https://doi.org/10.1016/j.pop.2023.04.004
Raghupathi, W., & Raghupathi, V. (2014). Big data
analytics in healthcare: Promise and potential.
Health
Information Science and Systems, 2(1), 3.
https://doi.org/10.1 186/2047-2501-2-3
Roosan, D. (2023). Augmented Reality and Artificial
Intelligence: Applications in Pharmacy. In V.
Geroimenko (Ed.), Augmented Reality and Artificial
Intelligence: The Fusion of Advanced Technologies
(pp.227–243). Springer Nature Switzerland.
https://doi.org/10.1007/978-3-031-27166-3_13
Artificial Intelligence-Powered Large Language Transformer Models for Opioid Abuse and Social Determinants of Health Detection for the
Underserved Population
25

Roosan, D., Chok, J., Baskys, A., & Roosan, M. R. (2022).
PGxKnow: A pharmacogenomics educational
HoloLens application of augmented reality and
artificial intelligence. Pharmacogenomics, 23(4), 235–
245. https://doi.org/10.2217/pgs-2021-0120
Roosan, D., Chok, J., Karim, M., Law, A. V., Baskys, A.,
Hwang, A., & Roosan, M. R. (2020). Artificial
Intelligence–Powered Smartphone App to Facilitate
Medication Adherence: Protocol for a Human Factors
Design Study. JMIR Research Protocols, 9(11),
e21659. https://doi.org/10.2196/21659
Roosan, D., Chok, J., Nersesian, T., Li, Y., Law, A., & Li,
Y. (2023). Development of a dashboard analytics
platform for dementia caregivers to understand
diagnostic test results [Preprint]. In Review.
https://doi.org/10. 21203/rs.3.rs-3032181/v1
Roosan, D., Clutter, J., Kendall, B., & Weir, C. (2022).
Power of Heuristics to Improve Health Information
Technology System Design. ACI Open, 06(2), e114–
e122. https://doi.org/10.1055/s-0042-1758462
Roosan, D., Del Fiol, G., Butler, J., Livnat, Y., Mayer, J.,
Samore, M., Jones, M., & Weir, C. (2016). Feasibility
of population health analytics and data visualization for
decision support in the infectious diseases domain: A
pilot study. Applied Clinical Informatics, 07(02), 604–
623. https://doi.org/10.4338/ACI-2015-12-RA-0182
Roosan, D., Hwang, A., Law, A. V., Chok, J., & Roosan,
M. R. (2020). The inclusion of health data standards in
the implementation of pharmacogenomics systems: A
scoping review. Pharmacogenomics, 21(16), 1191–
1202. https://doi.org/10.2217/pgs-2020-0066
Roosan, D., Hwang, A., & Roosan, M. R. (2021).
Pharmacogenomics cascade testing (PhaCT): A novel
approach for preemptive pharmacogenomics testing to
optimize medication therapy. The Pharmacogenomics
Journal,
21(1),
1–7.
https://doi.org/10.1038/s41397-
020-00182-9
Roosan, D., Law, A. V., Roosan, M. R., & Li, Y. (2022).
Artificial Intelligent Context-Aware Machine-Learning
Tool to Detect Adverse Drug Events from Social Media
Platforms. Journal of Medical Toxicology, 18(4).
https://doi.org/10.1007/s13181-022-00906-2
Roosan, D., Padua, P., Khan, R., Khan, H., Verzosa, C., &
Wu, Y. (2023). Effectiveness of ChatGPT in clinical
pharmacy and the role of artificial intelligence in
medication therapy management. Journal of the
American Pharmacists Association.
https://doi.org/10.1016/j.japh.2023.11.023
Roosan, D., Weir, C., Samore, M., Jones, M., Rahman, M.,
Stoddard, G. J., & Del Fiol, G. (2017). Identifying
complexity in infectious diseases inpatient settings: An
observation study. Journal of Biomedical Informatics,
71, S13–S21. https://doi.org/10.1 016/j.jbi.2016.10.018
Roosan, D., Wu, Y., Tatla, V., Li, Y., Kugler, A., Chok, J.,
&
Roosan,
M.
R.
(2022).
Framework
to
enable
pharmacist access to health care data using Blockchain
technology and artificial intelligence. Journal of the
American Pharmacists Association, 62(4), 1124–1132.
https://doi.org/10.1016/j.japh.2022.02.018
Roosan, D., Wu, Y., Tran, M., Huang, Y., Baskys, A., &
Roosan, M. R. (2023). Opportunities to integrate
nutrigenomics into clinical practice and patient
counseling. European Journal of Clinical Nutrition,
77(1), Article 1. https://doi.org/10.1038/s41430-022-
01146-x
Ross, M. K., Wei, W., & Ohno-Machado, L. (2014). “Big
Data” and the Electronic Health Record. Yearbook of
Medical Informatics, 23(01), 97–104. https://doi.org/
10.15265/IY-2014-0003
Sadana, R., & Blas, E. (2013). What Can Public Health
Programs Do to Improve Health Equity? Public Health
Reports, 128(6_suppl3), 12–20. https://doi.org/
10.1177/00333549131286S303
Socher, R., Manning, C., & Ng, A. (2010). Learning
Continuous Phrase Representations and Syntactic
Parsing with Recursive Neural Networks.
Stringhini, S., Sabia, S., Shipley, M., Brunner, E., Nabi, H.,
Kivimaki, M., & Singh-Manoux, A. (2010).
Association of socioeconomic position with health
behaviors and mortality. JAMA, 303(12), 1159–1166.
https://doi.org/1 0.1001/jama.2010.297
Sung, S.-F., Chen, K., Wu, D. P., Hung, L.-C., Su, Y.-
H.,& Hu, Y.-H. (2018). Applying natural language
processing techniques to develop a task-specific EMR
interface for timely stroke thrombolysis: A feasibility
study. International Journal of Medical Informatics,
112, 149–157.
https://doi.org/10.1016/j.ijmedinf.2018.02.005
Wu, L.-T., Gersing, K., Burchett, B., Woody, G. E., &
Blazer, D. G. (2011). Substance use disorders and
comorbid Axis I and II psychiatric disorders among
young psychiatric patients: Findings from a large
electronic health records database. Journal of
Psychiatric Research, 45(11), 1453–1462.
https://doi.org/10.1016/j.jpsychires.2011.06.012
Wu, Y., Li, Y., Baskys, A., Chok, J., Hoffman, J., &
Roosan, D. (2024). Health disparity in digital health
technology design. Health and Technology.
https://doi.org/10. 1007/s12553-024-00814-1
DATA 2024 - 13th International Conference on Data Science, Technology and Applications
26
