
The Dance of Logic and Unpredictability: Examining the Predictability
of User Behavior on Visual Analytics Tasks
Alvitta Ottley
a
Washington University in St. Louis, U.S.A.
Keywords:
Intelligent Visual Analytics, Artificial Intelligence, Human-Machine Collaboration, Individual Difference,
User Modeling.
Abstract:
The quest to develop intelligent visual analytics (VA) systems capable of collaborating and naturally interacting
with humans presents a multifaceted and intriguing challenge. VA systems designed for collaboration must
adeptly navigate a complex landscape filled with the subtleties and unpredictabilities that characterize human
behavior. However, it is noteworthy that scenarios exist where human behavior manifests predictably. These
scenarios typically involve routine actions or present a limited range of choices. This paper delves into the
predictability of user behavior in the context of visual analytics tasks. It offers an evidence-based discussion
on the circumstances under which predicting user behavior is feasible and those where it proves challenging.
We conclude with a forward-looking discussion of the future work necessary to cultivate more synergistic and
efficient partnerships between humans and the VA system. This exploration is not just about understanding
our current capabilities and limitations in mirroring human behavior but also about envisioning and paving the
way for a future where human-machine interaction is more intuitive and productive.
1 INTRODUCTION
Building intelligent visual analytics systems that can
assist and interact with humans during data analy-
sis is akin to teaching a robot to dance. We aspire
to achieve a dance of data with a fluid exchange of
ideas, a graceful understanding of needs, and a seam-
less partnership in pursuing hypotheses, insights, and
decisions. However, the human element in this equa-
tion is far from a predictable automaton – humans are
complex, driven by emotions, experiences, and social
contexts that often elude the straightforward logic of
machines. This complexity presents the visual analyt-
ics community with a formidable challenge: How do
we design systems that intelligently collaborate with
their human counterparts?
A common misconception frames humans as
purely logical entities whose decisions and actions are
easily predictable by well-defined rules. This assump-
tion is evident in technologies like basic customer ser-
vice chatbots, which are programmed for simple in-
quiries (Sheehan et al., 2020) but falter with com-
plex or emotionally charged interactions (Prentice and
Nguyen, 2020), resulting in unhelpful customer ex-
a
https://orcid.org/0000-0002-9485-276X
periences (Chong et al., 2021; Crolic et al., 2022;
Huang and Dootson, 2022). Similarly, advertising al-
gorithms that target based on demographics and past
behaviors often fall short (White and Samuel, 2019).
They assume that human preferences are static, over-
looking the subtleties of an individual’s goals and
ever-evolving needs (Lambrecht and Tucker, 2013).
Consequently, these approaches can lead to irrele-
vant, intrusive, or untrustworthy advertising (Bleier
and Eisenbeiss, 2015). Moreover, the frequent short-
comings of these systems can largely be attributed to
their inability to cope with the broad spectrum of un-
predictable factors inherent in the given case scenar-
ios. Adopting a one-size-fits-all strategy fails to con-
sider the unique variances among individuals and the
significant role that emotional factors play in shaping
human decisions and preferences under those circum-
stances (Bleier and Eisenbeiss, 2015).
Yet, in certain situations, human behavior tends
to be predictable (Heiner, 1983; Flanagan and Jo-
hansson, 2003). These situations usually involve rou-
tines, repetitive actions, or limited choices. For exam-
ple, many people have regular commuting patterns.
Most people’s daily routines have only slight varia-
tions (Krumme et al., 2013), making this predictabil-
ity useful for traffic forecasting and scheduling public
Ottley, A.
The Dance of Logic and Unpredictability: Examining the Predictability of User Behavior on Visual Analytics Tasks.
DOI: 10.5220/0012671100003660
Paper published under CC license (CC BY-NC-ND 4.0)
In Proceedings of the 19th International Joint Conference on Computer Vision, Imaging and Computer Graphics Theory and Applications (VISIGRAPP 2024) - Volume 4: VISAPP, pages
11-20
ISBN: 978-989-758-679-8; ISSN: 2184-4321
Proceedings Copyright © 2024 by SCITEPRESS – Science and Technology Publications, Lda.
11
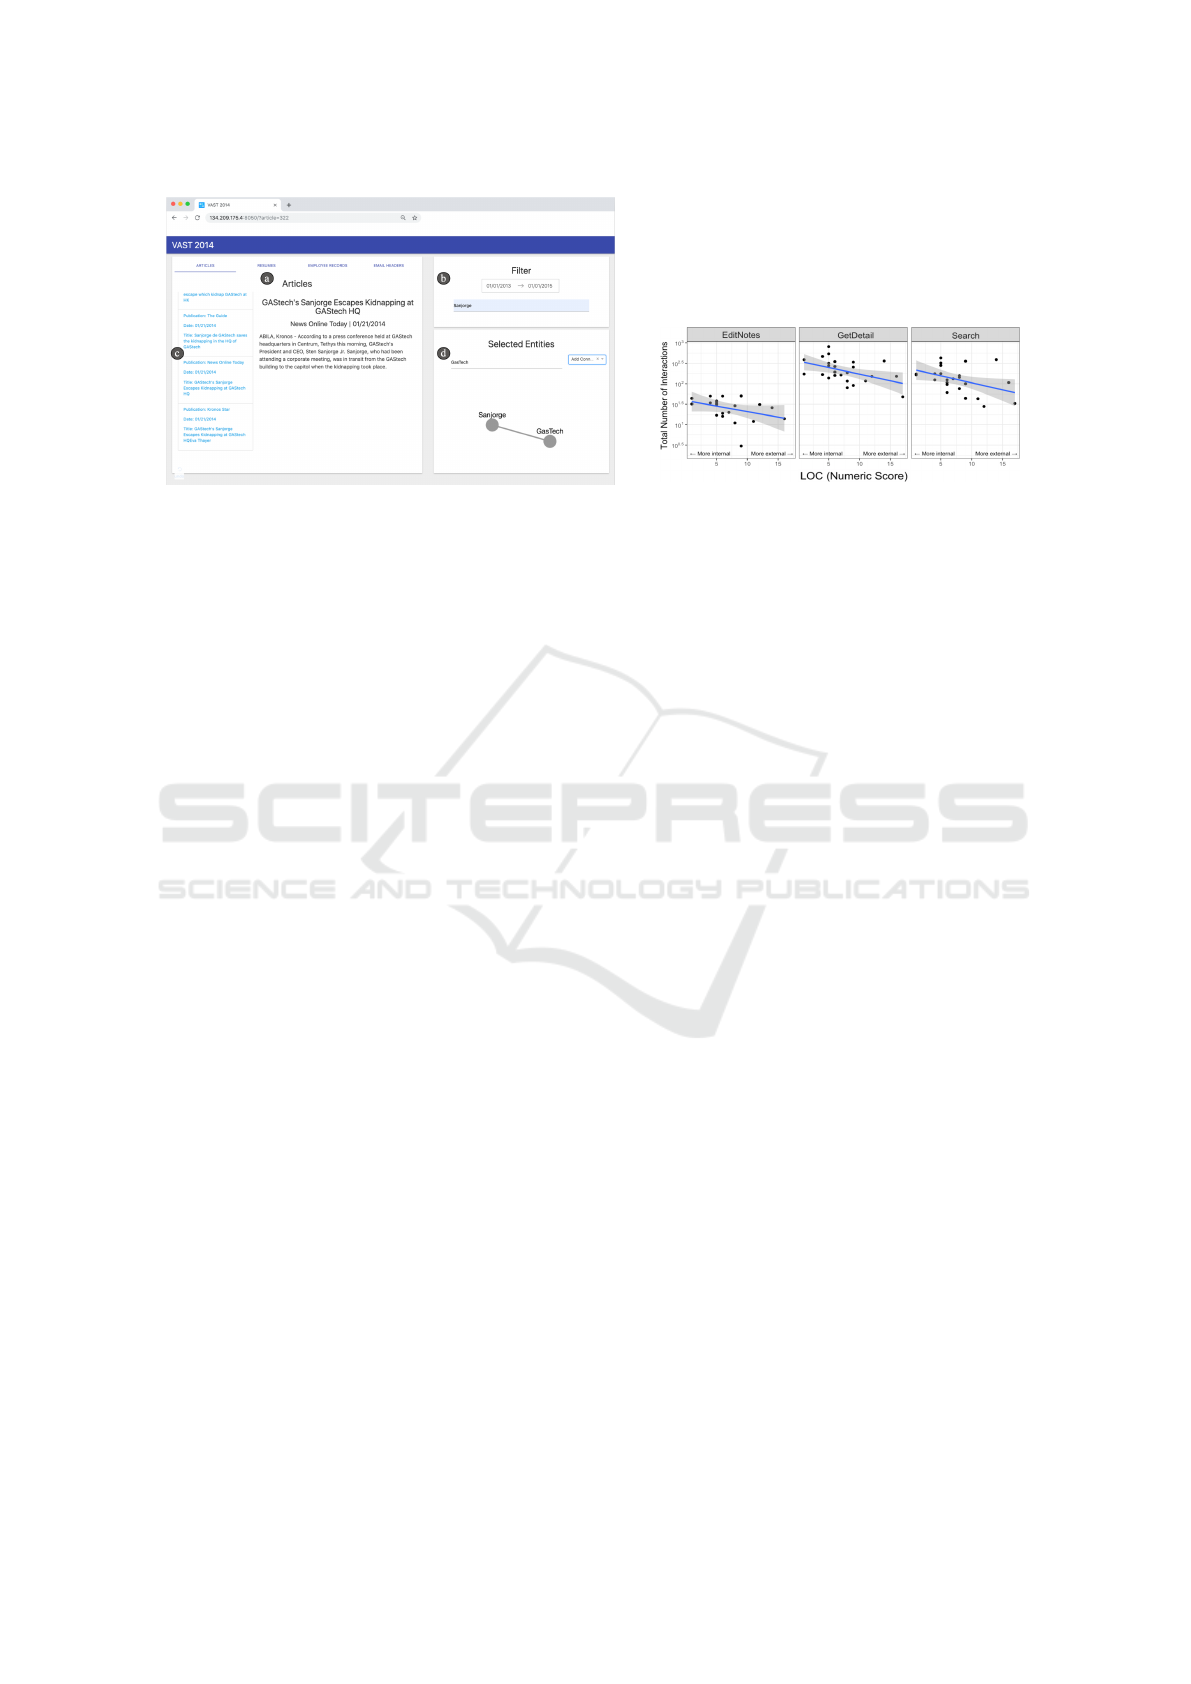
(a) The interface used to solve a task related to a kidnapping crime.
Users can (a) view details, (b) filter, (c) list matching results, and (d)
sketch an entity/connection network.
(b) The analysis revealed correlations between the num-
ber of interactions and participants’ locus of control
across the three primary action types.
Figure 1: The interface and analysis result from Crouser et al. They analyze the analysis behaviors from a series of exercises
with 22 trained intelligence analysts (Crouser et al., 2020). Their preliminary analysis suggests that individual differences in
locus of control can modulate expert behavior in complex analysis tasks.
transportation (Song et al., 2010). People’s interac-
tion with basic technology, like ATMs or elevators,
tends to follow a formulaic script due to the limited
actions available. Further, purchasing patterns for es-
sential goods often show consistency (Kim and Park,
1997; Krumme et al., 2013).
This paper argues that visual analytics systems
can capitalize on the predictable aspects of human be-
havior. This could mean creating interfaces and func-
tionalities that cater to routine tasks while providing
the flexibility and depth required for more complex,
less foreseeable analytical endeavors. For instance, if
a system recognizes that users frequently perform a
specific sequence of actions, it can automate or sim-
plify these steps. This approach could enhance ef-
ficiency and minimize the user’s cognitive load, al-
lowing them to focus on more complex data analysis
aspects requiring deeper thought and creativity.
However, the challenge lies in discerning when
human actions are routine and predictable and when
they are not. This balance is key to developing visual
analytics systems that are truly collaborative partners
in the dance of data exploration and analysis. This
paper discusses some necessary steps for creating in-
telligent visual analytics tools:
• A deeper collaboration between humans and AI
requires embracing the complexity of human be-
havior. We discuss the role of individual differ-
ences in visual analysis in Section 2.
• Section 3 explains how the system’s design can
affect action predictability.
• Two case studies in Section 4 demonstrate action
prediction based on user interactions.
• In Section 5 advocates for broadening the con-
ceptual models of human-machine collaboration
in visual analytics. We suggest a framework that
integrates AI capabilities with human expertise.
• Finally, we discuss, among other things, the ethi-
cal considerations for human-AI interactions that
must be rigorously addressed.
2 THE INTERPLAY OF
PREDICTABILITY AND
INDIVIDUALITY IN DATA
ANALYSIS
While it is true that certain scenarios can lead to pre-
dictable behavior patterns, this does not negate the
rich tapestry of individual differences that manifest
in various ways during visual analysis tasks. These
differences are influenced by many factors, including
personality traits, cognitive abilities, and situational
conditions, each playing a significant role in how indi-
viduals interact with and interpret data (Ottley, 2022;
Liu et al., 2020).
Studies show several individual differences have
consistently impacted performance, as evidenced by
multiple independent researchers’ replication in var-
ious experimental settings (Ottley, 2022; Liu et al.,
2020). Personality traits, for example, can greatly in-
fluence how a user approaches a visual analytics task.
A notable instance is the influence of locus of con-
trol, which reflects an individual’s perception of con-
trol over external events and often affects the speed
and accuracy of visualization tasks (Ottley et al.,
VISIGRAPP 2024 - 19th International Joint Conference on Computer Vision, Imaging and Computer Graphics Theory and Applications
12

2015a; Ziemkiewicz et al., 2012). This impact has
been consistently observed across studies using di-
verse datasets and methodologies, with findings cor-
roborating in both traditional laboratory experiments
and crowdsourcing research platforms (Crouser et al.,
2020; Ottley et al., 2015b).
One particular study, described in Figure 1, exam-
ining the behavior of 22 Navy Reservists during com-
plex analytical tasks revealed a correlation between
locus of control and expert behavior (Crouser et al.,
2020). It found that participants with a more internal
locus of control engaged in more actions and covered
more data in the same timeframe. Additionally, other
studies underscore the importance of visualization de-
sign in this dynamic, showing that an individual’s lo-
cus of control can significantly influence their search
strategy in hierarchical systems.
Similarly, cognitive abilities like spatial reason-
ing, perceptual speed, and working memory capac-
ity can impact the speed and accuracy with which
different users understand and analyze complex vi-
sual data (Liu et al., 2020). Situational factors, in-
cluding time constraints, task complexity, and the
user’s emotional state during analysis, further affect
this process(Bancilhon et al., 2023). Under time
pressure, users may adopt heuristic analysis meth-
ods, whereas more relaxed conditions might encour-
age deeper exploration (Bobadilla-Suarez and Love,
2018; Del Campo et al., 2016). Moreover, a task’s
inherent complexity can elicit varying responses, de-
pending on the user’s preference for challenge or sim-
plicity (Ziemkiewicz et al., 2012).
After reviewing the research, several key themes
emerged regarding the impact of individual differ-
ences on visual analytics tasks:
1. Individual differences are particularly significant
in complex tasks, with greater freedom for ex-
ploration (Ziemkiewicz et al., 2012; Brown et al.,
2014; Ottley et al., 2015b).
2. Simpler tasks tend to show less variation in
user behavior. Studies involving both easy
and challenging tasks often report no substan-
tial effect of individual differences on simpler
tasks (Ziemkiewicz et al., 2012).
3. Even with observable differences between indi-
viduals, there are common behavioral patterns
across groups, indicating that certain analysis
paths are more frequently traversed, even in sce-
narios with the potential for wide exploration di-
versity (Brown et al., 2014; Ottley et al., 2015b).
Understanding individual differences can provide
insight into inconsistent and consistent behavior pat-
terns. This knowledge can help create visual analytic
tools that intelligently collaborate and respond based
on these differences and the situations in which they
occur. It respects both the complex nature of human
behavior and can improve the functionality of visual
analytics systems.
3 HOW THE DESIGN OF VISUAL
ANALYTICS INTERFACE
IMPACTS PREDICTABILITY
In addition to the analyst’s characteristics, the inter-
face design, the nature of the data, and the task at hand
can all greatly influence the predictability of user be-
havior in these VA scenarios. Well-designed inter-
faces typically guide user behavior into predictable
patterns by offering clear options and intuitive paths
for data exploration, whether intentionally or not. In
contrast, a disorganized layout may result in erratic
and unpredictable exploration paths, potentially lead-
ing users to overlook essential insights and complicat-
ing user behavior prediction.
Consider the dashboard in Figure 2, which fea-
tures a simple exploratory interface for analyzing a
geospatial dataset. The most dominant feature is
a map, occupying roughly seventy percent of the
screen. This design choice naturally focuses the
user’s attention primarily on the map’s data points.
Additionally, given that users typically read from left
to right, the filtering options on the right side will
likely be the next focus point, followed by the bar
chart at the bottom. Thus, predicting attention and
high-level areas of interest is feasible.
Interaction affordances, which suggest possible
actions through design, also play a crucial role. For
example, the persistent visibility of filtering options in
Figure 2, instead of their placement in hidden menus,
increases the likelihood of their usage. Users will
likely engage with the most accessible actions, such
as hover effects, more frequently. Other interactions,
like panning and zooming on the map, brushing on
the timeline, or clicking on data points, are less ob-
vious due to the absence of explicit visual cues and
might be underutilized, especially by new users. The
space of possible actions for this interface is small.
One might consider using a probabilistic approach to
predict action for this interface, encoding the assumed
likelihood of observing a specific action as priors and
calculating the posterior probability of observing an
action given a set of observations.
Additionally, how data is represented dictates the
questions an analyst can ask and what they will likely
notice and consider. In Figure 2, the interface’s fo-
The Dance of Logic and Unpredictability: Examining the Predictability of User Behavior on Visual Analytics Tasks
13
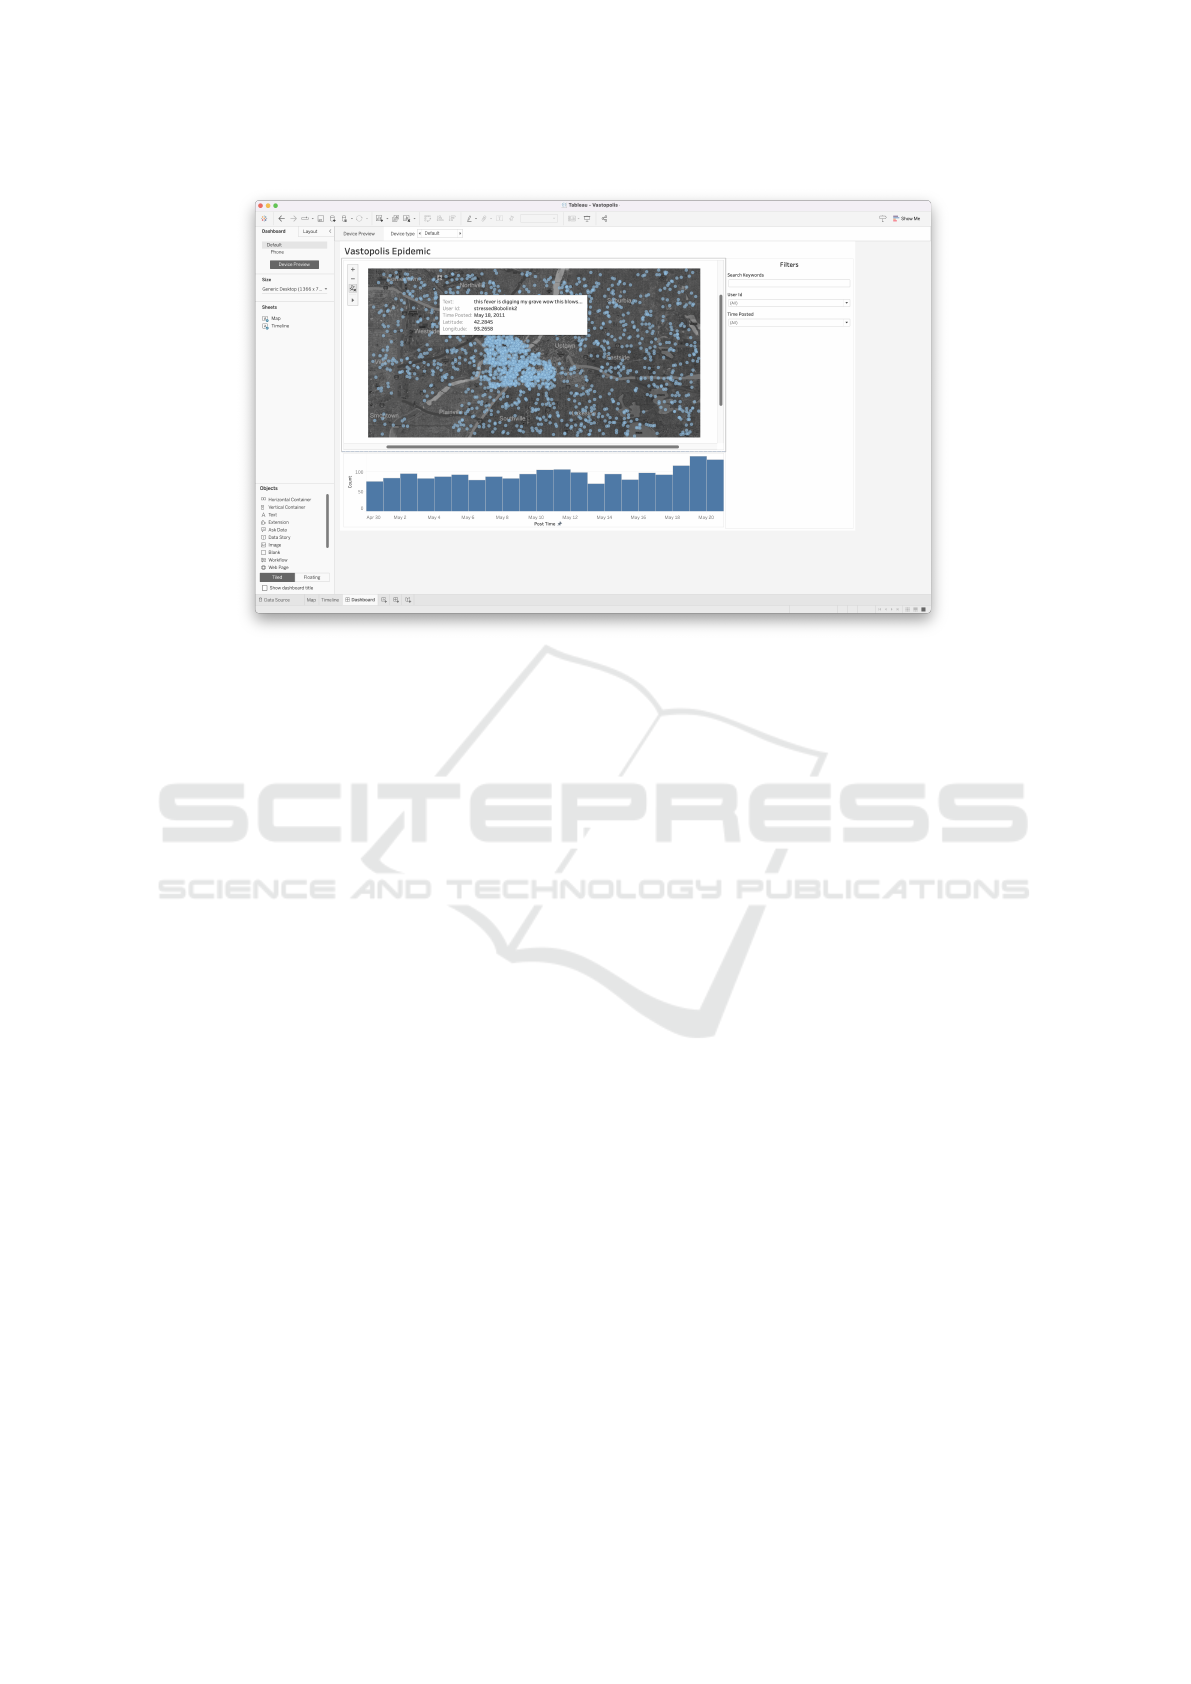
Figure 2: The Tableau interface with a prototype dashboard with an epidemic data set in the fictitious city of Vastopolis, used
as the running example in section 3. The text displays a map of social media posts with geolocation, a search and filter sidebar,
and a bar chart indicating post frequency over three weeks.
cus on geographical data through maps encourages
the exploration of spatial patterns and regional clus-
ters and differences. Similarly, the prominently dis-
played timeline and area chart at the bottom of the in-
terface are likely to prompt questions about temporal
changes. The available filtering options and zooming
capabilities influence the depth and specificity of the
questions an analyst can pose. An interface that sup-
ports intricate data manipulation enables analysts to
formulate and test detailed hypotheses, while a more
static interface or those without interaction cues might
confine them to basic, surface-level observations. Pre-
dicting objectives and tasks will require a mapping
between them and the observable actions and their
association with the current area of interest(Gathani
et al., 2022).
Now, suppose instead, we consider the interac-
tions more broadly in the Tableau interface or with
other advanced statistical analysis tools. This would
offer more opportunities to delve into complex ques-
tions about correlations or predictions. Moreover, the
ability to customize the interface or create custom vi-
sualizations significantly broadens the range of poten-
tial questions. Analysts are not confined to predefined
views and can adapt their analysis to meet specific and
unique investigative needs. Furthermore, the amount
of data the interface can handle also influences the
questions that can be pursued. Some interfaces, op-
timized for large datasets or real-time data, facili-
tate queries about broad trends or immediate insights,
while others are more suitable for detailed analysis
of smaller datasets. Although a more complex system
offers greater flexibility, increased degrees of freedom
will decrease the predictability of user behavior.
Overall, the interface design implicitly provides
guidance or scaffolding to shape the queries, analysis
pathways, and questions an analyst considers. This
is especially significant for novice users still learning
which questions can be asked about data or how to
use the system. Understanding these design elements
is crucial for developers of visual analytics systems
to create interfaces that facilitate data comprehension
and guide users by observing predictable and insight-
ful data interactions.
4 CASE STUDIES FROM
VISUALIZATION RESEARCH
Prior work in visual analytics has demonstrated ac-
tions and scenarios where behavior prediction was
largely successful and the machine learning tech-
niques used to make these inferences (Xu et al.,
2020). This section highlights two such papers.
4.1 Predicting Navigation Paths for
PreFetching
Battle et al. explored the feasibility of predicting user
navigation behavior to enhance database caching, a
valuable feature for managing large datasets with po-
VISIGRAPP 2024 - 19th International Joint Conference on Computer Vision, Imaging and Computer Graphics Theory and Applications
14
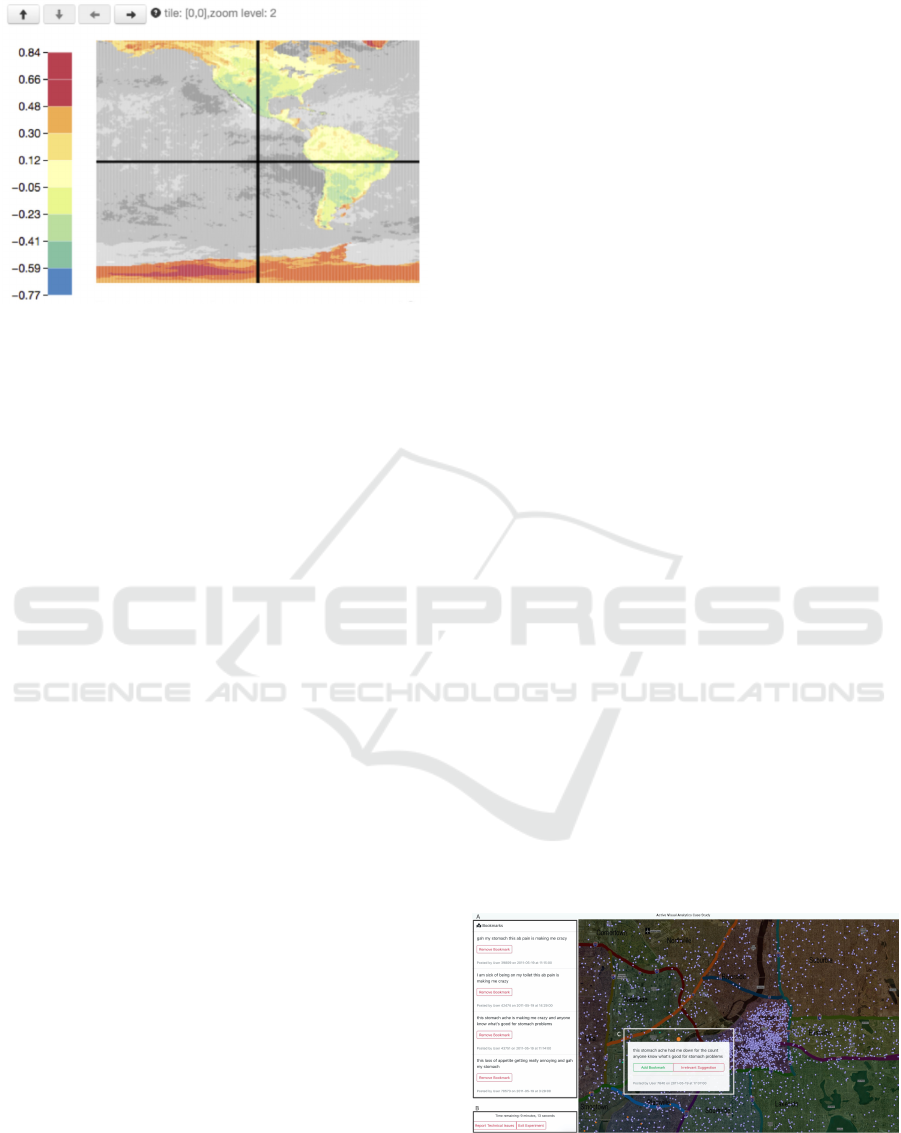
Figure 3: The ForeCache project interface, which visualizes
snow levels from NASA MODIS data (Battle et al., 2016).
The authors used observed navigation patterns to predict fu-
ture interactions and pre-fetch data.
tential latency issues during database queries (Battle
et al., 2016). The project was inspired by previous
research highlighted that latency can negatively affect
user experience and impede data exploration (Liu and
Heer, 2014). To mitigate this, they introduced dy-
namic prefetching, which predicts necessary data to
fetch in advance by analyzing users’ recent naviga-
tion patterns.
Interface. The research team developed a map-
based visualization tool for NASA’s MODIS snowfall
data across America. Given the high-resolution na-
ture of the complete dataset, the system aggregated
data into lower-resolution tiles for an overview and
increased granularity during user zoom-ins. With its
straightforward design, this map interface was con-
ducive to making accurate predictions. It allowed
only six observable actions: pan up, down, left, right,
and zoom in and out.
Task. The tasks assigned to the study participants
were simple yet effective. Participants were required
to explore the data to identify areas with significant
snowfall, navigating and searching the interface for
regions of interest.
Participants. The study involved domain scientists,
suggesting a uniform background and likely shared
expertise. This homogeneity in the participants’ back-
grounds helped minimize individual differences in
skills and knowledge, creating an optimal environ-
ment for limiting variability in user interactions.
Predictions. The researchers used a Markov chain
model that predicted users’ actions. This model was
not pre-programmed but evolved by observing user
interactions, enabling the system to learn and up-
date its predictions based on the user’s current state.
The evaluation of this dynamic prefetching strat-
egy showed substantial improvements in reducing la-
tency compared to non-prefetching systems (430%
improvement) and significant enhancements in both
prediction accuracy (25% improvement) and latency
reduction (88% improvement) compared to existing
prefetching methods.
While the simplicity of this scenario might seem
unrepresentative at first glance, it mirrors common
situations in data foraging tasks, which are crucial
for the sensemaking process (Pirolli and Card, 2005).
Even when multitasking, external actions manifest as
sequential rather than concurrent (McFarlane, 1998;
McFarlane, 2002; McFarlane and Latorella, 2002).
Moreover, divided attention is limited by working
memory capacity. Thus, the scope of actions and in-
quiries at any given time window within a visualiza-
tion is usually confined. This indicates that the po-
tential for predictive scenarios, like the one in Battle
et al.’s study, might be more widespread than initially
assumed. Their research provides a solid example of
the types of predictions that are feasible – specifically
navigation and data foraging – within an accommo-
dating situational environment.
4.2 Predicting Data Interest for Content
Recommendation
Similarly, Monadjemi et al. aimed to assist data ex-
ploration and information foraging. Their approach
involved analyzing users’ exploration patterns, deduc-
ing the characteristics of data points likely to interest
the user, and recommending similar points for further
exploration. Their primary objective was to expedite
data discovery, thereby boosting the efficiency of an-
alytics and enhancing the quality of decision-making.
Figure 4: The interface used by Monadjemi et al. in eval-
uating their algorithm that observes data exploration, infers
the relevance of the other points in the dataset and recom-
mends content to the user (Monadjemi et al., 2022).
The Dance of Logic and Unpredictability: Examining the Predictability of User Behavior on Visual Analytics Tasks
15

Interface. For their evaluation, they adopted a sce-
nario from the VAST 2011 challenge, an annual com-
petition in the visual analytics community focused on
addressing real-world challenges. This scenario re-
volves around a fictional city, Vastopolis, which is
grappling with a bio-chemical attack. The authors
developed a visualization interface showcasing a city
map embedded with geo-tagged social media posts
from the past three weeks, providing a comprehen-
sive view of the unfolding situation. Like the Fore-
Cache interface used by Battle et al., the interface was
straightforward for limited available actions. The user
can pan, zoom the map, and save or unsave relevant
social media posts.
Task. The task assigned to participants was one of
reconnaissance and information foraging. Partici-
pants were required to explore the data to gauge the
range of symptoms being reported on social media.
The goal was for them to gather data that downstream
analysts could use to understand the extent of the epi-
demic, assess containment, and hypothesize potential
causes. Given the vastness of the dataset, each partici-
pant had a ten-minute time limit to identify potentially
sick individuals, acknowledging that completing the
entire task was beyond expectation.
Participants. The study involved 130 participants
recruited through Amazon’s Mechanical Turk plat-
form. These individuals ranged from 18 to 65 years
old, were based in the United States, and were profi-
cient in English. While they were not trained analysts,
exploring a dataset of social media posts to identify
mentions of illness was deemed manageable without
specialized training.
Predictions. The team employed an active search
methodology, translating social media posts into nu-
merical values using a standard word2vec model and
constructing a k-NN binary classifier using cosine
similarity. As users engaged with the map and book-
marked pertinent posts, the algorithm tagged these
data points as relevant. The model continuously up-
dated its understanding of the data after each interac-
tion, reassessing the relevance of unlabeled points in
light of recent user actions. It then offered sugges-
tions for additional points the user might explore.
The analysis of the user study results revealed
that the algorithm generated useful recommendations
79% of the time, on average. Moreover, the data
revealed that participants who utilized the algorithm
in their search were significantly more efficient than
those who did not. The assisted participants discov-
ered a statistically significant greater number of indi-
viduals potentially affected by the illness. They also
were more adept at distinguishing relevant informa-
tion from irrelevant data in the dataset.
In summary, Monadjemi et al.’s approach demon-
strated the predictability of data interesting in visual
analytics, specifically in data foraging tasks (Monad-
jemi et al., 2022). By leveraging machine learning
techniques to interpret user interaction and guide fur-
ther exploration, their system accelerated the data dis-
covery process and enhanced the effectiveness and ac-
curacy of the users’ information foraging activities.
This study is a testament to the potential of integrat-
ing intelligent predictive algorithms into visual ana-
lytics systems, paving the way for more intuitive and
productive data analysis experiences.
5 A CONCEPTUAL
FRAMEWORK FOR HUMAN
AND AI COLLABORATION
The previous section showed successful algorithms
that observed human behavior in real-time, predicted
actions, and used these inferences to assist the user
by recommending exploration or pre-fetching data.
However, to effectively develop collaborative sys-
tems, it is crucial to establish a comprehensive frame-
work that recognizes the shared responsibilities and
synergistic partnership between human and AI enti-
ties (Crouser et al., 2013). Traditional conceptual
models in visual analytics have often been limited
in scope (Monadjemi et al., 2023), focusing predom-
inantly on human cognitive processes (Pirolli and
Card, 2005), treating the visual analytic interface
as a mere tool without autonomy (Van Wijk, 2005;
Van Wijk, 2006), or maintaining an imbalanced per-
spective of the intelligent system, where AI is viewed
as having limited capabilities compared to the hu-
man’s ultimate authority (Sperrle et al., 2022; Ceneda
et al., 2017).
However, looking forward to a future where re-
sponsibilities are more evenly distributed between hu-
mans and AI, broadening these frameworks is impera-
tive. Such an expansion should accommodate the po-
tential for each entity to act as a check and balance
against biases that might arise from either side, as
proposed by (Wall et al., 2021) and (Ha et al., 2022).
Additionally, it’s important to consider scenarios in-
volving multiple human and AI agents collaborating
on a single task, employing a ‘divide and conquer’ ap-
proach. This revised framework must account for the
dynamic interactions between humans and AI, recog-
nizing the unique strengths and limitations of each. In
doing so, we can foster systems where collaboration is
VISIGRAPP 2024 - 19th International Joint Conference on Computer Vision, Imaging and Computer Graphics Theory and Applications
16
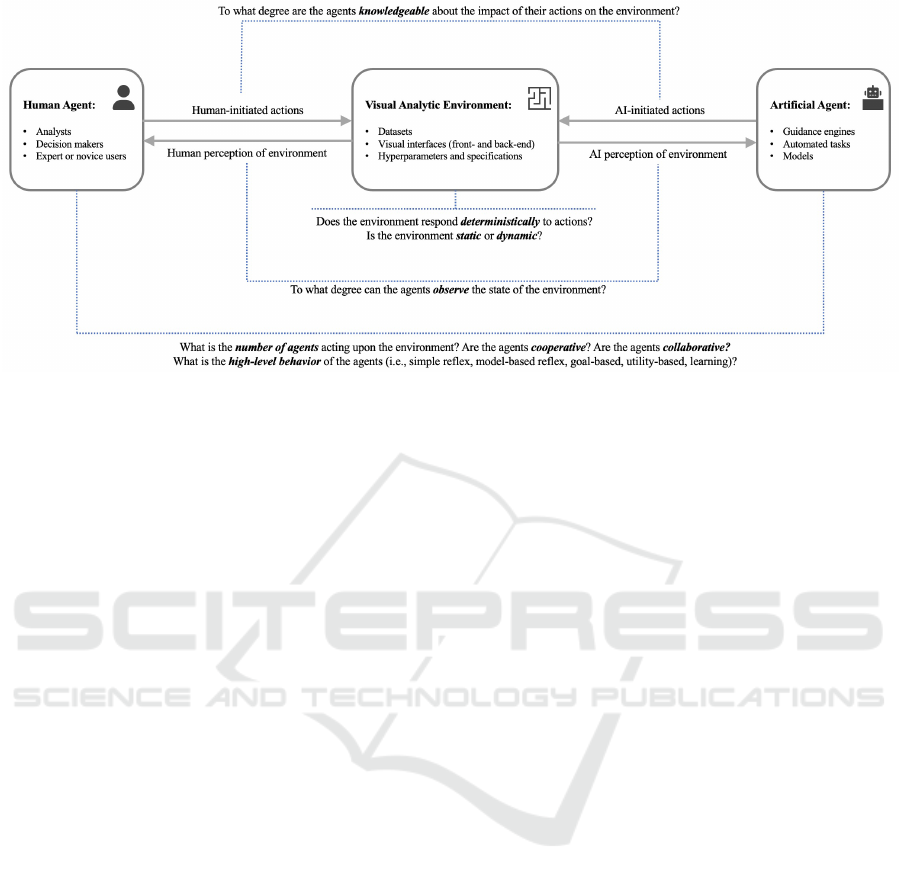
Figure 5: The agent-based framework for visual analytics proposed by (Monadjemi et al., 2023). It adopts terminologies
from AI and conceptualizes visual analytics scenarios as interactions (observations and actions) between agents and their
environment.
about task division and mutual learning and support,
leading to more robust and effective problem-solving
strategies.
5.1 An Agent-Based Framework
One possible collaborative model is the agent-based
framework originally introduced in (Monadjemi et al.,
2023) and summarized in Figure 5. It draws parallels
between human cognitive processes and AI modeling
and advocates for a unified language for the visual an-
alytics and AI communities. This approach, rooted in
the well-established AI literature, simplifies complex
problems by conceptualizing them as interactions be-
tween agents and their environments. Developers and
researchers can tailor the specification of this model
to their specific contexts and applications.
Applying the agent-based model to visual analyt-
ics presents an opportunity to enrich our comprehen-
sion and improve the dynamics of human-AI interac-
tions within this domain. In this context, visual an-
alytic agents can be either human or artificial enti-
ties. The model envisions that all agents are capable
of both observation and action, contributing toward a
collective analytical goal.
Human agents here are broadly defined and are
data scientists, decision-makers, domain experts, or
novice users. The prior research on understanding
the diverse needs of these groups (e.g., (Wong et al.,
2018)) or those that explore how individual differ-
ences might influence analytical workflows (Liu et al.,
2020; Ottley, 2022) can inform the model’s specifi-
cations and considerations. Additionally, developers
can consider studies on how humans perceive data
(e.g., (Xiong et al., 2022; Bancilhon et al., 2020)) and
the nature of actions undertaken during analytical ses-
sions (e.g., (Gotz and Zhou, 2009; Brehmer and Mun-
zner, 2013; Gathani et al., 2022)).
Artificial agents can consist of modeling algo-
rithms, guidance systems, and automated processes
interacting within the environment to assist in collab-
orative analytical tasks. Prior research in this area has
focused on designing artificial agents capable of iden-
tifying patterns in data (e.g. (Kim et al., 2019; Ha
et al., 2022)), learning from user interactions (e.g.,
(Brown et al., 2012; Ottley et al., 2019)), and assist-
ing users throughout their analytical sessions (e.g.,
(Dabek and Caban, 2016; Monadjemi et al., 2022)).
This body of work also highlights the evolving capa-
bilities and contributions of both human and artificial
agents in visual analytics, underscoring the potential
for synergistic collaboration between these entities in
achieving analytical objectives.
This agent-based approach provides a framework
for analyzing complex interactions in visual analyt-
ics. It also creates opportunities for innovative so-
lutions and advancements in the field. By consider-
ing humans and AI systems as agents within a visual
analytics environment, we can analyze and improve
their interactions, decision-making processes, and in-
formation processing in a more effective way.
6 DISCUSSION AND FUTURE
WORK
The purpose of this paper is to establish the ground-
work for the creation of intelligent visual analytics
The Dance of Logic and Unpredictability: Examining the Predictability of User Behavior on Visual Analytics Tasks
17

systems that can seamlessly interact with humans.
However, given the intricate nature of human behav-
ior and their interaction with AI, there are both ob-
stacles and prospects that need to be addressed to
progress in this field. This section will outline the
primary challenges that must be overcome to advance
this promising area.
6.1 Understanding Predictable and
Unpredictable Human Behaviors
The advancement of intelligent visual analytic inter-
faces hinges on their capability to fluidly navigate be-
tween handling routine, predictable tasks and engag-
ing with tasks that demand a more intricate and nu-
anced comprehension of human behavior. The exist-
ing body of work, as delineated in section 4, presents
initial examples of predicted actions and tasks. How-
ever, this area is still in its early stages of devel-
opment. These examples suggest we can use tech-
niques such as Markov models and active learning al-
gorithms to learn from interactions during data for-
aging and simple search tasks (Battle et al., 2016;
Monadjemi et al., 2022). Still, examples of predic-
tive algorithms validated with real user data are few
and limited (Ha et al., 2022). There is still much to
do.
Unpredictable behaviors can result from complex
cognitive processes and emotional states, requiring
more sophisticated methods of analysis and interpre-
tation. Additionally, the community needs to estab-
lish protocols for handling situations where the AI’s
confidence in its predictions is low, as well as ex-
panding the bandwidth of communications between
agents. Future research is essential for understanding
individual variances, how to offer personalized expe-
riences, and how to adjust to users’ evolving needs
and behaviors. Moving forward in this field requires
not just technological advancements, but also a mul-
tidisciplinary approach involving psychology, cogni-
tive science, and behavioral studies.
6.2 Integrating Multi-Agent System
Explorations into multi-agent systems in visual ana-
lytics also hold significant promise. These systems
would feature multiple human and artificial agents,
each with specialized skills, working in concert with
each other. This collaborative approach could lead to
more thorough and diverse analytics as various agents
contribute their unique expertise to the task. How-
ever, this introduces complexities in effectively man-
aging the task allocation and coordination and ensur-
ing that each agent’s strengths are utilized effectively.
Research in this area must also focus on develop-
ing methods for seamless interaction between diverse
agents, addressing challenges such as communication
protocols, conflict resolution, and decision hierarchy.
6.3 Addressing Ethical Concerns
It is crucial for users to trust AI algorithms, and trans-
parency in how they function is a key factor in build-
ing that trust. This means that algorithms should be
designed in a way that is open and clear about how
they make decisions and that they can be audited for
any biases. One way to make AI decision-making
more understandable to humans is through the use of
Explainable AI (XAI) techniques.
It is important to make sure that the results pro-
duced by AI systems are fair and unbiased. This is
especially crucial when decisions based on these re-
sults can have significant consequences. To achieve
fairness, it is necessary to continuously monitor and
evaluate the AI systems, and identify and address any
biases that may arise. Collaborating with experts in
ethics, sociology, and relevant fields can provide valu-
able insights into the societal implications of AI deci-
sions, and help create more equitable algorithms.
7 CONCLUSIONS
This paper discusses the necessary advancements re-
quired to improve intelligent visual analytics systems.
We highlight the importance of recognizing the full
spectrum of human behavior and examine existing
user models that can learn and predict from interac-
tion data. We also suggest expanding the human-
machine teaming model and adopting an agent-based
model framework that recognizes the potential for
collaboration between humans and AI. In addition,
we emphasize the need to consider ethical and con-
textual dimensions while designing such systems, and
we discuss other potential future directions. By focus-
ing on these areas, we can create systems that assist
and enhance human capabilities in data analysis, em-
bodying a true partnership in the dance of discovery
and decision-making.
ACKNOWLEDGEMENTS
I thank Stefan J
¨
anicke and Helen C. Purchase for
inviting me to deliver the keynote speech at IVAPP
2024, which is the basis of this manuscript. I also
would like to express my gratitude to Sunwoo Ha for
VISIGRAPP 2024 - 19th International Joint Conference on Computer Vision, Imaging and Computer Graphics Theory and Applications
18

her valuable feedback and to Leilani Battle for allow-
ing the use of her system’s imagery. This material
is based upon work supported by the U.S. National
Science Foundation under grant numbers IIS-2142977
and OAC-2118201.
REFERENCES
Bancilhon, M., Liu, Z., and Ottley, A. (2020). Let’s Gam-
ble: How a Poor Visualization Can Elicit Risky Be-
havior. In 2020 IEEE Visualization Conference (VIS),
pages 196–200. IEEE.
Bancilhon, M., Wright, A., Ha, S., Crouser, R. J., and Ot-
tley, A. (2023). Why Combining Text and Visualiza-
tion Could Improve Bayesian Reasoning: A Cognitive
Load Perspective. In Proceedings of the 2023 CHI
Conference on Human Factors in Computing Systems,
pages 1–15.
Battle, L., Chang, R., and Stonebraker, M. (2016). Dynamic
Prefetching of Data Tiles for Interactive Visualization.
In Proceedings of the 2016 International Conference
on Management of Data, pages 1363–1375.
Bleier, A. and Eisenbeiss, M. (2015). The Importance of
Trust for Personalized Online Advertising. Journal of
Retailing, 91(3):390–409.
Bobadilla-Suarez, S. and Love, B. C. (2018). Fast or Frugal,
but not both: Decision Heuristics Under Time Pres-
sure. Journal of Experimental Psychology: Learning,
Memory, and Cognition, 44(1):24.
Brehmer, M. and Munzner, T. (2013). A Multi-Level
Typology of Abstract Visualization Tasks. IEEE
transactions on visualization and computer graphics,
19(12):2376–2385.
Brown, E. T., Liu, J., Brodley, C. E., and Chang, R. (2012).
Dis-Function: Learning Distance Functions Interac-
tively. In 2012 IEEE conference on visual analytics
science and technology (VAST), pages 83–92. IEEE.
Brown, E. T., Ottley, A., Zhao, H., Lin, Q., Souvenir, R.,
Endert, A., and Chang, R. (2014). Finding Waldo:
Learning about Users from their Interactions. IEEE
Transactions on visualization and computer graphics,
20(12):1663–1672.
Ceneda, D., Gschwandtner, T., May, T., Miksch, S., Schulz,
H.-J., Streit, M., and Tominski, C. (2017). Charac-
terizing Guidance in Visual Analytics. IEEE Trans-
actions on Visualization and Computer Graphics,
23(1):111–120.
Chong, T., Yu, T., Keeling, D. I., and de Ruyter, K. (2021).
AI-chatbots on the services frontline addressing the
challenges and opportunities of agency. Journal of
Retailing and Consumer Services, 63:102735.
Crolic, C., Thomaz, F., Hadi, R., and Stephen, A. T.
(2022). Blame the bot: Anthropomorphism and anger
in customer–chatbot interactions. Journal of Market-
ing, 86(1):132–148.
Crouser, R. J., Ottley, A., and Chang, R. (2013). Balancing
human and machine contributions in human computa-
tion systems. In Handbook of Human Computation,
pages 615–623. Springer.
Crouser, R. J., Ottley, A., Swanson, K., and Montoly, A.
(2020). Investigating the Role of Locus of Control
in Moderating Complex Analytic Workflows. EuroVis
2020-Short Papers.
Dabek, F. and Caban, J. J. (2016). A Grammar-Based
Approach for Modeling User Interactions and Gener-
ating Suggestions During the Data Exploration Pro-
cess. IEEE Transactions on Visualization and Com-
puter Graphics, 23(1):41–50.
Del Campo, C., Pauser, S., Steiner, E., and Vetschera, R.
(2016). Decision making styles and the use of heuris-
tics in decision making. Journal of Business Eco-
nomics, 86:389–412.
Flanagan, J. R. and Johansson, R. S. (2003). Action plans
used in action observation. Nature, 424(6950):769–
771.
Gathani, S., Monadjemi, S., Ottley, A., and Battle, L.
(2022). A Grammar-Based Approach for Applying
Visualization Taxonomies to Interaction Logs. Com-
puter Graphics Forum, 41(3):489–500.
Gotz, D. and Zhou, M. X. (2009). Characterizing Users’
Visual Analytic Activity for Insight Provenance. In-
formation Visualization, 8(1):42–55.
Ha, S., Monadjemi, S., Garnett, R., and Ottley, A. (2022).
A Unified Comparison of User Modeling Techniques
for Predicting Data Interaction and Detecting Explo-
ration Bias. IEEE Transactions on Visualization and
Computer Graphics, 29(1):483–492.
Heiner, R. A. (1983). The origin of predictable behavior.
The American economic review, 73(4):560–595.
Huang, Y.-S. S. and Dootson, P. (2022). Chatbots and ser-
vice failure: When does it lead to customer aggres-
sion. Journal of Retailing and Consumer Services,
68:103044.
Kim, B.-D. and Park, K. (1997). Studying patterns of con-
sumer’s grocery shopping trip. Journal of retailing,
73(4):501–517.
Kim, H., Choi, D., Drake, B., Endert, A., and Park, H.
(2019). TopicSifter: Interactive Search Space Reduc-
tion through Targeted Topic Modeling. In 2019 IEEE
Conference on Visual Analytics Science and Technol-
ogy (VAST), pages 35–45. IEEE.
Krumme, C., Llorente, A., Cebrian, M., Pentland, A., and
Moro, E. (2013). The predictability of consumer visi-
tation patterns. Scientific reports, 3(1):1645.
Lambrecht, A. and Tucker, C. (2013). When does retarget-
ing work? information specificity in online advertis-
ing. Journal of Marketing research, 50(5):561–576.
Liu, Z., Crouser, R. J., and Ottley, A. (2020). Survey
on Individual Differences in Visualization. Computer
Graphics Forum, 39(3):693–712.
Liu, Z. and Heer, J. (2014). The Effects of Interac-
tive Latency on Exploratory Visual Analysis. IEEE
Transactions on Visualization and Computer Graph-
ics, 20(12):2122–2131.
McFarlane, D. C. (1998). Interruption of people in human-
computer interaction. The George Washington Uni-
versity.
The Dance of Logic and Unpredictability: Examining the Predictability of User Behavior on Visual Analytics Tasks
19

McFarlane, D. C. (2002). Comparison of four primary
methods for coordinating the interruption of people in
human-computer interaction. Human-computer inter-
action, 17(1):63–139.
McFarlane, D. C. and Latorella, K. A. (2002). The scope
and importance of human interruption in human-
computer interaction design. Human-Computer Inter-
action, 17(1):1–61.
Monadjemi, S., Guo, M., Gotz, D., Garnett, R., and Ottley,
A. (2023). Human–computer collaboration for visual
analytics: an agent-based framework. COMPUTER
GRAPHICS forum, 42(3).
Monadjemi, S., Ha, S., Nguyen, Q., Chai, H., Garnett, R.,
and Ottley, A. (2022). Guided Data Discovery in Inter-
active Visualizations via Active Search. IEEE Trans-
actions on Visualization and Computer Graphics.
Ottley, A. (2022). Adaptive and Personalized Visualization.
Springer Nature.
Ottley, A., Crouser, R. J., Ziemkiewicz, C., and Chang, R.
(2015a). Manipulating and controlling for personality
effects on visualization tasks. Information Visualiza-
tion, 14(3):223–233.
Ottley, A., Garnett, R., and Wan, R. (2019). Follow the
Clicks: Learning and Anticipating Mouse Interac-
tions During Exploratory Data Analysis. In Computer
Graphics Forum, volume 38, pages 41–52. Wiley On-
line Library.
Ottley, A., Yang, H., and Chang, R. (2015b). Personality
as a Predictor of User Strategy: How Locus of Con-
trol Affects Search Strategies on Tree Visualizations.
In Proceedings of the 33rd Annual ACM Conference
on Human Factors in Computing Systems (CHI 2015),
pages 3251–3254.
Pirolli, P. and Card, S. (2005). The Sensemaking Process
and Leverage Points for Analyst Technology as Iden-
tified Through Cognitive Task Analysis. In Proceed-
ings of international conference on intelligence anal-
ysis, volume 5, pages 2–4. McLean, VA, USA.
Prentice, C. and Nguyen, M. (2020). Engaging and retain-
ing customers with ai and employee service. Journal
of Retailing and Consumer Services, 56:102186.
Sheehan, B., Jin, H. S., and Gottlieb, U. (2020). Customer
service chatbots: Anthropomorphism and adoption.
Journal of Business Research, 115:14–24.
Song, C., Qu, Z., Blumm, N., and Barab
´
asi, A.-L. (2010).
Limits of predictability in human mobility. Science,
327(5968):1018–1021.
Sperrle, F., Ceneda, D., and El-Assady, M. (2022). Lotse:
A Practical Framework for Guidance in Visual Ana-
lytics. IEEE Transactions on Visualization and Com-
puter Graphics.
Van Wijk, J. J. (2005). The Value of Visualization. In VIS
05. IEEE Visualization, 2005., pages 79–86. IEEE.
Van Wijk, J. J. (2006). Views on Visualization. IEEE
Transactions on Visualization and Computer Graph-
ics, 12(4):421–432.
Wall, E., Narechania, A., Coscia, A., Paden, J., and En-
dert, A. (2021). Left, right, and gender: Exploring
Interaction Traces to Mitigate Human Biases. IEEE
transactions on visualization and computer graphics,
28(1):966–975.
White, G. R. and Samuel, A. (2019). Programmatic ad-
vertising: Forewarning and avoiding hype-cycle fail-
ure. Technological Forecasting and Social Change,
144:157–168.
Wong, Y. L., Madhavan, K., and Elmqvist, N. (2018).
Towards Characterizing Domain Experts as a User
Group. In 2018 IEEE Evaluation and Beyond-
Methodological Approaches for Visualization (BE-
LIV), pages 1–10. IEEE.
Xiong, C., Stokes, C., Kim, Y.-S., and Franconeri, S.
(2022). Seeing What You Believe or Believing What
You See? Belief Biases Correlation Estimation. IEEE
Transactions on Visualization and Computer Graph-
ics.
Xu, K., Ottley, A., Walchshofer, C., Streit, M., Chang, R.,
and Wenskovitch, J. (2020). Survey on the Analysis
of Iser Interactions and Visualization Provenance. In
Computer Graphics Forum, volume 39, pages 757–
783. Wiley Online Library.
Ziemkiewicz, C., Ottley, A., Crouser, R. J., Yauilla, A. R.,
Su, S. L., Ribarsky, W., and Chang, R. (2012). How
Visualization Layout Relates to Locus of Control and
Other Personality Factors. IEEE Transactions on Visu-
alization and Computer Graphics, 19(7):1109–1121.
VISIGRAPP 2024 - 19th International Joint Conference on Computer Vision, Imaging and Computer Graphics Theory and Applications
20
