
Localized Surface Plasmon Resonance on Optical Fiber Surface
for Chemical Sensing
Amin Moslemi
1
, Lucia Sansone
2a
, Flavio Esposito
1b
, Stefania Campopiano
1c
,
Michele Giordano
2d
and Agostino Iadicicco
1e
1
Department of Engineering, University of Naples “Parthenope”, 80143 Naples, Italy
2
Institute for Polymers, Composites and Biomaterials, National Research Council of Italy, IPCB-CNR, 80055 Portici, Italy
Keywords: Fiber Optic Sensors, Localized Surface Plasmon Resonance, Gold Nanoparticles, Chemical Sensing.
Abstract: This study describes the basic principles of a fiber optic probe that exploits the localized surface plasmon
resonance (LSPR) effect achieved by depositing gold nanoparticles (AuNPs) onto the fiber optic transducer.
The idea is to read the absorbance spectra of AuNPs and its dependence on the environmental parameter, i.e.
the surrounding refractive index, using optical fiber. Basically, we selected a thin optical fiber to encourage
the presence of evanescent waves in the surrounding medium; furthermore, the fiber surface has been
functionalized allowing the grafting of AuNPs while a silver mirror on the fiber tip allows readout for
reflection configuration. The reflected spectra show absorbance characteristics related to single and
aggregated AuNPs. In this article, the peaks absorbance, i.e. the depths of the reflected signal, were studied
as a function of the surrounding refractive index for application in chemical sensing.
1 INTRODUCTION
The widespread adoption of optical fiber chemical
and biological sensors is notable, offering significant
potential to eventually supplant conventional and
unwieldy sensing devices. Their compact size,
flexibility, and resistance to electromagnetic
interference make them promising candidates for
future applications, facilitating remote
measurements. These sensors find utility across
diverse domains, including temperature, pressure,
and refractive index (RI) monitoring, along with the
quantification of biomarkers and chemical
compounds (Choudhary et al., 2023; Esposito et al.,
2021; Hernandez-Romano et al., 2015; Lu et al.,
2022; Soares et al., 2021a).
Various optical detection techniques exist,
necessitating diverse fiber geometries, materials, and
equipment for implementation. Plasmonic
approaches, such as surface plasmon resonance
(SPR), stand out for their swift, label-free, and real-
a
https://orcid.org/0000-0002-5032-6143
b
https://orcid.org/0000-0003-1187-5825
c
https://orcid.org/0000-0002-2987-9122
d
https://orcid.org/0000-0003-0872-5578
e
https://orcid.org/0000-0002-3540-7316
time sensitivity. In this mechanism, an interplay and
energy exchange transpire between photons from
incident light and electrons on a metal surface,
resulting in their collective oscillation. SPR manifests
at the interface between a dielectric and a metal
nanofilm, leading to the propagation of surface
plasmon polaritons (Esfahani Monfared, 2020; Mayer
& Hafner, 2011; Sansone et al., 2021).
Gold nanoparticles (AuNPs) are favored for
chemical and biosensor applications due to their
distinct features, including excellent compatibility,
intense light scattering/absorption, high surface area
to volume ratios, selective interoperability through
electrostatic interaction, stable structure, and non-
toxicity (Huong et al., 2021; Jain et al., 2006; Saha et
al., 2012; Zeng et al., 2011). Additionally, AuNPs are
employed for the excitation of a unique phenomenon
known as localized surface plasmon resonance
(LSPR), extensively explored in recent sensing
platforms due to its significant advantages (Chau et
al., 2006; Do et al., 2020; Guerreiro et al., 2014).
110
Moslemi, A., Sansone, L., Esposito, F., Campopiano, S., Giordano, M. and Iadicicco, A.
Localized Surface Plasmon Resonance on Optical Fiber Surface for Chemical Sensing.
DOI: 10.5220/0012593500003651
Paper published under CC license (CC BY-NC-ND 4.0)
In Proceedings of the 12th International Conference on Photonics, Optics and Laser Technology (PHOTOPTICS 2024), pages 110-117
ISBN: 978-989-758-686-6; ISSN: 2184-4364
Proceedings Copyright © 2024 by SCITEPRESS – Science and Technology Publications, Lda.
LSPR offers a compact, label-free, highly sensitive,
and stable biosensing approach for detecting
biological molecules (Wang et al., 2017; Willets &
Van Duyne, 2007). This phenomenon in metallic
nanostructures is associated with the resonance of
free-electron waves in metal. Incident light can
resonate with the oscillations of surface electrons at
an excitation frequency, leading to the collective
oscillation of surface plasmons, referred to as an
LSPR mode (Unser et al., 2015).
In this paper, a fiber optic sensor is introduced for
monitoring changes in the concentration of chemicals
in a solution by measuring the refractive index. The
proposed sensor is based on the deposition of gold
nanoparticles around the fiber. The novelty in this
study lies in utilizing both single and aggregated
nanoparticle spectra to sense the surrounding
refractive index area, supported by numerical results.
2 NUMERICAL RESULTS
In the numerical analysis, the Finite Element Method
(FEM) is employed to simulate the interaction of light
with AuNPs. At the core of this simulation lies either
a single or an aggregate of nanoparticles, with a
diameter of 50 nm for the single NP. Surrounding this
central element is a 200 nm thick dielectric layer, and
beyond that, another 200 nm dielectric layer acts as a
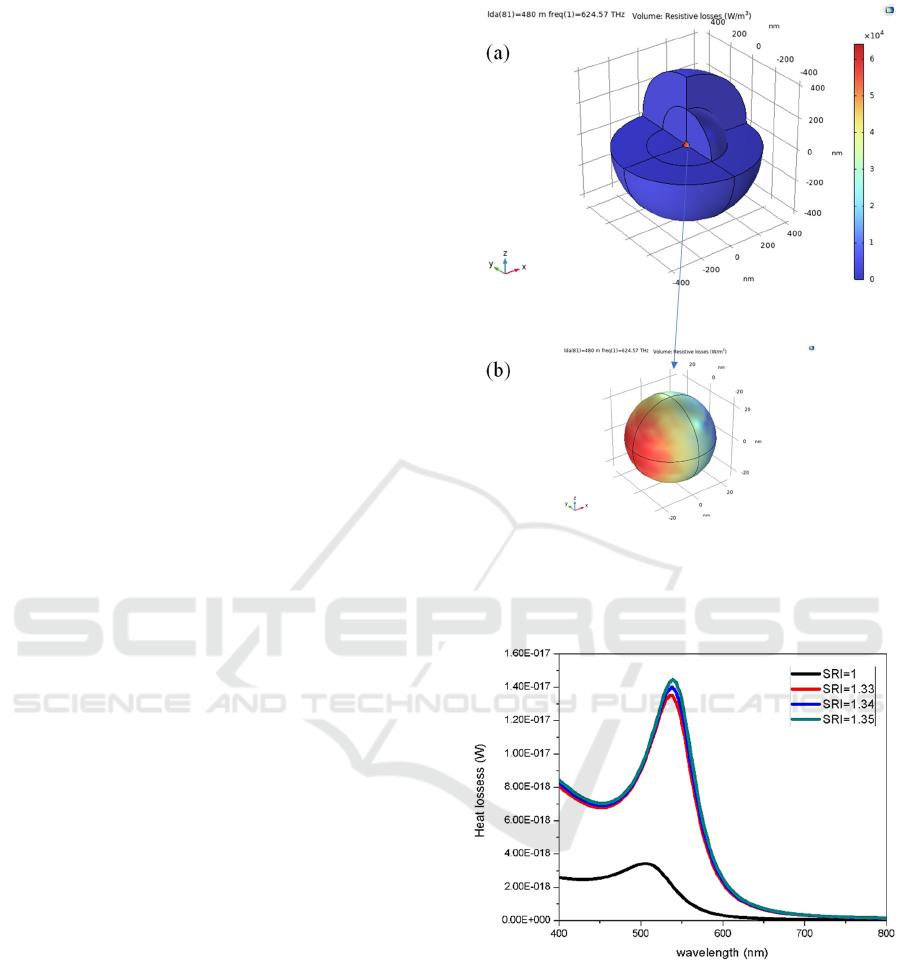
Perfectly Match Layer (PML), as reported in Figure
1(a) whereas the zoom on the AuNP is highlighted in
Figure 1(b).
The purpose of the PML is to establish an infinite
dielectric environment around the gold structure. This
configuration ensures that incident light is not
reflected toward the gold structure, consequently
minimizing the impact on the absorption band. The
incoming light is planar in the z-direction, ranging
from -z to +z, and polarized in the x-direction. The
power of the illumination is maintained at 1 W/m².
Utilizing the FEM, the heat losses for each
wavelength in VIS range are computed and
subsequently plotted. This enables the plot of heat
losses curve versus wavelength, i.e., the absorption
spectrum. The red line in Figure 2 plots the absorption
spectrum of a single 50 nm AuNP in water.
According to (Lei et al., 2023; Litti & Meneghetti,
2019), 50 nm AuNP exhibits an absorption maximum
at around 𝝀 = 535 nm. Interestingly, increase in AuNP
size are manifested in slight redshift of the AuNPs
absorption band. In the initial phase, the absorption
spectrum of a single nanoparticle is investigated
across various surrounding refractive indices (SRI) to
determine sensitivity, as shown in Figure 2.
Figure 1: Schematic of the simulation environment: (a),
various layers, encompassing the PML, dielectric layers,
and the gold structure; (b) the electric field distribution
around the individual gold nanoparticle.
Figure 2: Absorption band of single AuNP in different
environments: air, water, and a dielectric environment with
refractive indices of 1.34 and 1.35.
Altering the refractive index of the surrounding
medium induces a redshift in the absorption band
peak. By tracking the resonance wavelength of this
peak, as reported in Figure 3, the sensitivity of the
system can be computed. This sensitivity value is
determined to be around 200 nm/RIU (Refractive
Index Unit, RIU).
Localized Surface Plasmon Resonance on Optical Fiber Surface for Chemical Sensing
111
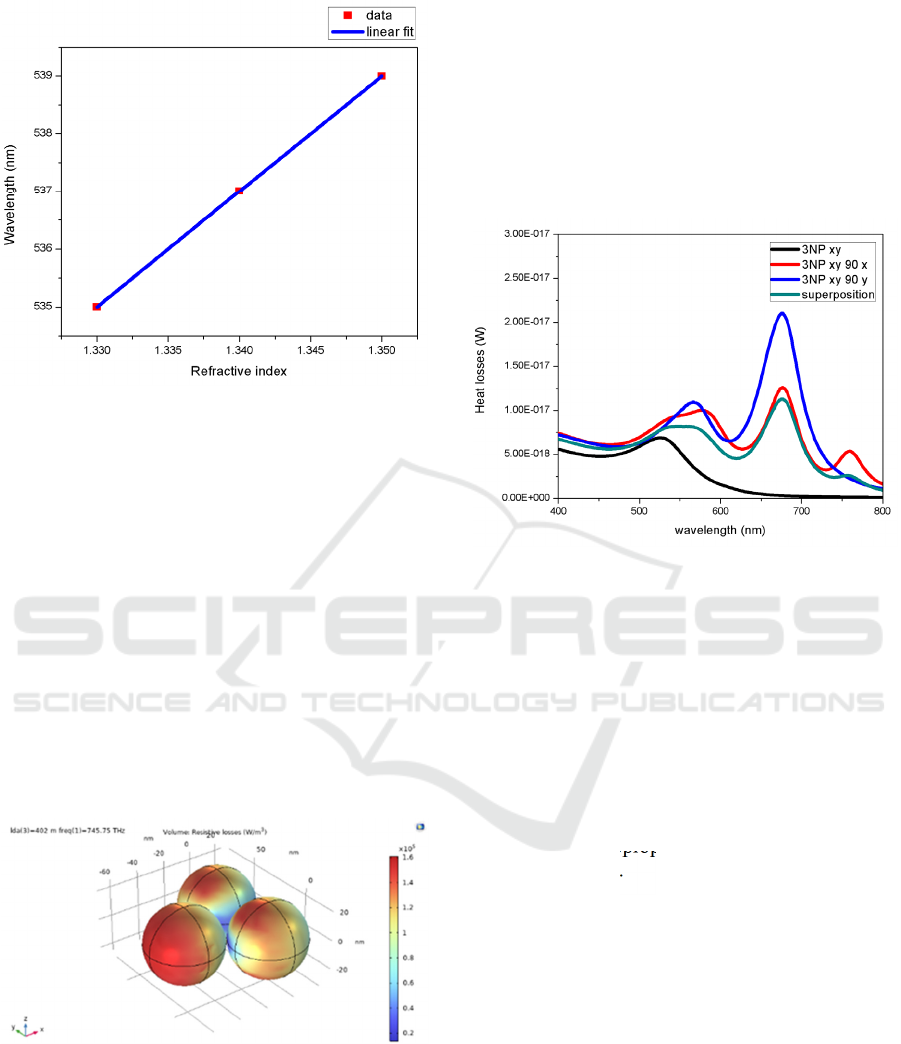
Figure 3: Tracking of the resonance wavelength of the
absorption band peak of a single gold nanoparticle across
various surrounding refractive index values.
The aim of the subsequent phase of the numerical
simulation is the investigation of the effect of the
aggregations. A full understanding demands various
aggregation states to be explored. However, here,
groups of 3 nanoparticles, each with a 50 nm
diameter, are aggregated as reported in Figure 4, just
as an example. The absorption band for each structure
is then calculated. In a unique approach, each
structure undergoes a 90° rotation around the x, y, and
z axes during stimulation. Following this rotation, the
superposition of all absorption spectra is computed.
This step is essential, mirroring real-world scenarios
where aggregated nanoparticles exhibit rotational
dynamics.
Figure 4: Distribution of absorption energy from incident
light on the surface of three aggregated golden
nanoparticles.
The resulting output spectrum is a superposition
of numerous structures, incorporating different
numbers of nanoparticles and incident angles. In
Figure 5, the spectra of 3 nanoparticle group under
various incident light angles are depicted, along with
their superposition. The superposition spectrum
exhibits two mean resonance wavelengths at 560 nm
and 678 nm, respectively. Although this analysis is
not sufficient to investigate the state of all
aggregations, we can retrieve that single AuNPs show
an absorption peak around 520 nm whereas AuNPs
aggregations, due to the larger size, show an
absorption peak at a higher wavelength (Litti &
Meneghetti, 2019).
Figure 5: Absorption spectrum related to the superposition
of different configurations involving 3 single nanoparticles.
3 MATERIALS AND METHODS
3.1 Chemicals
Tetrachloroauric acid (HAuCl₄·3H₂O, 99%) and
trisodium citrate (99%) were purchased from Merck
Life Science (Milano, Italy), along with distilled
water. Piranha solution (mixture of H
2
SO
4
and H
2
O
2
7:3 v/v). (3-Aminopropyl)triethoxysilane (APTES) in
acetone (5% w/w).
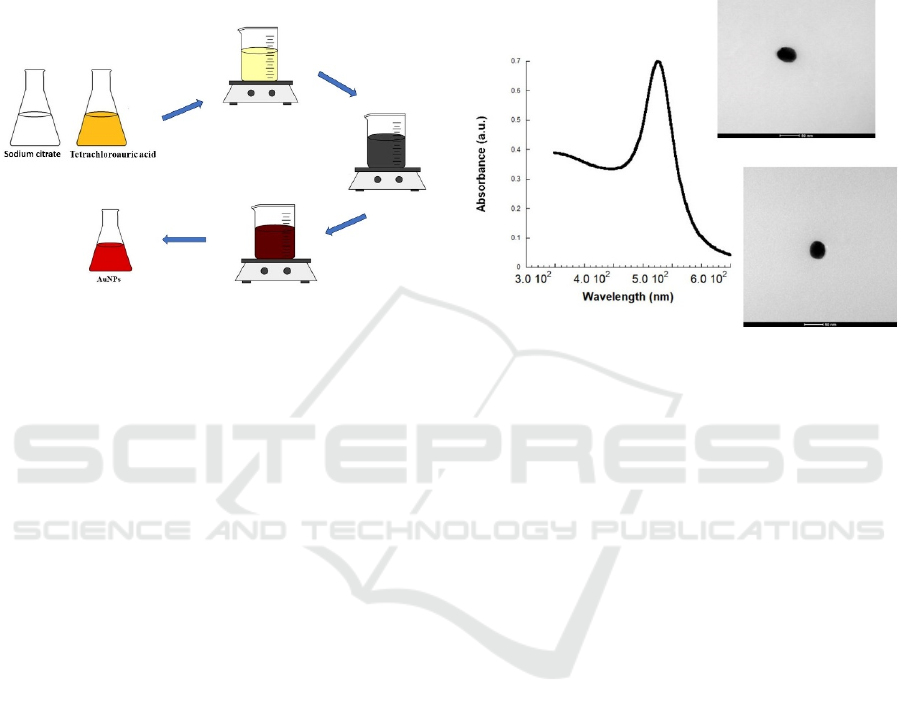
3.2 AuNPs Preparation and
Characterization
A solution containing 2.2 mM sodium citrate in
distilled water (150 mL) was heated using a heating
mantle in a 250 mL three-necked round-bottomed
flask for 15 minutes under vigorous stirring. A
condenser was employed to prevent solvent
evaporation. Once boiling started, 1 mL of HAuCl₄
(25 mM) was injected. The solution colour
transitioned from yellow to bluish-grey and then to a
soft pink within 10 minutes. Immediately following
the synthesis of the Au seeds and within the same
reaction vessel, the reaction was cooled until the
solution temperature reached 90 °C. Subsequently, 1
AOMatDev 2024 - Special Session on Advanced Optical Materials and Devices
112
mL of a HAuCl₄ solution (25 mM) was injected. After
30 minutes, the reaction was concluded. This process
was repeated twice. Subsequently, the sample was
diluted by extracting 55 mL of the solution and
adding 53 mL of MQ water and 2 mL of 60 mM
sodium citrate. This resulting solution served as the
seed solution, and the process was reiterated five
times (Figure 6).
Figure 6: Synthesis of gold nanoparticles.
To examine the morphology of AuNPs,
transmission electron microscopy (TEM)
experiments were carried out using a TEM FEI
Tecnai G12 Spirit Twin equipped with a LaB6
emission source (120 kV) and coupled with a CCD
camera Fei Eagle 4K (Japan). For TEM specimen
preparation, a drop of the diluted AuNPs suspension
was deposited onto a carbon-coated copper grid.
Subsequently, the sample was air-dried and loaded
into the electron microscope chamber.
The mean size and distribution of the
nanoparticles were determined through dynamic light
scattering (DLS) analysis. The measurements were
conducted at 25 °C using a Malvern DLS instrument
(model Zetasizer Nano ZS90, Malvern Instruments
Ltd., Worcestershire, UK), featuring a He-Ne laser
source at 632.8 nm and a detector set at a scattering
angle of 90°. Low-volume quartz batch cuvettes
(model ZEN2112, Malvern Instruments Ltd.,
Worcestershire, UK) served as the sample cells.
UV-Vis absorption spectra of AuNPs were
obtained using an Agilent Cary 60 UV/Vis
spectrophotometer, employing quartz cuvettes. To
prevent absorption saturation, dispersion samples
were appropriately diluted in deionized water at a
ratio of 1:8 v/v.
The two AuNPs water solutions were diluted at a
ratio of 1:10 v/v, and their size and polydispersity
index (PDI) were assessed through DLS analysis. The
presence of a single peak was observed for the AuNPs
solutions, corresponding to a size of 50.4 ± 5 nm (PDI
= 0.019). Additionally, the low values of PDI indicate
the high quality and monodisperses of the AuNPs
water solution. Figure 7 displays the visible (VIS)
spectrum of AuNPs, revealing a plasmon resonance
band at 535 nm. The narrow shape of the band
suggests a high uniformity in particle sizes.
According to (Bastús et al., 2011), the size of AuNPs
is approximately 50 nm.
Figure 7: UV spectrum and SEM images of AuNPs 50 nm.
3.3 Optical Transducer
The functioning principle of this sensor is grounded
in the response of 50 nm gold nanoparticles to
chemicals, probed by a fibre optics transducer, as
schematically reported in Figure 8.
The transducer incorporates a multimode fiber
(MMF) with core/cladding size of 105/125 µm
spliced with a short piece (less than 5 cm) of coating
free glass thin fiber with diameter of 80 µm.
To design a simple probe and capture the
reflection spectrum, the second end of the thin fiber
is sharply cut and mirrored to enhance reflection
power. Due to the fiber size mismatching, light in thin
fiber exhibits evanescent waves interacting with
surrounding medium.
Subsequently, nanoparticles are deposited around
the thin fiber, revealing an attenuation band in the
reflected spectrum of the device. Such attenuation
band is located at those wavelengths for which the
light is absorbed by the presence of nanoparticle, as
illustrated in the simulation section. This spectrum
changes in response to variations in the environment,
influencing the electrical and optical properties of
nanoparticles. Here, these changes are monitored to
sense alterations in the surrounding area.
Localized Surface Plasmon Resonance on Optical Fiber Surface for Chemical Sensing
113
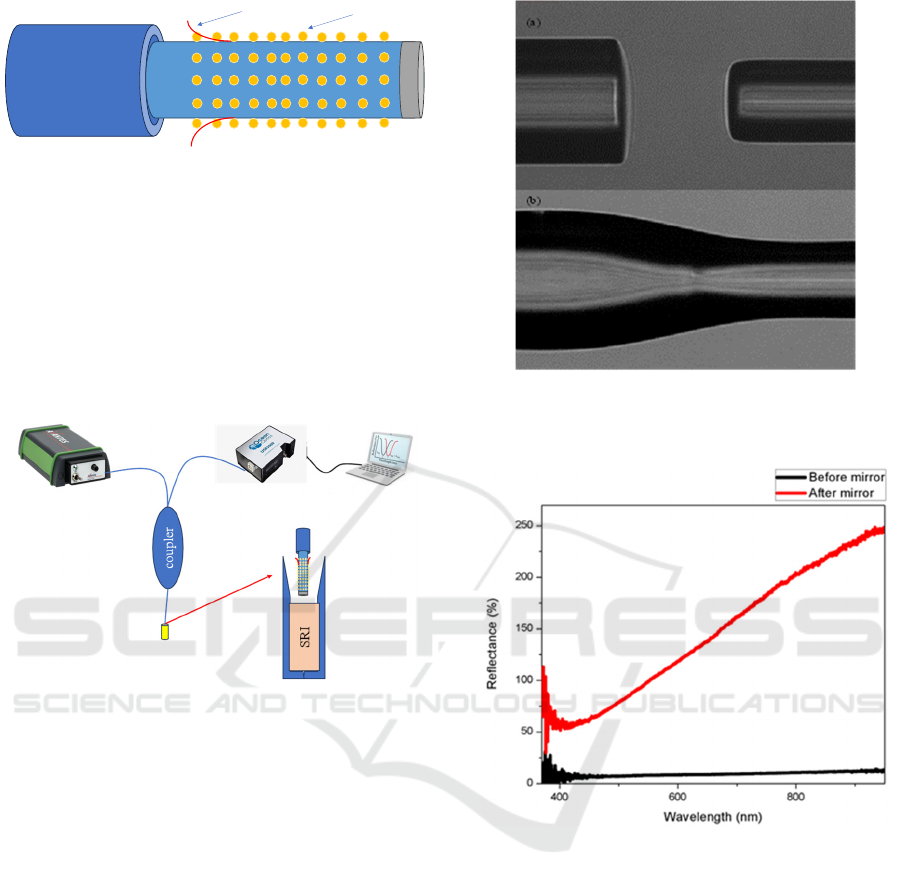
Figure 8: Schematic of Optical Transducer.
3.4 Experimental Setup
The optoelectronic readout experimental arrangement
is shown in Figure 9 and comprises a broadband light
source (Avantes AvaLight-HAL-S-Mini). The light is
conveyed to the transducer using one branch of a
multimode fiber coupler, and the resulting reflection
spectrum is directed to a spectrometer (Ocean Optic
HR2000+) via the second channel of the coupler.
Figure 9: Schematic of the optoelectronic readout setup.
4 FABRICATION OF THE FIBER
PROBE
The multimode fiber with 105/125 µm core/cladding
diameter (FG105LCA Thorlabs) was fused with a 5
cm length of 80 µm thin fiber (SM1500(4.2/80)
Fibercore). A microscope picture of the fibers is
reported in Figure 10(a) and Figure 10(b), before and
after the splicing, respectively. The free end of the
multimode fiber was linked to the coupler. Then the
second end of the thin fiber was sharply cleaved and
mirrored using Tollen’s reaction.
Figure 11 plots the spectra of the fiber device
during the fabrication steps using the cleaved
multimode fiber as reference. Consequently, the
reflectance after coating the mirror exceeds 100% due
to this factor. According to Figure 11, this resulted in
an approximately fivefold increase in the amplitude
of the reflection signal.
The subsequent step involved depositing
nanoparticles onto the fiber. Given that neutral glass
Figure 10: Microscope images: a) Multimode and thin fiber
before splicing; b) The spliced area of the multimode fiber
and thin fiber.
Figure 11: Reflection spectrum of the transducer before and
after mirror.
is not inherently attractive to gold nanoparticles, it
was essential to impart a positive charge to the glass
surface through a surface functionalization. To
achieve this, the thin fiber was immersed in a piranha
solution (mixture of H
2
SO
4
and H
2
O
2
) for one hour,
subsequently washed with water. This procedure has
been carried before mirror to avoid any damage due
to the chemicals.
Following, the mirrored fiber was immersed in
APTES (5% w/w) for two hours, washed with
acetone, and allowed to air-dry overnight (Soares et
al., 2021b; Sypabekova et al., 2022).
Subsequently, the fiber was immersed in the
solution containing gold nanoparticles (50 nm, 1 mM)
for 2.5 hours and left to dry overnight. Figure 12
Multimode
Fiber
Thin fiber
Silver mirror
Au NP
evanescence wave
AOMatDev 2024 - Special Session on Advanced Optical Materials and Devices
114
illustrates the spectrum of the transducer after
depositing gold nanoparticles, taken in the air using
the mirrored fiber (red line of Figure 11) as reference.
Here, two minima are well visible; based on the
numerical section, we retrieve that the left one is
related to single AuNPs whereas the wide attenuation
peak at higher wavelength can be attributed to AuNPs
aggregations.
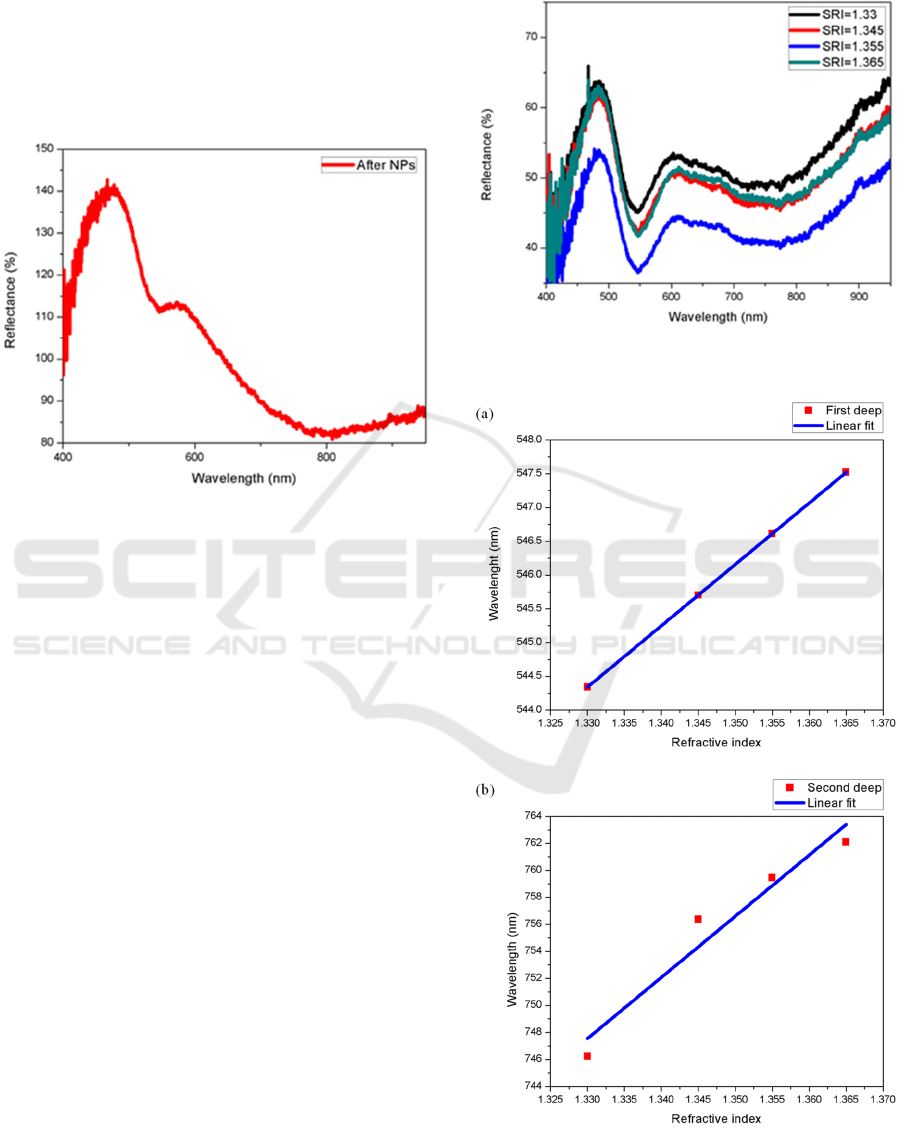
Figure 12: Reflection spectrum of the transducer in air after
depositing nanoparticles.
5 SENSING RESULTS
The sensor sensitivity was assessed through
experimentation with the surrounding refractive
index. In this evaluation, various solutions were
prepared by blending deionized water and glycerine
in different proportions. The precise refractive index
of each solution was then determined using an Abbe
refractometer.
Subsequently, the sensing area was fully
immersed in each solution. The spectrum was
recorded, and the fiber was extracted, sequentially
immersed in deionized water to rinse off glycerine
residues, air-dried briefly, and the process was
repeated for subsequent solutions.
As one can observe in Figure 13, both the first and
second peaks exhibited a redshift with an increase in
the refractive index, which agrees well with
numerical simulations.
For tracing the resonance wavelength of the
minima, a second-order polynomial was fitted to each
one, and then the minimum of each polynomial was
traced. Figure 14 illustrates the shift of each
minimum. The sensitivity of the first and second
peaks was found to be around 90 nm/RIU and 450
nm/RIU, respectively. It is noteworthy that the
sensitivity of the second peak surpasses that of the
first peak by more than fourfold.
Figure 13: Reflection spectrum of the transducer in
different surrounding area refractive indices.
Figure 14: Resonance wavelength shift data and linear fit
for the (a) first and (b) second minima, respectively.
Localized Surface Plasmon Resonance on Optical Fiber Surface for Chemical Sensing
115

6 CONCLUSIONS
In conclusion, this paper conducted simulations on
various configurations of nanoparticle aggregation,
calculating absorption bands for each scenario.
Subsequently, a novel fiber optics probe was
designed and fabricated, relying on the deposition of
nanoparticles on the thin fiber surface. The key
innovation lies in exploring the sensitivity of the first
and second peaks, corresponding to single and
aggregated nanoparticles, respectively. The
sensitivity to the surrounding refractive index was
found to be 90 nm/RIU for the first peak and 4 times
higher, at 450 nm/RIU, for the second peak. This
sensor holds promise for applications in sensing
chemical concentrations based on changes in the
surrounding refractive index around nanoparticles.
REFERENCES
Bastús, N. G., Comenge, J., & Puntes, V. (2011).
Kinetically Controlled Seeded Growth Synthesis of
Citrate-Stabilized Gold Nanoparticles of up to 200 nm:
Size Focusing versus Ostwald Ripening. Langmuir,
27(17), 11098–11105. https://doi.org/10.1021/la2019
38u
Chau, L.-K., Lin, Y.-F., Cheng, S.-F., & Lin, T.-J. (2006).
Fiber-optic chemical and biochemical probes based on
localized surface plasmon resonance. Sensors and
Actuators B: Chemical, 113(1), 100–105.
https://doi.org/10.1016/j.snb.2005.02.034
Choudhary, S., Esposito, F., Sansone, L., Giordano, M.,
Campopiano, S., & Iadicicco, A. (2023). Lossy Mode
Resonance Sensors in Uncoated Optical Fiber. IEEE
Sensors Journal, 23(14), 15607–15613. https://doi.org/
10.1109/JSEN.2023.3280675
Do, P. Q. T., Huong, V. T., Phuong, N. T. T., Nguyen, T.-
H., Ta, H. K. T., Ju, H., Phan, T. B., Phung, V.-D.,
Trinh, K. T. L., & Tran, N. H. T. (2020). The highly
sensitive determination of serotonin by using gold
nanoparticles (Au NPs) with a localized surface
plasmon resonance (LSPR) absorption wavelength in
the visible region. RSC Advances, 10(51), 30858–
30869. https://doi.org/10.1039/D0RA05271J
Esfahani Monfared, Y. (2020). Overview of Recent
Advances in the Design of Plasmonic Fiber-Optic
Biosensors. Biosensors, 10(7), 77. https://doi.org/10.33
90/bios10070077
Esposito, F., Srivastava, A., Sansone, L., Giordano, M.,
Campopiano, S., & Iadicicco, A. (2021). Label-Free
Biosensors Based on Long Period Fiber Gratings: A
Review. IEEE Sensors Journal, 21(11), 12692–12705.
https://doi.org/10.1109/JSEN.2020.3025488
Guerreiro, J. R. L., Frederiksen, M., Bochenkov, V. E., De
Freitas, V., Ferreira Sales, M. G., & Sutherland, D. S.
(2014). Multifunctional Biosensor Based on Localized
Surface Plasmon Resonance for Monitoring Small
Molecule–Protein Interaction. ACS Nano, 8(8), 7958–
7967. https://doi.org/10.1021/nn501962y
Hernandez-Romano, I., Monzon-Hernandez, D., Moreno-
Hernandez, C., Moreno-Hernandez, D., & Villatoro, J.
(2015). Highly Sensitive Temperature Sensor Based on
a Polymer-Coated Microfiber Interferometer. IEEE
Photonics Technology Letters, 27(24), 2591–2594.
https://doi.org/10.1109/LPT.2015.2478790
Huong, V. T., Phuong, N. T. T., Tai, N. T., An, N. T., Lam,
V. D., Manh, D. H., Chi, T. T. K., Mai, N. X. D., Phung,
V.-D., & Tran, N. H. T. (2021). Gold Nanoparticles
Modified a Multimode Clad-Free Fiber for
Ultrasensitive Detection of Bovine Serum Albumin.
Journal of Nanomaterials, 2021, 1–6. https://doi.org/
10.1155/2021/5530709
Jain, P. K., Lee, K. S., El-Sayed, I. H., & El-Sayed, M. A.
(2006). Calculated Absorption and Scattering
Properties of Gold Nanoparticles of Different Size,
Shape, and Composition: Applications in Biological
Imaging and Biomedicine. The Journal of Physical
Chemistry B
, 110(14), 7238–7248. https://doi.org/
10.1021/jp057170o
Lei, H., Zhu, S., Liu, C., Zhang, W., Chen, C., & Yan, H.
(2023). Constructing the Au nanoparticle multimer on
optical fiber end face to enhance the signal of localized
surface plasmon resonance biosensors: A case study for
deoxynivalenol detection. Sensors and Actuators B:
Chemical, 380, 133380. https://doi.org/10.1016/j.snb.
2023.133380
Litti, L., & Meneghetti, M. (2019). Predictions on the SERS
enhancement factor of gold nanosphere aggregate
samples. Physical Chemistry Chemical Physics, 21(28),
15515–15522. https://doi.org/10.1039/C9CP02015B
Lu, J., Yu, Y., Qin, S., Li, M., Bian, Q., Lu, Y., Hu, X.,
Yang, J., Meng, Z., & Zhang, Z. (2022). High-
performance temperature and pressure dual-parameter
sensor based on a polymer-coated tapered optical fiber.
Optics Express, 30(6), 9714. https://doi.org/10.1364/
OE.452355
Mayer, K. M., & Hafner, J. H. (2011). Localized Surface
Plasmon Resonance Sensors. Chemical Reviews,
111(6), 3828–3857. https://doi.org/10.1021/cr100313v
Saha, K., Agasti, S. S., Kim, C., Li, X., & Rotello, V. M.
(2012). Gold Nanoparticles in Chemical and Biological
Sensing. Chemical Reviews, 112(5), 2739–2779.
https://doi.org/10.1021/cr2001178
Sansone, L., Campopiano, S., Pannico, M., Giordano, M.,
Musto, P., & Iadicicco, A. (2021). Photonic bandgap
influence on the SERS effect in metal-dielectric
colloidal crystals optical fiber probe. Sensors and
Actuators B: Chemical, 345, 130149. https://doi.org/
10.1016/j.snb.2021.130149
Soares, M. S., Vidal, M., Santos, N. F., Costa, F. M.,
Marques, C., Pereira, S. O., & Leitão, C. (2021a).
Immunosensing Based on Optical Fiber Technology:
Recent Advances. Biosensors, 11(9), 305.
https://doi.org/10.3390/bios11090305
Soares, M. S., Vidal, M., Santos, N. F., Costa, F. M.,
Marques, C., Pereira, S. O., & Leitão, C. (2021b).
AOMatDev 2024 - Special Session on Advanced Optical Materials and Devices
116

Immunosensing Based on Optical Fiber Technology:
Recent Advances. Biosensors, 11(9), 305.
https://doi.org/10.3390/bios11090305
Sypabekova, M., Hagemann, A., Rho, D., & Kim, S.
(2022). Review: 3-Aminopropyltriethoxysilane
(APTES) Deposition Methods on Oxide Surfaces in
Solution and Vapor Phases for Biosensing
Applications. Biosensors, 13(1), 36. https://doi.org/
10.3390/bios13010036
Unser, S., Bruzas, I., He, J., & Sagle, L. (2015). Localized
Surface Plasmon Resonance Biosensing: Current
Challenges and Approaches. Sensors, 15(7), 15684–
15716. https://doi.org/10.3390/s150715684
Wang, Y., Zhou, J., & Li, J. (2017). Construction of
Plasmonic Nano‐Biosensor‐Based Devices for Point‐
of‐Care Testing. Small Methods, 1(11). https://doi.org/
10.1002/smtd.201700197
Willets, K. A., & Van Duyne, R. P. (2007). Localized
Surface Plasmon Resonance Spectroscopy and Sensing.
Annual Review of Physical Chemistry, 58(1), 267–297.
https://doi.org/10.1146/annurev.physchem.58.032806.
104607
Zeng, S., Yong, K.-T., Roy, I., Dinh, X.-Q., Yu, X., & Luan,
F. (2011). A Review on Functionalized Gold
Nanoparticles for Biosensing Applications.
Plasmonics, 6(3), 491–506. https://doi.org/10.1007/
s11468-011-9228-1
Localized Surface Plasmon Resonance on Optical Fiber Surface for Chemical Sensing
117
