
Cardiorespiratory Adaptations to Work Volume on an Automobile
Assembly Line
Dania Furk, Lu
´
ıs Silva
a
, Mariana Dias
b
, Phillip Probst
c
and Hugo Gamboa
d
Laborat
´
orio de Instrumentac¸
˜
ao, Engenharia Biom
´
edica e F
´
ısica da Radiac¸
˜
ao (LIBPhys-UNL), Departamento de F
´
ısica,
Faculdade de Ci
ˆ
encias e Tecnologia, FCT, Universidade Nova de Lisboa, 2829-516 Caparica, Portugal
Keywords:
Cardiovascular, Respiratory, Workload, Occupational Health.
Abstract:
Automobile assembly workers have to perform repetitive tasks with varying workload volumes, according to
their assigned workstation, on a daily basis. With inadequate recovery, this type of occupational activity has
been shown to cause cardiovascular problems. Despite these concerns, cardiovascular and respiratory adapta-
tions to workload variations are often overlooked. This study aims to analyze Electrocardiogram (ECG) and
Respiratory Inductance Plethysmography (RIP) data to understand the evolution of cardiorespiratory adapta-
tions to three specific work volumes. A sample of sixteen male operators (age = 38±8 years; BMI = 25 ± 3
kg.m
2
) volunteered from three workstations (H
1
, H
2
and H
3
) with different work cycle durations (1, 3 and
5 minutes, respectively). The results showed that activities with distinct workloads cause different responses
through the data collection in cardiovascular load, heart rate variability (HRV), and respiratory frequency, vari-
ability, and coordination. The workload volume and work phase both influenced the cardiorespiratory acute
response of the operators on the automobile assembly line, something that could improve individual-specific
management of tasks assigned to workers.
1 INTRODUCTION
In 2021, a survey (CEDEFOP, 2023) carried out by
the European Union determined that the majority of
workers within the EU are employed in the manu-
facturing sector. On average, employees such as ma-
chine operators and assemblers, work for 39.7 hours
per week (Eurostat, 2023).
For the majority of that time, operators are ex-
posed to numerous occupational hazards such as
repetitive movements, awkward postures, static po-
sitioning, and forceful exertions (Niu, 2010). These
types of activities have been shown to have conse-
quences for worker’s cardiovascular health, due to the
prolonged, low to moderate intensity nature of the
physical activity performed (Holtermann et al., 2018).
Another problem with this type of occupation is the
insufficient recovery of the cardiac system, leading
to continuous stimulation of the body’s inflammatory
response, which can lead to the development of car-
diac risks and diseases or their aggravation (Geurts
and Sonnentag, 2006).
a
https://orcid.org/0000-0001-9811-0571
b
https://orcid.org/0000-0002-0172-4559
c
https://orcid.org/0000-0003-3239-9813
d
https://orcid.org/0000-0002-4022-7424
Specifically, assembly-line jobs have been pre-
viously linked with high blood pressure, (Pickering
et al., 1996), atherosclerosis (Krause et al., 2007), a
well-known cardiovascular risk, increased mortality
(Krause et al., 2017) and long-term sickness absence
(Holtermann et al., 2012).
Regarding respiration, the monitoring of this
biosignal’s frequency is used to assess effort in sports
(Nicol
`
o et al., 2017b) and has shown its usefulness
in the identification of cognitive load, environmental
stress, and other relevant factors in occupational set-
tings (Massaroni et al., 2019).
Current occupational risk quantification tools con-
sider different body parts and key indicators of biome-
chanical load, where an expert fills in a pre-defined
scoring sheet by watching the workers perform their
tasks. Some of the most common scoring sheets are
the job strain index, OCRA (Occupational Repetitive
Action), the EAWS (European Assembly Worksheet),
and the revised NIOSH (National Institute for Occu-
pational Safety and Health) equation (Andreas and Jo-
hanssons, 2018). The last equation, besides establish-
ing work practice guides for manual lifting defining
limits on workload, recommends that the demands
put on workers should not surpass 30% of their aer-
obic capacity in an 8-hour continuous shift (NIOSH,
1981).
Furk, D., Silva, L., Dias, M., Probst, P. and Gamboa, H.
Cardiorespiratory Adaptations to Work Volume on an Automobile Assembly Line.
DOI: 10.5220/0012587800003657
Paper published under CC license (CC BY-NC-ND 4.0)
In Proceedings of the 17th International Joint Conference on Biomedical Engineering Systems and Technologies (BIOSTEC 2024) - Volume 1, pages 71-81
ISBN: 978-989-758-688-0; ISSN: 2184-4305
Proceedings Copyright © 2024 by SCITEPRESS – Science and Technology Publications, Lda.
71

The incorporation of this risk information into
workplace management has shown positive outcomes
such as a reduction in work-related illnesses, workers’
compensation costs, absenteeism, and increased pro-
ductivity (Goggins et al., 2008; Baraldi and Kamin-
ski, 2011). These methods present multiple shortcom-
ings as they focus only on the biomechanical aspect of
work not accounting for other factors such as individ-
ual specific differences and physiological load. Fur-
thermore, this analysis relies mainly on observational
methods, that are time-consuming and less accurate
for smaller body parts (Takala et al., 2010), also giv-
ing limited knowledge about internal adaptations to
the task (van der Beek and Frings-Dresen, 1998).
The use of wearables allows the direct measure-
ment of motion and biosignals activity in real-time,
providing means to more individual-specific plan-
ning and interventions in real occupational settings
(Romero et al., 2016; Goggins et al., 2008)
Previous studies on real assembly lines have put
their main focus on cardiovascular response. Lund-
berg et al. measured self-reports of work charac-
teristics and of perceived physical load, accompa-
nied by the evaluation of objective measures: HR
(Heart Rate), blood pressure, catecholamines, and
cortisol, finding that perceived stress was associated
with neuroendocrine response and that during work
both HR and blood pressure were significantly in-
creased (Lundberg et al., 1989). To study the impact
of minimization of non-productive time during work
activities, to complement biomechanical exposure,
Palmerud et al. and Kazmierczak et al. quantified
job exposure based on HR monitoring by extracting
the Reserve Heart Rate (RHR) of the workers, where
the first one found that mean HR decreased (Palmerud
et al., 2012), and the latter, when adopting this
strategy, increased cardiovascular load.(Kazmierczak
et al., 2005). The modeling of ideal working time
based on energy expenditure of assembly-line work-
ers was also developed, based on moderate workload
tasks (Ayabar et al., 2015). The energy expenditure
was computed based on HR measurements of work-
ers, with smart watches, from three different assembly
lines.
Research on the effect of this kind of work on car-
diorespiratory adaptations has also been made. Nar-
dolillo et al. simulated assembly line tasks and ex-
tracted Heart Rate Variability (HRV) from HR of par-
ticipants, measured with a wearable device. The par-
ticipants included individuals who were either cur-
rently employed in the sector or a related field, as
well as students of varying ages and genders. It was
concluded that there were no significant differences
in frequency domain metrics between stages of work,
but there were marked differences in some of the
time metrics Mean RRi (intervals between consecu-
tive heartbeats), Standard Deviation (SD) of Normal
to Normal RRi intervals, and RRi Triangular Index)
between some of the trials (Nardolillo et al., 2017).
In our previous work, both Respiratory Induc-
tance Plethysmography (RIP) and ECG were mon-
itored in simulated repetitive tasks under a fatigue-
inducing protocol, where thoraco-abdominal coordi-
nation (Silva et al., 2022) and HRV (Carvalho et al.,
2023) parameters were analyzed from non-worker
participants. In these studies, results showed a de-
crease in correlation and PS between the respiratory
movements of the chest and abdominal walls, and a
decrease in HRV between trials.
It was verified that current research on assembly
lines focused on exploring RHR (Relative Heart Rate)
as a measure of job exposure, aiming to predict or an-
alyze the effects of interventions made on the line or-
ganization, not considering other physiological mea-
sures. The ones that do, normally were simulated
tasks, not in a real work context and their participants
weren’t workers of the sector.
This study aimed to check for possible health is-
sues related to heart and breathing functions caused
by car manufacturing tasks. We monitored workers’
heart and respiratory signals, ECG, and RIP, respec-
tively, on a real assembly line during their regular
work.
This work is part of the OPERATOR 4.0
project (Zenithwings, Fraunhofer AICOS, LIBPhys-
UNL, Volkswagen Autoeuropa, NST Apparel Lda,
FPCEUP, Controlconsul, Universidade do Minho, In-
stitute for Medical Engineering and Science at MIT,
2020), which has the support of MIT Portugal.
The remaining sections of this document are or-
ganized as follows: in Section 2 the materials and
methods used are described, including a brief descrip-
tion of the study sample, the followed data acquisition
protocol, and adopted statistical analysis. In Section
4 the results are presented, in Section 5 their discus-
sion, and in Section 6 the drawn conclusions and the
proposed future work.
2 MATERIALS AND METHODS
To characterize cardiovascular and respiratory re-
sponses to cyclical work, multiple biosignals of as-
sembly line operators were monitored on the field,
during real tasks.
BIODEVICES 2024 - 17th International Conference on Biomedical Electronics and Devices
72

2.1 Participants
The collected data of 16 subjects from the assembly
workstations were analyzed (age: 38 ± 8 yrs; body
mass index: 25 ± 3 kg.m
2
; physical activity: 220 ±
135 minutes per week).
To be able to analyze the physiological response to
distinct work volumes, the included participants were
part of three workstations of the assembly processes,
8 from H
3
, 4 from H
2
, and 4 from H
1
. All were right-
handed male workers on automotive assembly lines
and all rotate between workstations.
2.2 Workstations
In this factory, the manufacturing of vehicles relies
on multiple processes. This study focused only on the
activities carried out in the final stage of production
as they rely on manual handling: the assembly and
alignment of the last parts to be mounted on the car.
The tasks performed at the studied workstations are
specified:
• The setting of tail lights and prefit alignments
were recorded in H
1
, these tasks had a mean cycle
time of 3 minutes.
• At H
2
alignments of the side doors, rear end, and
front end were analyzed, with the mean duration
of the cycle being 5 minutes.
• At last, in the H
3
area the final stages of the as-
sembly are performed: rear-view mirror, cowl top,
boot panel, and the trunk symbol mounting were
monitored, these activities had a cycle-time of 1
minute.
In Figure 1 the dominant positions in which work-
ers perform each of the activities mentioned above are
represented.
2.3 Data Collection
Following the reading and signing of the informed
consent, personal information (age, height, physical
activity habits, and dominant hand) was asked of the
participants. After this, their body mass was mea-
sured with a digital scale.
Next, all devices for the biosignals monitoring
were mounted (further detailed in the following sub-
section), and the volunteers placed the mobile phone
in their uniform pockets, and their activity was moni-
tored for about 50 minutes of normal occupational ac-
tivity. Simultaneously with the beginning of the data
collection, a video of the first 4-5 cycles of the per-
formed task was recorded.
Figure 1: Dominant positions of the tasks from each work-
station.
The study was conducted in accordance with the
Declaration of Helsinki, and the protocol was ap-
proved by the Ethics Committee of the University of
Porto.
2.3.1 Sensor Setup
The followed protocol comprised the measurement
of ECG, RIP, and ACC signals. The sensor placing
started by cleaning the skin areas on which electrodes
were to be attached, to optimize skin-electrode con-
ductivity, hair removal, abrasion, and alcohol clean-
ing were done on each subject.
Firstly, three disposable adhesive Ag/AgCl elec-
trodes (Ambu
®
), attached to each electrode cable
from the ECG sensor (PLUX WIRELESS BIOSIG-
NALS S.A.), were placed in a configuration to min-
imize arm and chest movement artifacts. On the left
side of the sternum, the positive was positioned at the
level of the manubrium, and the negative was put on
the superior part of the sternum’s body. The ground
electrode was placed on the left anterior superior iliac
spine.
Following this, RIP signals were monitored with
two inductive sensors (PLUX WIRELESS BIOSIG-
NALS S.A.) attached to two elastic belts: one over the
chest passing underarms and the other band at the um-
bilicus level (Gastinger et al., 2014; Silva et al., 2022),
they were adjusted to the participant’s anatomy.
A triaxial ACC (PLUX WIRELESS BIOSIG-
NALS S.A.) was also used and was placed on the cen-
ter of the lower back, secured with an elastic belt.
Cardiorespiratory Adaptations to Work Volume on an Automobile Assembly Line
73

Figure 2: Sensor setup for signal acquisition.
These three sensors with an acquisition rate of
350 Hz, were all connected to the 8-channel wireless
Hub, PLUX Biosignals (PLUX WIRELESS BIOSIG-
NALS S.A.), that streamed the data from each of
the sensors to the opensignals, (PLUX WIRELESS
BIOSIGNALS S.A.) software, to a smartphone (Xi-
aomi Redmi Note 9, running Android 10).
The right trapezius’ and biceps’ motion data was
also captured with two MuscleBAN, (PLUX WIRE-
LESS BIOSIGNALS S.A.) devices, at a rate of
1000 Hz and also transmitted to opensignals, (PLUX
WIRELESS BIOSIGNALS S.A.).
The ACC data from the lower back, bicep, and
trapezius were acquired for purposes of device syn-
chronization and signal segmentation since the tasks
involve a lot of repetitive arm movements.
A scheme of the sensor configuration is shown in
Figure 2.
2.4 Signal Processing
2.4.1 Electrocardiography
Most of the features that were extracted from the
ECG signal are based on the detection of the R
peaks, so other wave shapes were suppressed to high-
light them. To do that, a Maximum Overlap Dis-
crete Wavelet Transform (MODWT) was used to fil-
ter ECG, given the non-stationary nature of this sig-
nal (Hess-nielsen and Wickerhauser, 1996; Chen and
Tsui, 2020), where the chosen wavelet for each sub-
ject was based on the maximization of the signal en-
ergy to signal Shannon entropy ratio (He et al., 2015),
resulting in the db2 wavelet being the best one. These
time series were decomposed into 6 wavelet levels,
and the signal was reconstructed with the level 4 coef-
ficients by performing the inverse wavelet transform.
These coefficients corresponded to a frequency band
of 10.94-21.88 Hz. Next, an R-peak detection algo-
rithm based on the Shannon Energy Envelope (Xu
and Du, 2022) was applied to the filtered signals. The
first step was the normalization of the signal’s ampli-
tude, followed by the computation of its Shannon En-
ergy, and envelope using a moving root mean square
with a window of 70 samples. Like this, the R-peaks
were enhanced and were detected with the scipy’s
findpeaks function (Virtanen et al., 2020), applying
a minimum distance of 120 samples and a minimum
height of 0.15.
From the detected R-peaks several features were
extracted quantifying both HRV and Cardiovascular
Load as they have been previously used in multi-
ple studies to evaluate cardiovascular load in occupa-
tional context (Dias et al., 2023). The specific metrics
are indicated in Table 1.
Table 1: ECG extracted features.
HRV (ms) Cardiovascular Load (%)
SDRRi RHR
RMSSD CVL
SD1 CVS
SD2
SDRRi- Standard deviation of consecutive RR
peak intervals; RMSSD - Root Mean Square of
the consecutive RR peak intervals; RHR- Re-
serve Heart Rate; CVS- Cardiovascular Strain;
CVL- Cardiovascular Load; SD2- Poincar
´
e
plot standard deviation along the line of iden-
tity.
2.4.2 Respiratory Inductance Plethysmography
Initial filtering was made by a finite impulse response
bandpass with cut-off frequencies of 0.15 and 0.45Hz
(Silva et al., 2022). Next, the signal was decom-
posed in Intrinsic Mode Functions (IMFs) with a filter
BIODEVICES 2024 - 17th International Conference on Biomedical Electronics and Devices
74

based on Masked Sift Empirical Mode Decomposi-
tion (EMD) (Liu et al., 2013). IMF-4 was chosen to
reconstruct the respiratory signal as it was the one that
presented the most clear respiratory pattern. Both sig-
nals from the chest and abdominal belt were subjected
to this procedure.
From the filtered signal, respiratory rate (RR) in
breaths per minute was determined for both thoracic
and abdominal walls, with a zero-crossing detection
algorithm (R
´
etory et al., 2016). The rib-cage per-
centage (RC%) defined as the Rib Cage’s (RC) con-
tribution to tidal volume as a percentage of the sum
of both RC and Abdominal (ABD) volume varia-
tion (Ryan et al., 2020) was also computed. Full
Cross-correlation between RC and ABD signals was
extracted, using a moving window of 400 samples
(Makowski et al., 2021). At last, PS between the two
signals from each belt was determined, by applying
the Hilbert Transform to both signals and the subtrac-
tion of their extracted imaginary parts (phase) (Silva
et al., 2022).
2.4.3 Accelerometer
To denoise the ACC data obtained from the triax-
ial ACC mounted on the center of the lower back
and from the ACCs in the MuscleBAN devices, a
bandpass-filter with cut-off frequencies of 0.1Hz and
10Hz was used (Silva et al., 2022; Lester et al., 2004).
Next, the signals were smoothed with a window of 0.2
seconds.
2.5 Signal Segmentation
2.5.1 Signal Synchronization
To be able to identify cycles, the first step was to syn-
chronize the signals acquired from the multiple de-
vices. This was accomplished by first matching the
sampling frequencies of the signals, followed by their
alignment, by computing the full cross-correlation be-
tween the ACC signals of the three devices, as each
volunteer before data recordings was asked to perform
10 jumps, a marked movement to match these signals
in time, leaving all of them in the same initial condi-
tion.
2.5.2 Self-Similarity Matrix
As this study was done in a real automobile assem-
bly line, there were unexpected events, such as line
stops, bathroom breaks, and tasks performed with ad-
ditional movements or in a different way. Despite
that, the monitored activities should have a repeat-
ing pattern, as they are performed with specific move-
ments in a certain order. As no timestamps or videos
were available for the full acquisition the identifica-
tion of anomalies and cyclic patterns and the segmen-
tation of these signals was accomplished by a Self-
Similarity Matrix (SSM) method. This method has
already been used successfully to segment time se-
ries, in human activity recognition, biosignals seg-
mentation (Rodrigues et al., 2022), and in work-cycle
anomaly and pattern detection (Santos et al., 2021).
2.5.3 Data Cleaning
In the followed protocol, multiple sensors were used
simultaneously, which led some of them to fail to ac-
quire or to disconnect during the acquisition. Also,
in some cases, there were unexpected assembly line
stops, which led us to exclude those recordings from
the analysis, to guarantee that only comparable data
were used. All the signals were cut from the first to
the last detected work cycles. This way, the record-
ings were left with 40 minutes to be analyzed.
3 STATISTICAL ANALYSIS
To evaluate how workload affects cardiorespiratory
response throughout the acquisition, the signals were
studied at two-time points: the first and last 10 min-
utes, extracting the cardiac and respiratory indicators
at each of those times.
The employed statistical test was a Mixed
ANOVA, as there were two factors: the workstation
and the phase (first and last 10 minutes) at which
the metric was extracted. To be able to perform a
more robust test, the sample size was increased to bal-
ance the minority workstations, by cluster-based over-
sampling, i.e., generating artificial samples with the
SMOTE (Synthetic Minority Over-sampling TEch-
nique) algorithm (Chawla et al., 2002).
To guarantee that the results obtained were reli-
able, 500 simulations changing the random seed of
the over-sampler were performed and the determina-
tion of the p-value was computed with the harmonic
mean combined p-value method, as it is used for de-
pendent tests (Wilson, 2019).
The obtained p-values were corrected for viola-
tion of normality and equality of variance principles,
by using the Yeo-Johnson power transform (Yeo and
Johnson, 2000) and the Welch correction, respec-
tively. The considered level of significance was 5%
and when indicators were under it, they were further
analysed by the Tukey post-hoc.
Cardiorespiratory Adaptations to Work Volume on an Automobile Assembly Line
75

4 RESULTS
4.1 Cardiovascular Response
The most notable results of the mixed test were that
H
3
had an evident decrease in SDRRi, SD of RHR,
coefficient of variation of HR, and SD2. The H
2
workstation had a meaningful change in HR that de-
creased with time. The values of the extracted ECG
metrics of station H
1
were generally smaller and re-
mained constant through the recording.
The results from the Mixed ANOVA simulation
statistics of the cardiac indicators are presented in Ta-
ble 2 where the p-value of each interaction is shown,
and significant results are presented with an *.
Table 2: Mixed ANOVA results for the cardiovascular met-
rics.
Variables p
g
p
ph
p
int
HR 0.432 0.006* 0.043*
Max HR 0.486 0.097 0.038*
SDRRi 0.530 0.018* 0.009*
CV HR 0.273 0.001* 0.017*
RHR 0.229 <0.001* 0.021*
SD RHR 0.274 <0.001* 0.030*
CV RHR 0.071 0.563 0.007*
CVS 0.051 0.008* 0.094
CVL 0.027* 0.006* 0.058
CVL range 0.075 0.198 0.040*
SD2 0.502 0.015* 0.008*
HR- Heart Rate; SDRRi- Standard deviation of con-
secutive RR intervals; RHR- Reserve Heart Rate;
CVS- Cardiovascular Strain; CVL- Cardiovascu-
lar Load; SD2- Poincar
´
e plot standard deviation
along the line of identity; Max- Maximum; Min-
Minimum; SD Standard Deviation; CV- Coefficient
of Variation; p
g
- harmonic mean combined p-value
for the between factor; p
ph
- harmonic mean com-
bined p-value for the within factor; p
int
- harmonic
mean combined p-value for the interaction; * sig-
nificant result at a confidence level of 5%.
The post-hoc tests are presented in Figure 3.
4.2 Respiratory Response
The statistical analysis revealed that the mean and
maximal ABD RR was greater, and so was its SD
for the H
2
workstation. Substantial reduction in res-
piratory correlation and PS was seen for H
2
and H
1
stations, respectively. In contrast, H
3
subjects main-
tained the relationship between both wall motions
through the analyzed time, having the highest mean
values of this metric within the assembly line.
The results from the Mixed ANOVA simulation
tests of the respiratory indicators are presented in Ta-
ble 3.
Table 3: Mixed ANOVA results for the respiratory metrics.
Variables p
g
p
ph
p
int
Max RC 0.534 0.033* <0.001*
Min RC 0.891 0.533 <0.001*
SD RC 0.391 0.491 0.013*
ABD 0.190 0.468 <0.001*
Max ABD 0.697 <0.001* <0.001*
SD ABD 0.539 0.008* 0.077
Correlation 0.022* <0.001* 0.013*
PS 0.022* <0.001* 0.015*
RC- Ribcage; ABD- Abdominal; PS- Phase syn-
chrony; p
g
- harmonic mean combined p-value for
the between factor; p
ph
- harmonic mean combined
p-value for the within factor; p
int
- harmonic mean
combined p-value for the interaction; * significant
result at a confidence level of 5%.
The post-hoc results are presented in Figure 4.
5 DISCUSSION
This research aimed to better understand cardiores-
piratory adaptations to cyclical work of tasks with
specific work volumes, and determine if there were
acute changes in the explored indicators extracted
from ECG and RIP signals throughout the data col-
lection. It was expected that the physiological re-
sponse would change according to the different work-
load volumes that are associated with the workstation.
To do so, data was analyzed considering two factors:
phase and workstation.
In terms of the cardiovascular indicators, HR is
used as an indicator of the load put on the cardio-
vascular system (Samani et al., 2012; Umer, 2020),
whereas HRV provides relevant information on au-
tonomic regulation to different stimuli (Mccraty and
Shaffer, 2015). The influence of the parasympathetic
nervous system on HR prevails over sympathetic ac-
tivity during resting and moderate effort conditions,
with increased variability in inter-beat intervals (Sam-
mito et al., 2015). A decrease in HRV parameters has
been previously linked to fatigue and work stress, but
it is also observed as a reaction to physical activity, in-
tensity, and duration (Tsai, 2017; Tonello et al., 2014;
Brockmann and Hunt, 2023).
When analyzing the values for cardiovascular load
features in Table 2 and looking at the evolution of
HRV in Figure 3, it seems that the H
3
workstation
tasks place a higher demand on the cardiovascular
BIODEVICES 2024 - 17th International Conference on Biomedical Electronics and Devices
76
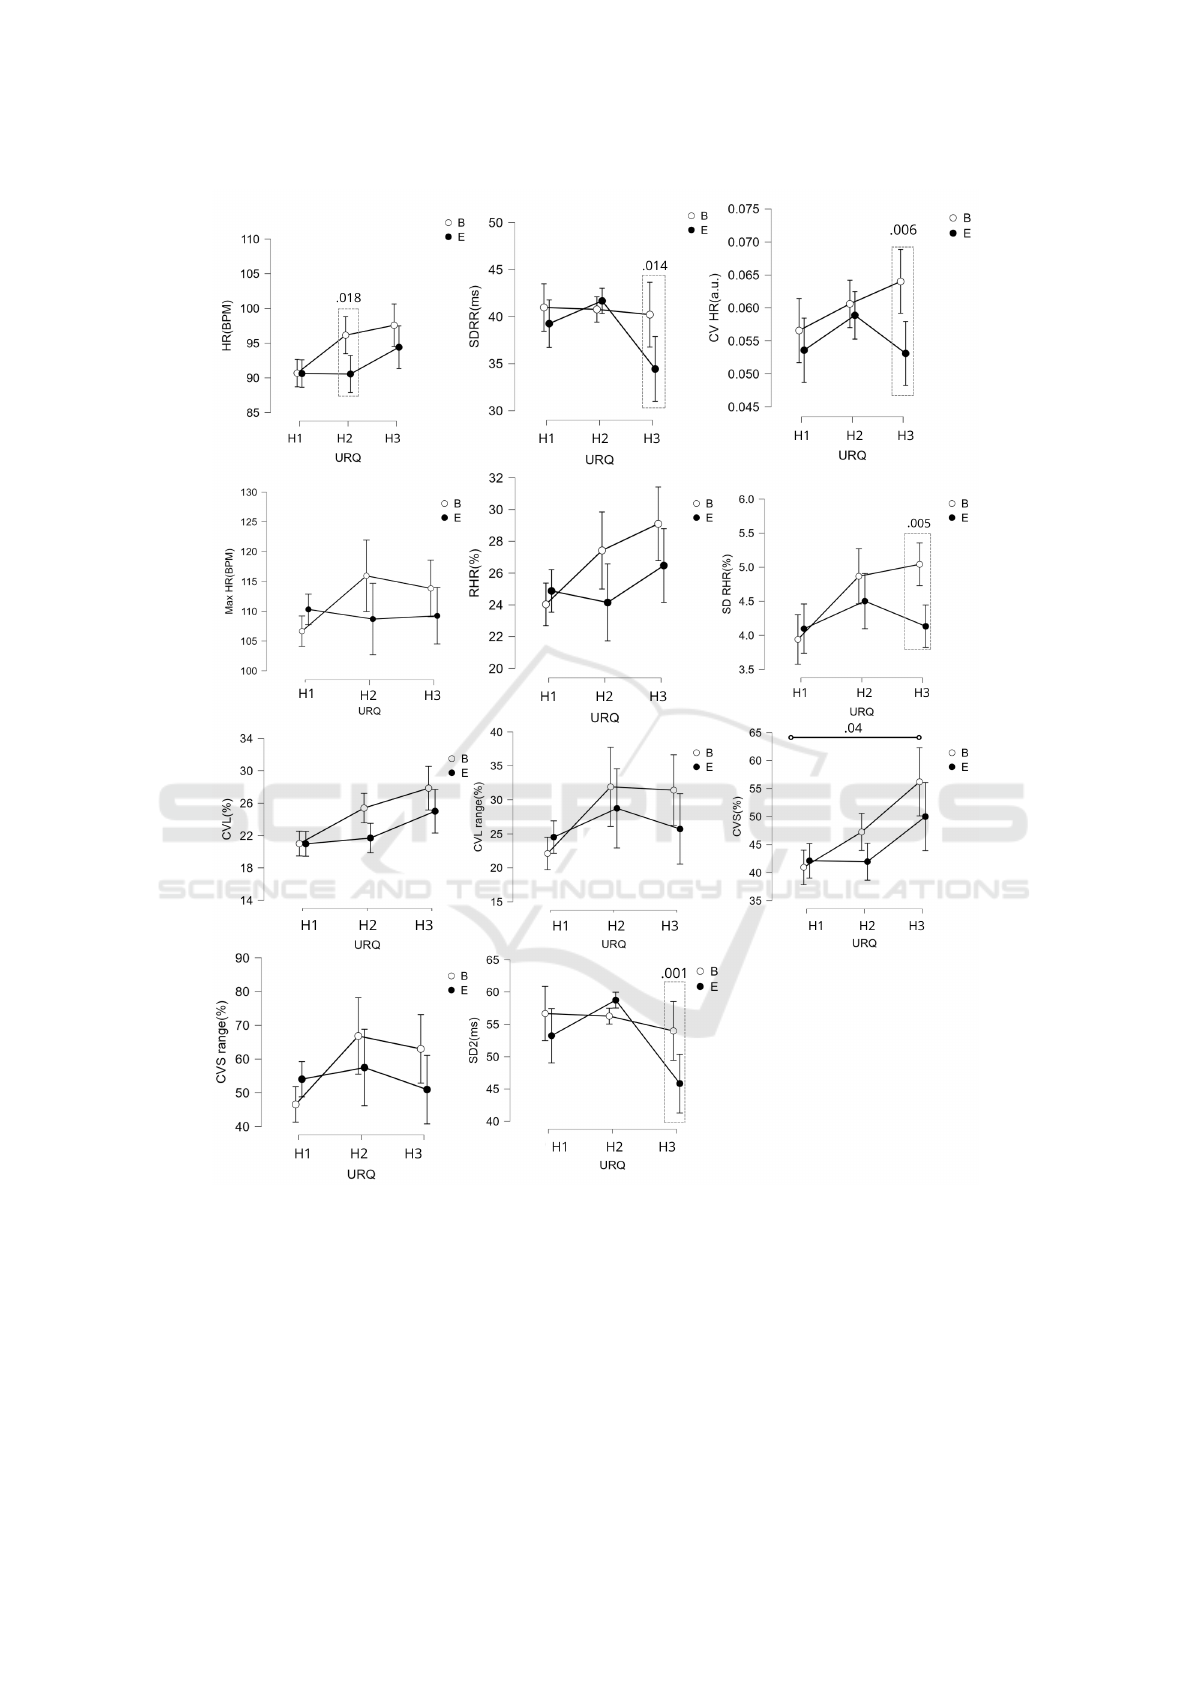
Figure 3: Descriptive plots with Tukey test results for the significant cardiac variables. URQ: Workstation; B: Beginning; E:
Ending. The dashed line box represents a significant result in the within factor. The solid line represents significant differences
in the between factors, with markers on its tips: B-circle; E-solid circle.
system in terms of both load and cardiovascular regu-
lation mechanisms. Indeed in these groups, the repe-
tition of movements is more frequent, something that
has been associated with increased metabolic, cardiac
and perceived stress (Mang et al., 2022), addition-
ally a lot of movements are performed above-head in
the mentioned workstation, that in similar activities
have shown to increase HR and blood pressure (As-
trand et al., 1968). A significant decrease in HRV pa-
rameters has also been found in simulated assembly
line tasks (Carvalho et al., 2023), but here a fatigue-
inducing protocol was applied.
Regarding respiratory adaptations, respiratory fre-
quency is an indicator of physical workload (Nicol
`
o
Cardiorespiratory Adaptations to Work Volume on an Automobile Assembly Line
77
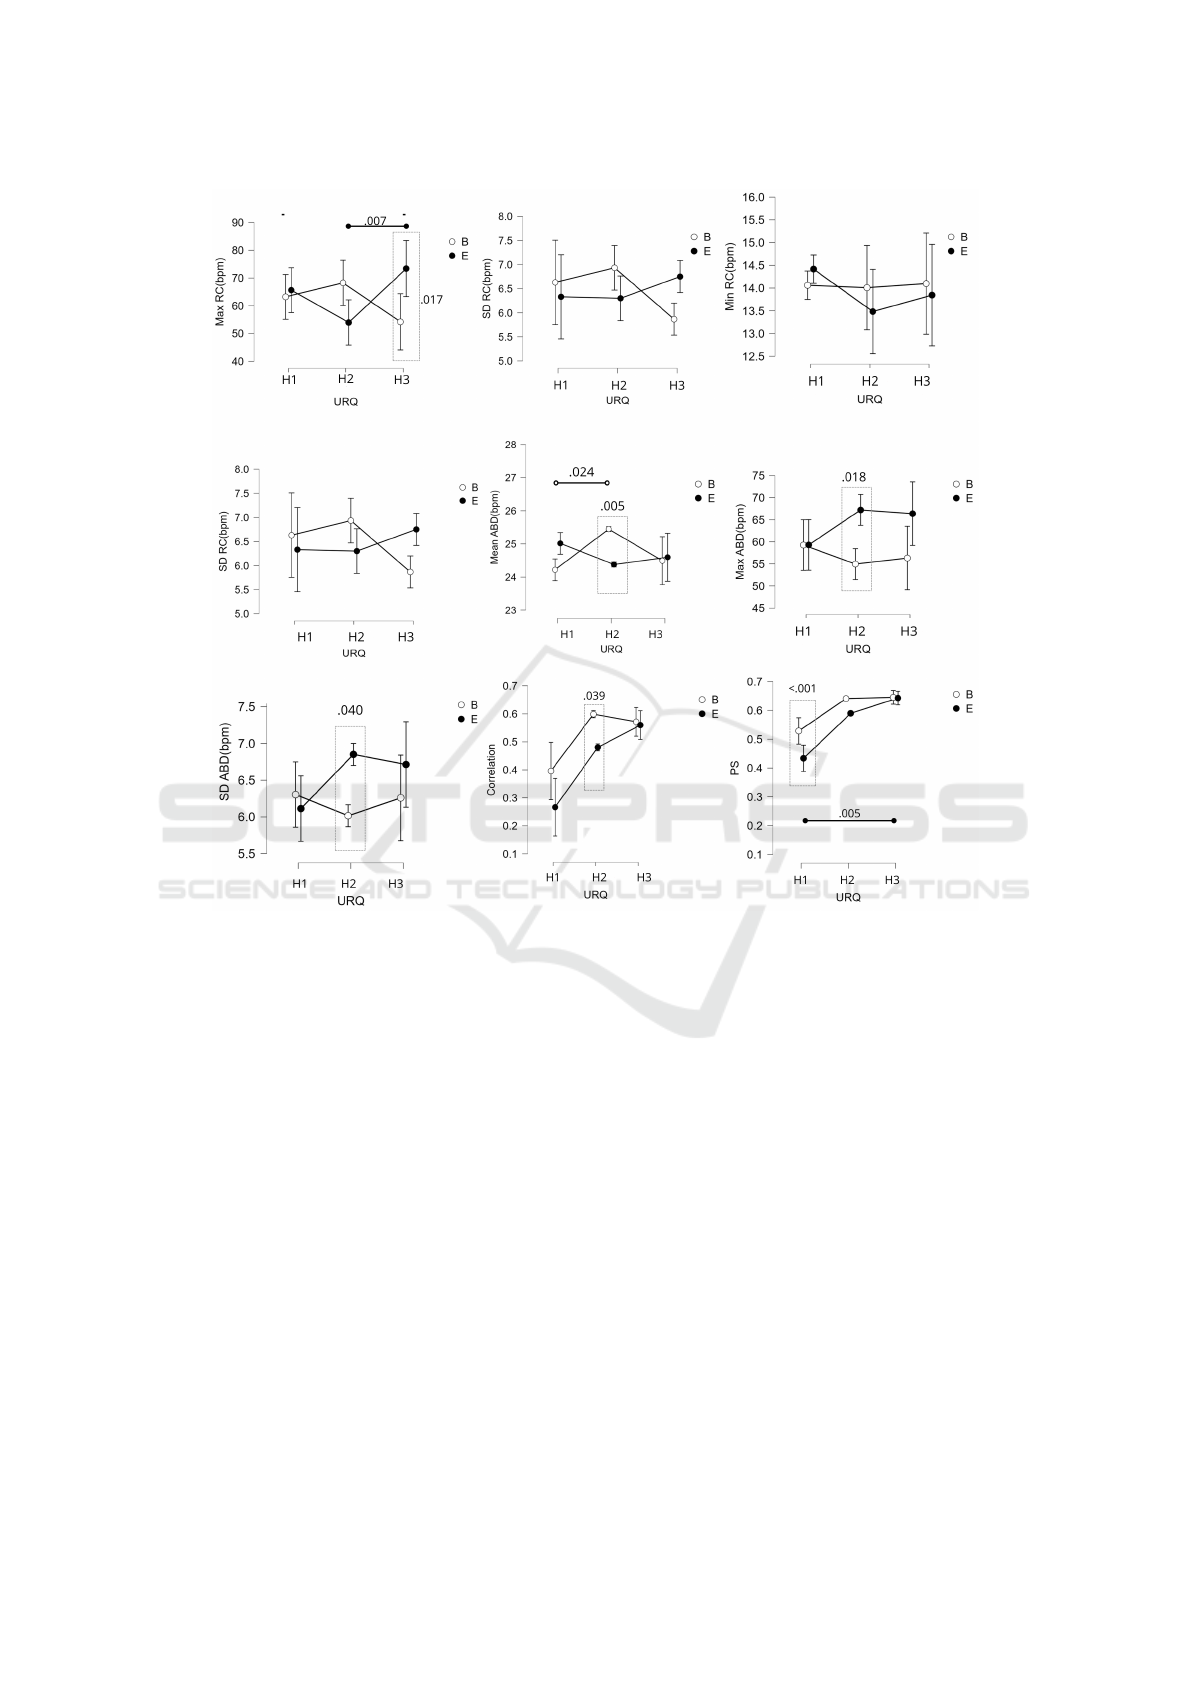
Figure 4: Descriptive plots with Tukey test results for the significant respiratory variables. URQ: Workstation; H1- medium
cycle station; H2- long cycle station; H3- short cycle station; B: Beginning; E: Ending. The dashed line box represents a
significant result in the within factor. The solid line represents significant differences in the between factors, with markers on
its tips: B-circle; E-solid circle.
et al., 2017a). Thoraco-abdominal asynchrony is used
as a measure of respiratory muscle load, defined as
the unmatching movements of the RC and ABD walls,
expressed in phase angle (Hammer and Newth, 2009).
From the observed workstations, the H
2
’s ABD
respiratory variables present the most distinct evolu-
tion from the initial and final 10 minutes, as shown
in Figure 4. This suggests a chaotic movement of the
abdominal muscles, meanwhile, RC parameters did
not change, reflected in the diminished correlation be-
tween their motion as confirmed by 3. The tasks per-
formed on the line involve arm movements, a possi-
ble explanation for these results is the fact that the in-
spiratory thoracic muscles are exerting less force for
breathing, leaving ABD expiration muscles and the
diaphragm to compensate (Celli et al., 1988).
The asynchronous motion between walls through
the data collection period was evident in H
1
and H
2
workstations and is consistent with the results in Silva
et al., where phase and correlation decreased between
baseline and fatigue trials in a simulated repetitive
task (Silva et al., 2022). The H
3
subjects maintained
the relationship between both wall motions through
the analyzed time, which suggests different adaption
mechanisms inherent to this station when compared
to the others.
These parameters are easily monitored with dif-
ferent wearable applications, such as smartwatches,
being that this information could be used to leverage
task rotation, by identifying which tasks are harder
for each employee. This type of approach has already
been used in the construction sector to quantify task
demands (Sadat-Mohammadi et al., 2021). Another
possible application is the monitoring and prevention
of health problems of the operators. For instance, the
identification of a parameter that is above or under
BIODEVICES 2024 - 17th International Conference on Biomedical Electronics and Devices
78

recommended limits, where an alert could be sent to
the worker and supervisor that they need a break. This
has already been applied in Tsai, but in the construc-
tion industry (Tsai, 2017).
6 CONCLUSIONS AND FUTURE
WORK
The cardiorespiratory adaptations to different work
volumes were studied using ECG and RIP signals
monitoring during a period of the shift of multiple op-
erators.
The analysis of the evolution of the chosen cardiac
and respiratory indicators showed contrasts among
tasks with distinct work volumes, where cardiac load
was higher in the H
3
workstation and respiratory dif-
ficulty appeared to be higher in the H
1
and H
2
work-
stations, revealing distinct strategies of adaptation de-
pending on work-volume.
These findings are enthusiastic as they corroborate
the usefulness of the integration of respiratory moni-
toring in assembly-line occupational settings and re-
inforce the importance of measuring operators’ car-
diac activity. The found variables could be further
used in task management and interventions at the
workplace.
The time of acquisition in future research should
be longer to obtain a broader vision of the operators’
response to their daily shift and further understanding
of internal compensation mechanisms. Moreover, an
increase in sample size to amplify the representativ-
ity of the studied factory and effect size of statistical
analysis.
This research underscores the potential and sig-
nificance of cardiorespiratory monitoring in enhanc-
ing both task management and worker well-being on
assembly lines. By doing so, it paves the way for a
more human-centered workplace environment. This
should be considered to identify possible degradation
of worker’s long-term well-being.
ACKNOWLEDGEMENTS
This work was supported by Project OPERATOR
(NORTE01-0247-FEDER-045910), co-financed by
the European Regional Development Fund through
the North Portugal Regional Operational Program
and Lisbon Regional Operational Program and by
the Portuguese Foundation for Science and Technol-
ogy, under the MIT Portugal Program. M. Dias
and P. Probst were supported by the doctoral Grants
SFRH/BD/151375/2021 and RT/BD/152843/2021,
respectively, financed by the Portuguese Foundation
for Science and Technology (FCT), and with funds
from the State Budget, under the MIT Portugal Pro-
gram.
REFERENCES
Andreas, G.-W. J. and Johanssons, E. (2018). Observa-
tional Methods for Assessing Ergonomic Risks for
Work-Related Musculoskeletal Disorders. A Scoping
Review. Revista Ciencias de la Salud, 16:8–38.
Astrand, I., Guharay, A., and Wahren, J. (1968). Circulatory
Responses to Arm Exercise with Different Arm Posi-
tions. Journal of Applied Physiology, 25(5):528–532.
Ayabar, A., De la Riva, J., Sanchez, J., and Balderrama, C.
(2015). Regression model to estimate standard time
through energy consumption of workers in manual as-
sembly lines under moderate workload. Journal of
Industrial Engineering, 2015.
Baraldi, E. C. and Kaminski, P. C. (2011). Ergonomic
planned supply in an automotive assembly line. Hu-
man Factors and Ergonomics in Manufacturing &
Service Industries, 21(1):104–119.
Brockmann, L. and Hunt, K. J. (2023). Heart Rate Variabil-
ity Changes with Respect to Time and Exercise Inten-
sity During Heart-rate-controlled Steady-state Tread-
mill Running. Scientific Reports, 13:8515.
Carvalho, D., Silva, L., Carvalho, M., Dias, M., Costa, N.,
Folgado, D., Nunes, M., Gamboa, H., Andza, K., and
Edelman, E. (2023). Cardiovascular Reactivity (CVR)
During Repetitive Work in the Presence of Fatigue. In
Ahram, T., Karwowski, W., Bucchianico, P. D., Ta-
iar, R., Casarotto, L., and Costa, P., editors, Intelli-
gent Human Systems Integration (IHSI 2023): Inte-
grating People and Intelligent Systems, volume 69.
AHFE Open Access, AHFE International.
CEDEFOP (2023). Employed Population.
Celli, B. R., Criner, G., and Rassulo, J. (1988). Ventilatory
Muscle Recruitment During Unsupported Arm Exer-
cise in Normal Subjects. Journal of Applied Physiol-
ogy, 64(5):1936–1941.
Chawla, N., Bowyer, K., Hall, L., and Kegelmeyer, W.
(2002). SMOTE: Synthetic Minority Over-sampling
Technique. J. Artif. Intell. Res. (JAIR), 16:321–357.
Chen, C.-C. and Tsui, F. R. (2020). Comparing different
wavelet transforms on removing electrocardiogram
baseline wanders and special trends. BMC Medical
Informatics and Decision Making, 20.
Dias, M., Silva, L., Folgado, D., Nunes, M. L., Cepeda, C.,
Cheetham, M., and Gamboa, H. (2023). Cardiovascu-
lar load assessment in the workplace: A systematic re-
view. International Journal of Industrial Ergonomics,
96:103476.
Eurostat (2023). Hours of work - Annual Statistics.
Gastinger, S., Donnelly, A., Dumond, R., and Prioux, J.
(2014). A Review of the Evidence for the Use of Ven-
tilation as a Surrogate Measure of Energy Expendi-
Cardiorespiratory Adaptations to Work Volume on an Automobile Assembly Line
79

ture. JPEN. Journal of parenteral and enteral nutri-
tion, 38.
Geurts, S. A. and Sonnentag, S. (2006). Recovery as
an explanatory mechanism in the relation between
acute stress reactions and chronic health impairment.
Scandinavian journal of work, environment & health,
pages 482–492.
Goggins, R. W., Spielholz, P., and Nothstein, G. L. (2008).
Estimating the effectiveness of ergonomics interven-
tions through case studies: Implications for predic-
tive cost-benefit analysis. Journal of Safety Research,
39(3):339–344.
Hammer, J. and Newth, C. (2009). Assessment of thoraco-
abdominal asynchrony. Paediatric Respiratory Re-
views, 10(2):75 –80.
He, H., Tan, Y., and Wang, Y. (2015). Optimal base wavelet
selection for ECG noise reduction using a comprehen-
sive entropy criterion. Entropy, 17(9):6093–6109.
Hess-nielsen, N. and Wickerhauser, M. (1996). Wavelets
and time-frequency analysis. Proceedings of the
IEEE, 84:523–540.
Holtermann, A., Hansen, J. V., Burr, H., Søgaard, K., and
Sjøgaard, G. (2012). The health paradox of occupa-
tional and leisure-time physical activity. British Jour-
nal of Sports Medicine, 46(4):291–295.
Holtermann, A., Krause, N., van der Beek, A. J., and
Straker, L. (2018). The physical activity paradox:
six reasons why occupational physical activity (OPA)
does not confer the cardiovascular health benefits that
leisure time physical activity does. British Journal of
Sports Medicine, 52(3):149–150.
Kazmierczak, K., Mathiassen, S. E., Forsman, M.,
and Winkel, J. (2005). An integrated analysis
of ergonomics and time consumption in Swedish
‘craft-type’ car disassembly. Applied Ergonomics,
36(3):263–273.
Krause, N., Arah, O. A., and Kauhanen, J. (2017). Physi-
cal activity and 22-year all-cause and coronary heart
disease mortality. American Journal of Industrial
Medicine, 60(11):976–990.
Krause, N., Brand, R. J., Kaplan, G. A., Kauhanen,
J., Malla, S., Tuomainen, T.-P., and Salonen, J. T.
(2007). Occupational physical activity, energy expen-
diture and 11-year progression of carotid atheroscle-
rosis. Scandinavian Journal of Work, Environment &
Health, (6):405–424.
Lester, J., Hannaford, B., and Borriello, G. (2004). “Are
You with Me?” – Using Accelerometers to Determine
If Two Devices Are Carried by the Same Person. vol-
ume 3001, pages 33–50.
Liu, S., Gao, R. X., John, D., Staudenmayer, J., and Freed-
son, P. (2013). Tissue Artifact Removal from Respi-
ratory Signals Based on Empirical Mode Decompo-
sition. Annals of biomedical engineering, 41:1003–
1015.
Lundberg, U., Granqvist, M., Hanssonand, T., Magnusson,
M., and Wallin, L. (1989). Psychological and physi-
ological stress responses during repetitive work at an
assembly line. Work & Stress, 3(2):143–153.
Makowski, D., Pham, T., Lau, Z. J., Brammer, J. C.,
Lespinasse, F., Pham, H., Sch
¨
olzel, C., and Chen, S.
H. A. (2021). NeuroKit2: A python toolbox for neu-
rophysiological signal processing. Behavior Research
Methods, 53(4):1689–1696.
Mang, Z. A., Realzola, R. A., Ducharme, J., Bellissimo,
G. F., Beam, J. R., Mermier, C., de Castro Magalhaes,
F., Kravitz, L., and Amorim, F. T. (2022). The Effect
of Repetition Tempo on Cardiovascular and Metabolic
Stress When Time Under Tension is Matched During
Lower Body Exercise. European Journal of Applied
Physiology, 122(6):1485–1495.
Massaroni, C., Nicol
`
o, A., Lo Presti, D., Sacchetti, M.,
Silvestri, S., and Schena, E. (2019). Contact-Based
Methods for Measuring Respiratory Rate. Sensors,
19(4):908.
Mccraty, R. and Shaffer, F. (2015). Heart Rate Variabil-
ity: New Perspectives on Physiological Mechanisms,
Assessment of Self-regulatory Capacity, and Health
Risk. Global Advances in Health and Medicine,
4(1):46–61. PMID: 25694852.
Nardolillo, A. M., Baghdadi, A., and Cavuoto, L. A. (2017).
Heart Rate Variability During a Simulated Assembly
Task; Influence of Age and Gender. volume 61, pages
1853–1857.
Nicol
`
o, A., Marcora, S. M., Bazzucchi, I., and Sacchetti, M.
(2017a). Differential control of respiratory frequency
and tidal volume during high-intensity interval train-
ing. Experimental physiology, 102(8):934–949.
Nicol
`
o, A., Massaroni, C., and Passfield, L. (2017b). Res-
piratory Frequency During Exercise: The Neglected
Physiological Measure. Frontiers in Physiology,
8:922.
NIOSH (1981). Work Practices Guide for Manual Lifting.
Number 81-122 in DHHS (NIOSH) publication. U.S.
Department of Health and Human Services, Public
Health Service, Centers for Disease Control, National
Institute for Occupational Safety and Health, Division
of Biomedical and Behavioral Science.
Niu, S. (2010). Ergonomics and occupational safety and
health: An ILO perspective. Applied Ergonomics,
41(6):744–753.
Palmerud, G., Forsman, M., Neumann, W. P., and Winkel,
J. (2012). Mechanical exposure implications of ratio-
nalization: A comparison of two flow strategies in a
Swedish manufacturing plant. Applied Ergonomics,
43(6):1110–1121.
Pickering, T. G., Devereux, R. B., James, G. D., Gerin, W.,
Landsbergis, P., Schnall, P. L., and Schwartz, J. E.
(1996). Environmental influences on blood pressure
and the role of job strain. Journal of hypertension.
Supplement : official journal of the International So-
ciety of Hypertension, 14(5):S179–85.
R
´
etory, Y., Niedzialkowski, P., de Picciotto, C., Bonay, M.,
and Petitjean, M. (2016). New Respiratory Inductive
Plethysmography (RIP) Method for Evaluating Ven-
tilatory Adaptation during Mild Physical Activities.
PLoS ONE, 11.
Rodrigues, J., Liu, H., Folgado, D., Belo, D., Schultz,
T., and Gamboa, H. (2022). Feature-Based Informa-
BIODEVICES 2024 - 17th International Conference on Biomedical Electronics and Devices
80

tion Retrieval of Multimodal Biosignals with a Self-
Similarity Matrix: Focus on Automatic Segmentation.
Biosensors, 12(12).
Romero, D., Stahre, J., Wuest, T., Noran, O., Bernus, P.,
Fasth, Fast-Berglund,
˚
A., and Gorecky, D. (2016). To-
wards an Operator 4.0 Typology: A Human-Centric
Perspective on the Fourth Industrial Revolution Tech-
nologies. pages 29–31.
Ryan, L., Rahman, T., Strang, A., Heinle, R., and Shaf-
fer, T. H. (2020). Diagnostic differences in respira-
tory breathing patterns and work of breathing indices
in children with Duchenne muscular dystrophy. PLoS
ONE, 15.
Sadat-Mohammadi, M., Shakerian, S., Liu, Y., Asadi, S.,
and Jebelli, H. (2021). Non-invasive physical demand
assessment using wearable respiration sensor and ran-
dom forest classifier. Journal of Building Engineering,
44:103–279.
Samani, A., Holtermann, A., Søgaard, K., Holtermann,
A., and Madeleine, P. (2012). Following er-
gonomics guidelines decreases physical and cardio-
vascular workload during cleaning tasks. Ergonomics,
55(3):295–307. PMID: 22409167.
Sammito, S., Thielmann, B., Seibt, R., Klussmann, A.,
Weippert, M., and B
¨
ockelmann, I. (2015). Guideline
for the application of heart rate and heart rate vari-
ability in occupational medicine and occupational sci-
ence. ASU Int, 2015(06):1–29.
Santos, A., Rodrigues, J., Folgado, D., Santos, S., Fuj
˜
ao,
C., and Gamboa, H. (2021). Self-Similarity Matrix of
Morphological Features for Motion Data Analysis in
Manufacturing Scenarios. pages 80–90.
Silva, L., Dias, M., Folgado, D., Nunes, M., Namburi, P.,
Anthony, B., Carvalho, D., Carvalho, M., Edelman,
E., and Gamboa, H. (2022). Respiratory Inductance
Plethysmography to Assess Fatigability during Repet-
itive Work. Sensors, 22.
Takala, E.-P., Pehkonen, I., Forsman, M., Hansson, G.-
˚
A., Mathiassen, S. E., Neumann, W. P., Sjøgaard, G.,
Veiersted, K. B., Westgaard, R. H., and Winkel, J.
(2010). Systematic evaluation of observational meth-
ods assessing biomechanical exposures at work. Scan-
dinavian Journal of Work, Environment & Health,
(1):3–24.
Tonello, L., Rodrigues, F., Souza, J., Campbell, C., Leicht,
A., and Boullosa, D. (2014). The role of physical ac-
tivity and heart rate variability for the control of work
related stress. Frontiers in Physiology, 5.
Tsai, M.-K. (2017). Applying Physiological Status Mon-
itoring in Improving Construction Safety Manage-
ment. KSCE Journal of Civil Engineering, 21:2061–
2066.
Umer, W. (2020). Sensors based physical exertion monitor-
ing for construction tasks: Comparison between tra-
ditional physiological and heart rate variability based
metrics. In Proc., Joint CIB WO99 & TG59 Conf.
van der Beek, A. J. and Frings-Dresen, M. H. (1998).
Assessment of mechanical exposure in ergonomic
epidemiology. Occupational and Environmental
Medicine, 55(5):291–299.
Virtanen, P., Gommers, R., Oliphant, T. E., Haberland, M.,
Reddy, T., Cournapeau, D., Burovski, E., Peterson, P.,
Weckesser, W., Bright, J., van der Walt, S. J., Brett,
M., Wilson, J., Millman, K. J., Mayorov, N., Nel-
son, A. R. J., Jones, E., Kern, R., Larson, E., Carey,
C. J., Polat,
˙
I., Feng, Y., Moore, E. W., VanderPlas,
J., Laxalde, D., Perktold, J., Cimrman, R., Henriksen,
I., Quintero, E. A., Harris, C. R., Archibald, A. M.,
Ribeiro, A. H., Pedregosa, F., van Mulbregt, P., and
SciPy 1.0 Contributors (2020). SciPy 1.0: Fundamen-
tal Algorithms for Scientific Computing in Python.
Nature Methods, 17:261–272.
Wilson, D. J. (2019). The harmonic mean p-value for com-
bining dependent tests. Proceedings of the National
Academy of Sciences, 116(4):1195–1200.
Xu, W. and Du, F. (2022). A Robust Qrs Complex Detec-
tion Method Based On Shannon Energy Envelope And
Hilbert Transform. Journal of Mechanics in Medicine
and Biology, 22(03):2240013.
Yeo, I.-K. and Johnson, R. A. (2000). A New Family
of Power Transformations to Improve Normality or
Symmetry. Biometrika, 87(4):954–959.
Cardiorespiratory Adaptations to Work Volume on an Automobile Assembly Line
81
