
Visual Analysis of Military Diving Incident Reports
G. Walsh
a
, N. S. Andersen
b
, J. Kusnick
c
, E. B. Sørensen
d
and S. J
¨
anicke
e
Centre for Visual Data Science, Department of Mathematics and Computer Science,
University of Southern Denmark, Denmark
Keywords:
Geospatial Temporal Visualization, Military Diving, Incident Reporting, Incident Analysis.
Abstract:
Military diving can be characterized by its specialized tasks, advanced equipment, and ever-changing opera-
tional environments, giving rise to remarkably unique operational challenges. Given this complexity, accidents
and incidents can occur. Incident reporting and analysis systems exist to collect data, perform trend analysis
on safety interventions, and modify unsafe behaviors. By examining existing Military Diving Incident Re-
porting (MDIR) systems and literature, we reveal that individual European countries have segregated systems,
but these lack standardization and interoperability. This paper introduces a novel visualization tool, focusing
primarily on rebreather incidents, a critical piece of equipment with a history of incidents in both military and
civilian contexts. We compare our proposed system with existing models, highlighting strengths and areas
for improvement. This tool aims to illustrate the potential of a broader, more comprehensive system, which
would cover not only rebreather incidents but all types of military diving incidents. The paper concludes with
insights into the potential of a comprehensive, standardized MDIR system, proposing future extensions and
research opportunities to enhance military diving safety and operational effectiveness.
1 INTRODUCTION
Despite being generally safe due to well-established
diving procedures and the expertise of trained per-
sonnel, military diving operates in a high-risk and
complex environment, making accidents a possibil-
ity (Breitstein and Nevo, 1999; O’Connor et al.,
2007). The diverse nature of military diving tasks, the
use of advanced equipment, and varying operational
contexts contribute to this risk. Unlike other high-
reliability military sectors like aviation, diving lacks
extensive safety research focused on human error.
The existing literature primarily focuses on equip-
ment design and impacts on cognitive and psychomo-
tor performance, primarily in the context of recre-
ational diving (Breitstein and Nevo, 1999; O’Connor
et al., 2007). To bridge this gap, this paper introduces
a prototype visualization tool for reporting military
diving incidents. This tool is intended to serve as
the basis for a more comprehensive system, enabling
divers to learn from past incidents through detailed
a
https://orcid.org/0000-0002-1095-5471
b
https://orcid.org/0000-0001-6926-1397
c
https://orcid.org/0000-0002-1653-6614
d
https://orcid.org/0009-0001-7915-957X
e
https://orcid.org/0000-0001-9353-5212
visual analysis of historical data.
This approach aligns with the broader goal of inte-
grating incident systems into military operational pro-
cedures, enhancing strategic planning and decision-
making. This is exemplified by the ”As Low As Rea-
sonably Achievable” (ALARA) and ”Report, Ana-
lyze, and Get Better” (RAG) models typically cited
in military manuals (Department of the Navy, 2020;
U.S. Army, 1998). The ALARA model aims to re-
duce safety risks through controls designed to prevent
incidents and catch errors, ensuring no single control
becomes a point of failure. Similarly, the RAG cy-
cle emphasizes continuous collection and analysis of
reports to assess and improve risk control. This fa-
cilitates informed decisions based on observations of
safety incidents and hazards.
Regarding the development of our visualization
tool, Section 2 will delve into the complexities and
challenges of military diving. Understanding these
challenges is crucial for creating effective incident re-
porting systems in the sub-sea domain. Within this
section, we dissect four key aspects of military div-
ing, highlighting the critical information that should
be recorded at the data entry stage of a Military Div-
ing Incident Reporting (MDIR) system. Such infor-
mation is central for later analysis and visual repre-
sentation of insights to end-users. Additionally, we
Walsh, G., Andersen, N., Kusnick, J., Sørensen, E. and Jänicke, S.
Visual Analysis of Military Diving Incident Reports.
DOI: 10.5220/0012577700003660
Paper published under CC license (CC BY-NC-ND 4.0)
In Proceedings of the 19th International Joint Conference on Computer Vision, Imaging and Computer Graphics Theory and Applications (VISIGRAPP 2024) - Volume 1: GRAPP, HUCAPP
and IVAPP, pages 749-758
ISBN: 978-989-758-679-8; ISSN: 2184-4321
Proceedings Copyright © 2024 by SCITEPRESS – Science and Technology Publications, Lda.
749
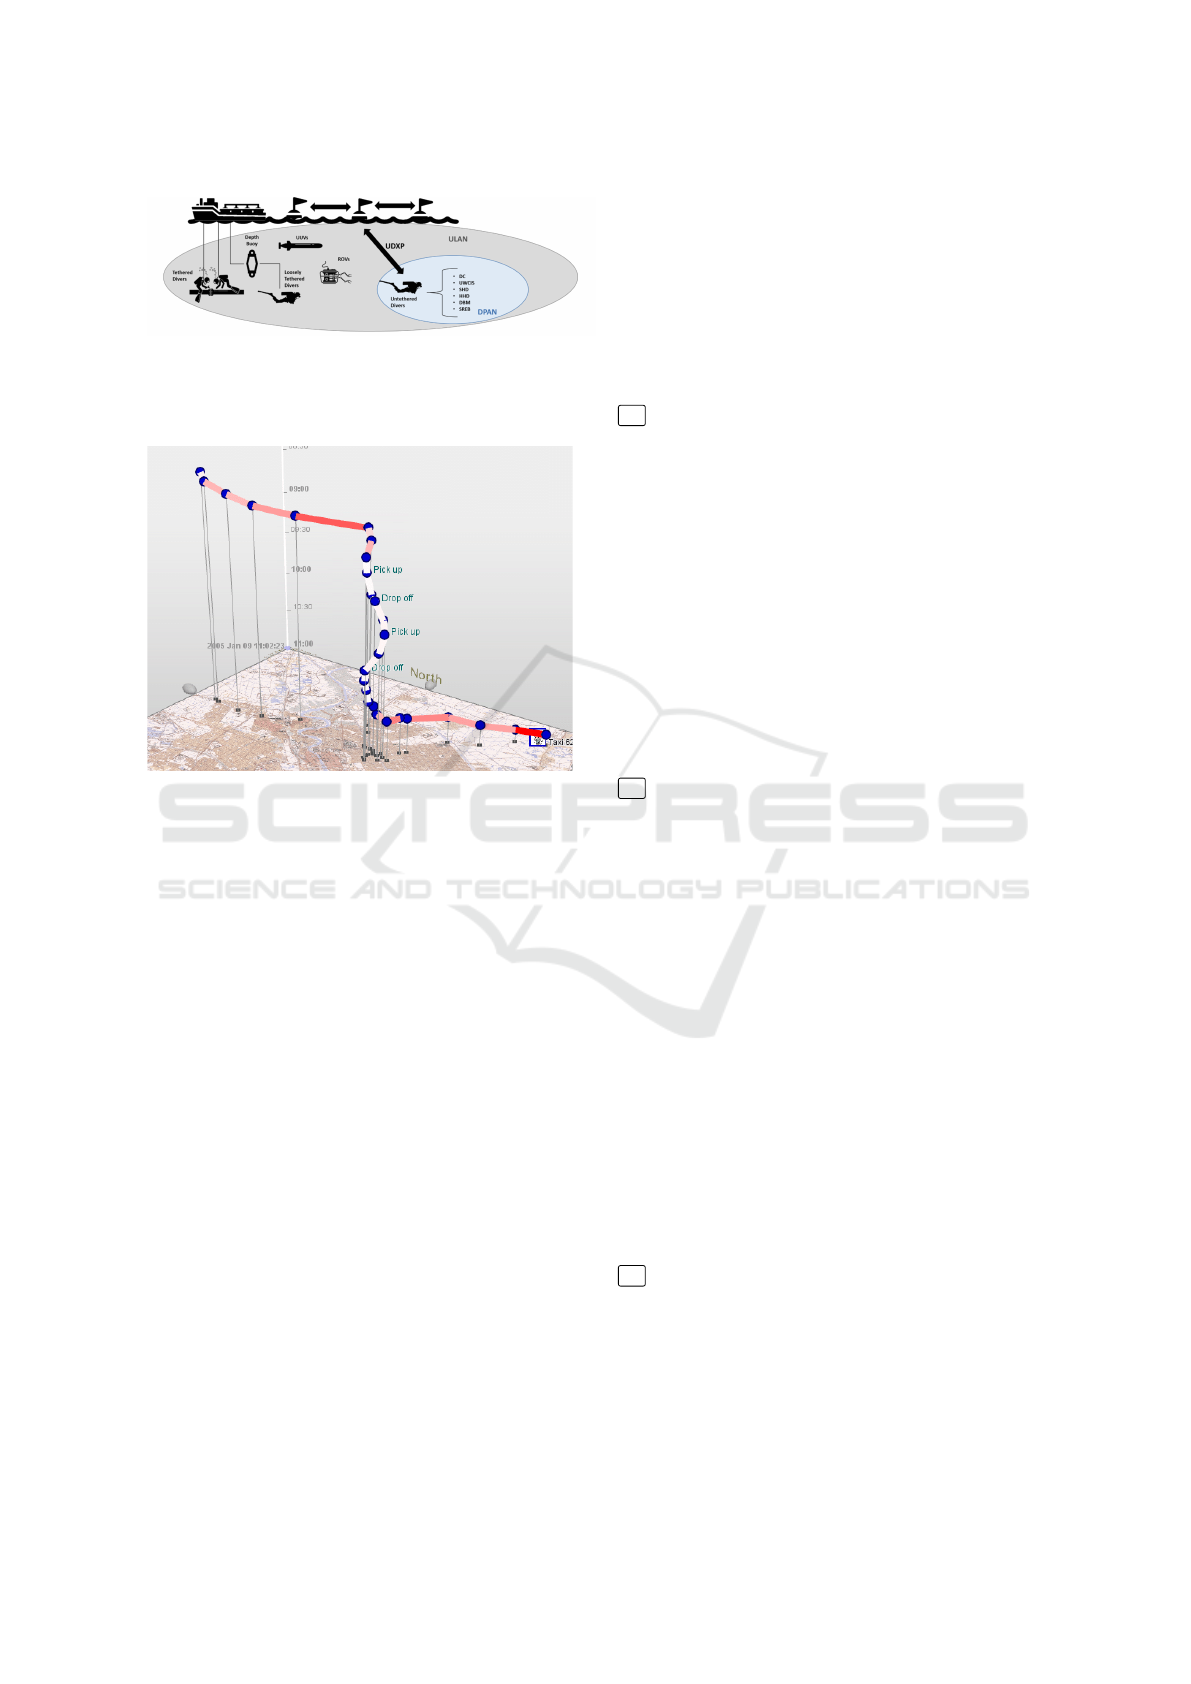
Figure 1: The sub-sea ecosystem of interconnected smart
diving devices and the potential challenges in achieving sit-
uational awareness during execution as well during the as-
sessment of such operations. Source: (CUIIS, 2023).
Figure 2: The usage of GeoTime as a geospatial analysis
software, allowing for the visual analysis of events over
time in 3D. Source: (Kapler and Wright, 2005).
discuss the technical requirements for an MDIR sys-
tem and its accompanying visualization tool, focusing
on aspects such as data integration, visualization ca-
pabilities, and the scalability of such systems.
In exploring the prerequisites for an all-
encompassing MDIR system, we review existing
systems, focusing on their strengths and weaknesses,
particularly those utilized within the EU and NATO.
Examining two state-of-the-art MDIR systems (Sec-
tion 3), we lay the groundwork for introducing our
prototype in Section 4, called the ’Rebreather Fatality
Monitor (RFM)’. While primarily educational, the
RFM represents a notable step towards a more
inclusive system that covers all types of military
diving incidents. Finally, Section 6 and Section 7
conclude on the prototype and present our vision
for a unified and comprehensive MDIR that aims to
surpass the capabilities of current systems.
2 DIVING DATA & MDIR
SYSTEM REQUIREMENTS
Military diving, encompassing a range of complex un-
derwater operations from defensive to offensive activ-
ities (Walsh et al., 2023b; J
´
o
´
zwiak et al., 2016), relies
on divers using breathing equipment independent of
any surface air supply. Given the intricacies of these
operations, MDIR systems must capture various data
types that reflect the unique challenges of military
diving. The following four key aspects highlight the
critical information necessary for input into an MDIR
system for subsequent visualization purposes.
1 Specialized Tasks. Military Diving Operations
(MDOs) involve diverse tasks like maintenance, con-
struction, search and recovery, ordnance disposal, and
tactical activities (US Navy, 2006b). In an MDIR sys-
tem, it is crucial to have detailed ”specialized tasks”
data entries. This granular data enables nuanced anal-
ysis by task, revealing correlations in safety, opera-
tional performance, and protocol adherence (Depart-
ment of the Navy, 2020). Advanced visualization
techniques are imperative in this aspect, aiding in pin-
pointing areas needing safety improvements and op-
timizing resource allocation. Task-based data cate-
gorization in MDIR systems simplifies data filtering
and enhances deviation detection, crucial for in-depth
analysis of each specific task in MDOs (Lock, 2023).
2 Advanced Equipment. In MDOs, increasingly
sophisticated equipment plays a crucial role in the
planning, executing, and assessing sub-sea opera-
tions. Equipment ranging from dive computers to
safety gear like smart hyperbaric chambers for health
monitoring and intervention (Kirwan et al., 1997; Lib-
eratore, 1998; CUIIS, 2023), are integral to oper-
ations. Therefore, a comprehensive MDIR system
must include standardized data entries for this equip-
ment. Such data is important for evaluating the equip-
ment’s impact on diver performance and for corre-
lating different data entries to identify patterns. Ad-
ditionally, during MDOs the sub-sea ecosystem can
consist of a network of interconnected equipment
and smart diving devices, as illustrated in Figure 1.
This illustration not only showcases the complexity of
the ecosystem but also emphasizes the challenges in
achieving interoperability among diverse equipment
types. It further highlights the need for a standardized
method to effectively fuse and present this data.
3 Environmental Conditions. Military divers
operate in challenging sub-sea conditions where en-
vironmental factors like depth, temperature, salinity,
and visibility play critical roles. These environmen-
tal factors can drastically influence diver performance
and equipment functionality (Walsh et al., 2023a).
Additionally, interactions with marine life and nav-
igation around underwater obstructions are signifi-
IVAPP 2024 - 15th International Conference on Information Visualization Theory and Applications
750

Table 1: High-level MDIR system requirements, focusing on data collection, integration, and visualization components in
military diving, emphasizing scalability and continuous improvement for adaptability to evolving needs and practices.
Category Requirements Details
Data Collection Specialized Tasks Type of Task
Advanced Equipment Status and Metrics of Connected Items
Environmental Context Metrics and Notes
Data Integration Efficient Integration Common Dataset
Data Validation Ensure Information Accuracy
Visualization Intuitive UI Geo-Spatial and Temporal Exploration
Visualization tool Features Support Individual Incident Summaries/Export
Training Design Suitable for Training Settings
Scalability Visualization tool Adaptability Accommodate varying volumes of MDIRs
Continuous Improvement Ongoing Evaluation Based on user feedback and evolving needs
cant hazards (Terrill, 2001). As such, potential users
of an MDIR system would be interested in captur-
ing such environmental factors and data for a more
accurate representation of events and risk mitigation
strategy. Such parameters could help support and aid
the refinement of training programs, develop targeted
preventive measures, and design equipment that per-
forms robustly under various conditions.
4 Geospatial & Temporal Aspects. Incorporat-
ing geospatial and temporal data is crucial for so-
phisticated data visualization and analysis in MDIR
systems. The integration of geospatial data such as
latitude, longitude, and depth, along with temporal
data encompassing time and duration of operations,
enhances the understanding of where and when inci-
dents occur. This integration is important in identi-
fying trends and patterns over time, enabling future
operations to be strategically planned with an aware-
ness of historically problematic locations or times. By
providing additional context to incidents, geospatial
and temporal data can significantly improve the un-
derstanding of incident dynamics, particularly in re-
lation to the aspects outlined in 1 – 3 . Further-
more, analyzing the locations and times of past inci-
dents allows for the tailoring of future military diving
operations, addressing specific challenges and scenar-
ios that divers are most likely to encounter. The use
of tools like GeoTime, seen in Figure 2, which offers
a combined temporal and geospatial display, further
demonstrates the potential of such integration in vi-
sualizing and tracking military operations effectively,
and similarly in the sub-sea operational environment
(Kapler and Wright, 2005).
MDIR System Requirements. The inherent chal-
lenges of MDOs and the criticality of capturing data
for visual analysis to reveal incident patterns were
described in 1 – 4 and are further detailed in
our high-level MDIR system requirements (Table 1).
These aspects primarily concern the effective collec-
tion and integration of data. A related requirement is
the seamless integration with standard datasets cou-
pled with robust validation methods to ensure data
accuracy. Also outlined in Table 1 is the need for
advanced visualization capabilities providing a mul-
tifaceted view of the data, enabling a thorough exam-
ination and insightful analysis, which in turn is in-
strumental in revealing incident patterns. In this re-
gard, a user-friendly interface that supports geospatial
and temporal exploration is also vital, offering an in-
tuitive and meaningful entry point for incident inves-
tigation. Furthermore, the MDIR visualization tool
should not only efficiently summarize and export in-
dividual incident reports for data sharing and interop-
erability purposes but also be adaptable for training
purposes. Scalability, too, is a critical factor, ensuring
the system can handle varying volumes of MDIRs ef-
fectively. The last, yet equally important aspect, is the
incorporation of a mechanism for ongoing evaluation
and improvement, anchored in user feedback and the
dynamic needs of military diving operations. Such a
mechanism is imperative to sustain the system’s ef-
fectiveness and relevance. This approach, steered by
requirements, aims to establish a solid foundation for
visual analysis, enhancing safety, operational perfor-
mance, and resource optimization in military diving.
3 EXISTING MDIR SYSTEMS
Due to the restricted nature of current MDIR sys-
tems and related systems, for this paper, we chose
to contextualize our proposed MDIR system against
two tools that set out to solve similar problems: (i)
The Next-Generation Incident System (NICS) and (ii)
Jump Dive Reporting System (DJRS). The study of
these precedents aids our effort to extrapolate relevant
Visual Analysis of Military Diving Incident Reports
751

Figure 3: Next-Generation Incident Command System
(NICS), a web-based geospatially referenced Command
and Control system developed to enhance information shar-
ing, situational awareness, and decision support for the
emergency response community. Source: (Hogan and Fos-
ter, 2022).
features, characteristics, and functionality to be in-
cluded in our MDIR prototype visualization tool and
highlight areas where our prototype can provide addi-
tional functionality.
An examination of military reporting tools reveals
that while such tools exist, they are predominantly
classified due to their sensitive nature. Furthermore,
in the case of the European market, it is evident that
such tools, as with other military products and sys-
tems, are country-specific, lacking interoperability,
and have suffered from years of under-investment and
under-development (Von der Leyen, 2023).
Despite the clear advantages of collaborative de-
velopment, European joint defense research and tech-
nology investment in 2022 constituted only 18 per-
cent of the total spending, a figure substantially lower
than the European Union’s target of 35 percent, as re-
ported by the European Defence Agency (European
Defence Agency, 2023). The increase in collabora-
tive defense research and technological investment is
crucial. It would not only enable member states to
contribute more effectively to the development of ad-
vanced military tools but also reap the benefits from
the enhanced insights and capabilities these tools pro-
vide (Von der Leyen, 2023).
3.1 Next-Generation Incident
Command System
Developed by the MIT Lincoln Laboratory, the Next-
Generation Incident Command System (NICS) is a pi-
oneering web-based system designed to enhance in-
formation sharing and situational awareness among
emergency response teams. It can be seen in Figure 3
(Hogan and Foster, 2022). The advantages of this
system are the geospatially referencing, used for ac-
curate location tracking, and enabling robust person-
nel tracking to accurately record disaster responses
(Tarakanov, 2023; Hogan and Foster, 2022). Simi-
Figure 4: The Dive Jump Reporting System (DJRS), a tool
examining safety in parachute jumps and underwater dives.
Users can access malfunction reports, evaluate new equip-
ment, and explore data. Users can examine reports, log
numbers, dive dates, types, purposes, statuses, and respon-
sible personnel. Source: (Naval Safety Command, 2018).
larly, this tool also allows for near real-time sharing of
diverse data types. These characteristics share some
parallels with what could aid MDIR systems. How-
ever, the NICS has some disadvantages and lacks an
intuitive user interface, the ability to gain a compre-
hensive overview of multiple incidents, and advanced
filtering of such events.
3.2 Dive Jump Reporting System
When looking at military reporting systems, we
briefly looked at many examples, including US CALL
(Center for Army Lessons Learned) (US Army,
2023), and U.S. Air Force Safety Automated Sys-
tem (AFSAS) Preliminary Mishap/Incident Reporting
(US Air Force, 2023) among others. Ultimately, the
Dive Jump Reporting System (DJRS) is a military re-
porting tool used by the U.S. military, focusing on
safety in parachute jumps and underwater dives (US
Navy, 2006a). It resonated most clearly with the goals
of our prototype MDIR visualization tool. We thus
examined it in further detail as a precedent.
As shown in Figure 4, DJRS is similarly lack-
ing in the usage of advanced visualization techniques,
which distill and extrapolate the critical information
and history regarding such operations, which is easy
to consume by the end-user. The tool enables users
to review malfunctions and diving mishaps, exam-
ine new research and development equipment perfor-
mance, and explore incident reports. However, while
this data is available in the portal, it is difficult to find,
cumbersome to go through, and extremely text-heavy.
This is similarly true for the type and implementa-
tion of the DJRS system. Thus, a design considera-
tion and requirement of our MDIR prototype is that
it should utilize data visualization techniques that en-
sure ease of access to historical operational data in an
overview plus details in an on-demand format. Simi-
larly, the design should enable the fundamental anal-
IVAPP 2024 - 15th International Conference on Information Visualization Theory and Applications
752

ysis of incident reports to identify trends more eas-
ily, perform geospatial analysis, perform equipment
evaluation, and spot safety correlations. Furthermore,
the functionality to easily filter displayed results such
as dive types, dates, depth, and so forth would make
the tool much more valuable to the end-user. Another
weakness of this and similar systems is their lack of
ability to be utilized cross-organizationally, reducing
their effectiveness given the bespoke and limited fre-
quency of such operations.
4 PROTOTYPING THE MDIR
VISUALIZATION TOOL
Our proposed prototype focuses on addressing points
and requirements raised in Section 2 by creating an
interactive visualization tool. The prototype focuses
on rebreather data ( 2 ), due to data availability on
rebreather fatalities for both the military and civilian
contexts, using a dataset published and maintained
by Deep Life Group (Deep Life, 2012), listing re-
breather fatalities with corresponding details on the
incidents. This dataset helps demonstrate our proof
of concept but has shortcomings. Those include a rel-
atively unstructured data format, as individual users
originally input data without a strict template. Simi-
larly, geospatial information in the dataset varies sub-
stantially, so locations are approximated based on the
information available.
For the development of our prototype, we se-
lected Dash by Plotly (Plotly, 2023) as our frame-
work, complemented by Plotly for creating interac-
tive visualizations, as illustrated in Figure 5. Our so-
lution is grounded in the Information Seeking Mantra
”Overview first, zoom and filter, then details on de-
mand” (Shneiderman, 1996). This approach gives
users an overview of all rebreather fatalities and al-
lows user interactions to drill down on the designated
patterns of interest. Within our visualization tool, var-
ious highlighting options are available, aligned with
the four key aspects identified in Section 2. This fea-
ture is designed to present incidents in a way that
not only meets the criteria set out in Table 1 but also
addresses the limitations of existing solutions, as de-
tailed in Section 3 and Table 2.
Our visualization tool is organized firstly with an
overview, aiming to provide the user with a good
grasp of where and when incidents occurred using the
Incident Map and the Incident Timeline, accompa-
nied by further Statistic Visualizations. These visu-
alizations are linked by mouse Interactions, allowing
the user to zoom, filter, and demand detailed informa-
tion. The constituent components of the visualization
tool are described in the following:
Incident Map ( 4 ). The first and most signifi-
cant part of the visualization tool (see Figure 5 (A))
is the interactive Incident Map using Mapbox (Map-
box, 2006). Each incident is represented by a geo-
located circular dot colored in a shade of blue based
on the depth of the incident (overview). The color
scale is shown to the left of the map. Whereby a
gray and smaller dot depicts dives of unknown depths.
Dots overlap in the same position, which introduces
a slightly disorganized view for users and could be
avoided in the next iteration by clustering the entries.
Adding additional map layer functionality and a de-
tailed maritime map could also be included.
Incident Timeline ( 4 ). The temporal representa-
tion of the incidents consists of two parts: A blue-
colored area chart pointing downwards to depict the
depth of the dives throughout the years (see Figure 5
(B)). This chart starts at the sea level, represented as
zero on the y-axis, and extends negatively towards
the deepest recorded dive, thus visually mirroring the
descent to the sea floor. A slider to the left of the
chart allows the user to adjust the highlighting selec-
tion based on the depth. Beneath it is the stacked area
chart (see Figure 5 (C)) colored according to expe-
rience levels of divers in different shades of green.
We decided against a combined, single timeline to
highlight the importance of the actual depth, which
is negative, compared to the positive values of inci-
dent numbers. A combined timeline would further-
more be a complex visualization for users to decode
and interpret. Instead, the two area charts are aligned
and linked by interactions to show the correlations be-
tween the different data dimensions. Similarly, the
period in which the dive took place is selectable us-
ing the Incident Timeline, differentiated by experi-
ence level (see Figure 5 (C), highlighting the number
of incidents that occur within a particular time range.
Further Statistics ( 1 , 3 ). To allow for a concise
overview of basic descriptive statistics, two stacked
bar charts are introduced to get an overview of the dis-
tribution of age and dive type (Figure 5 (D)). The col-
ors are kept in line with the Incident Timeline and re-
flect the divers’ experience level. For that purpose, the
filled area plot combined with the depth range slider
(Figure 5 (B)) helps to highlight rebreather fatalities
based on depth.
Interactions. The visualization tool consisting of var-
ious juxtaposed but interlinked visualizations is based
on the idea of multiple-linked views (Wang Baldon-
ado et al., 2000), especially the combination of tem-
poral and geospatial visualizations (Incident Map and
Timeline) (Andrienko and Andrienko, 2006). All vi-
sualizations display the same (sub)set of data points,
Visual Analysis of Military Diving Incident Reports
753
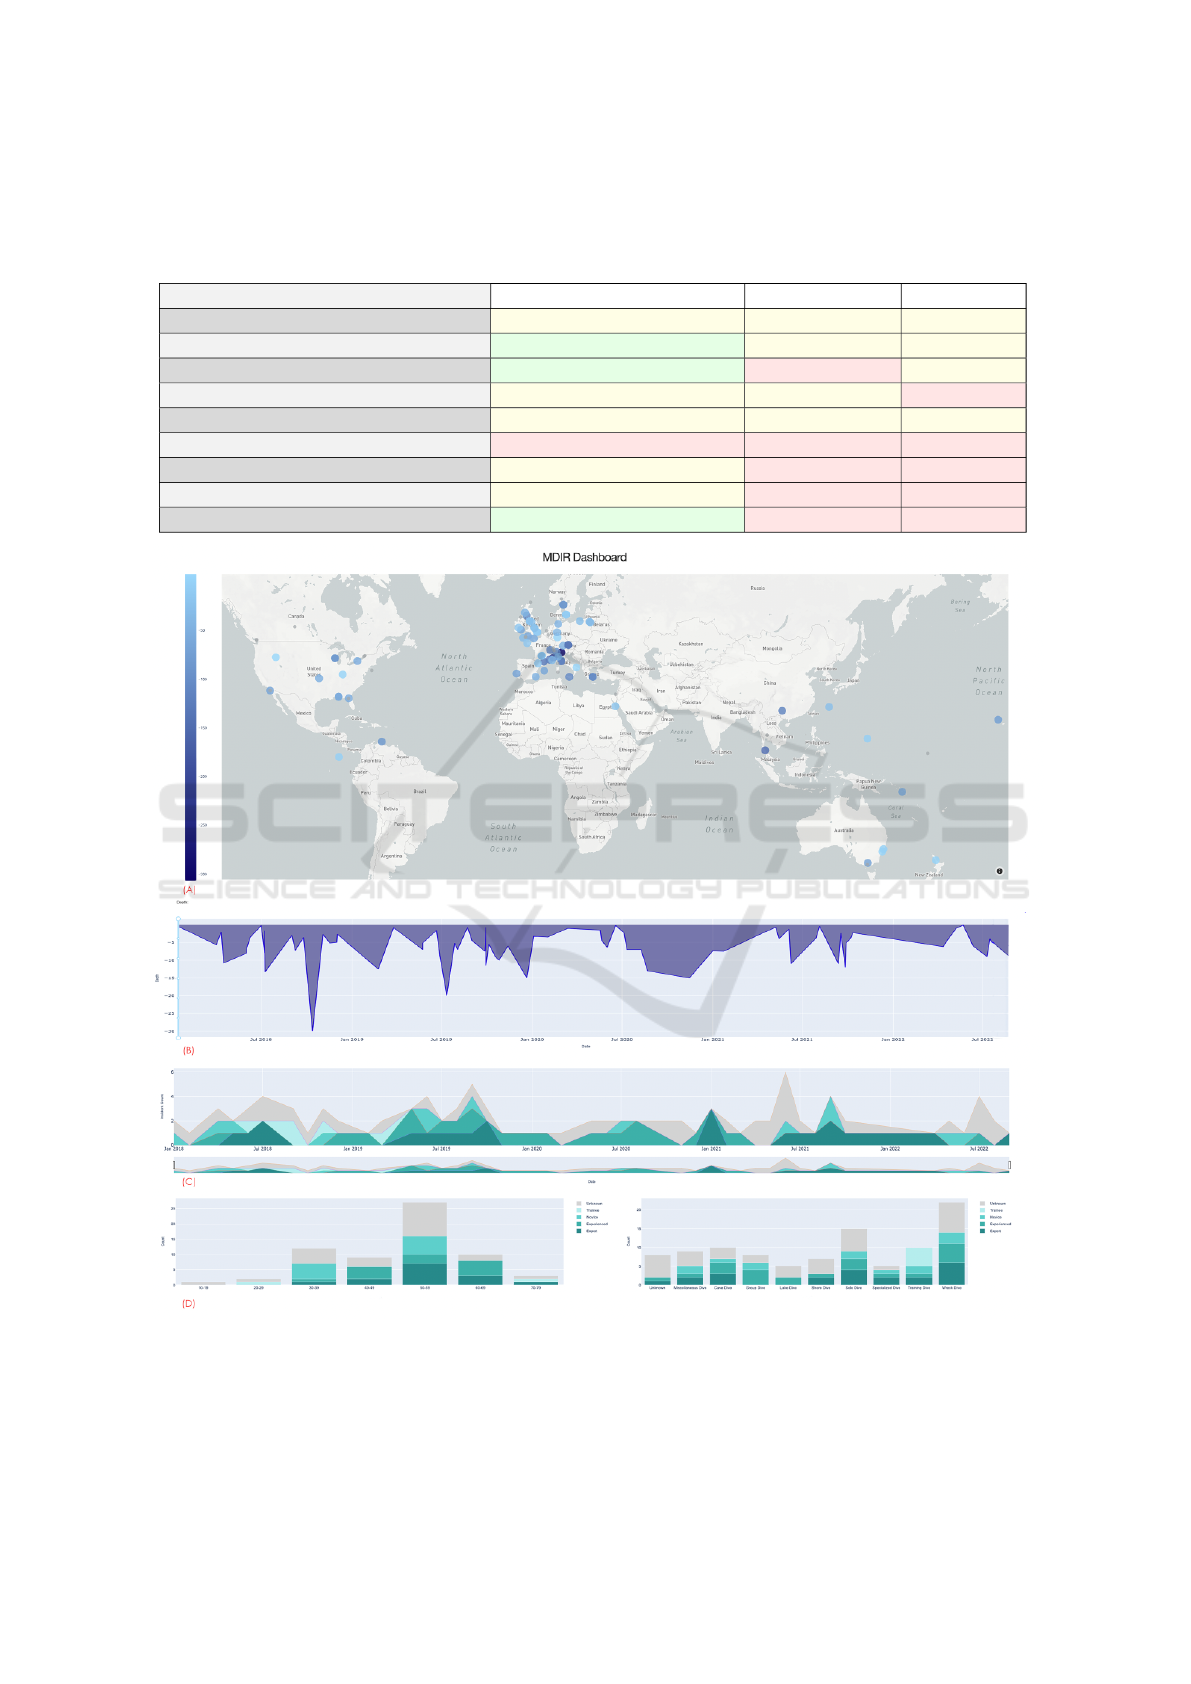
Table 2: Comparative Evaluation of MDIR System versus NICS and JDRS based MDIR system requirements, as well as
additional criteria. The evaluation demonstrates how the proposed MDIR performs concerning the stated requirements. The
evaluation reveals opportunities for further improvement in terms of data collection and integration, data accuracy, scalability,
and real-time data incorporation.
Criteria Proposed MDIR System NICS JDRS
Data Collection and Integration Moderate Moderate Moderate
Data Visualization Excellent Moderate Moderate
User Interface and Experience User-Friendly Non-Intuitive Moderate
Scalability and Adaptability Moderate Moderate Limited
Data Accuracy and Validation Moderate Moderate Moderate
Real-Time Data N/A N/A N/A
Task-Specific Analysis Moderate Basic Basic
Environmental Context Integration Moderate Basic Basic
Training and Improvement Focus Strong Weak Weak
Figure 5: MDIR visualization tool screenshot illustrating the interactive incident map (A), which displays the distribution
of diving incidents by depth geospatially, incident depth filter (B), incident timeline (C), and statistical visualizations (D).
(C) uses a filterable stacked area chart to communicate to the user the distribution of incidents over time, broken down by
experience level. Accompanying stacked bar charts (D) breaks down incidents by diver expertise, age group, and the type and
timing of dives, providing a multifaceted view of diving trends and safety metrics at a macro level.
IVAPP 2024 - 15th International Conference on Information Visualization Theory and Applications
754

and the highlighting interactions are applied to all
of them. So, when initializing the tool, the whole
dataset is visualized, and the various data dimensions
offer opportunities to filter down the selection of high-
lighted data entries. We implement a Focus+context
method (Card et al., 1999) to highlight specific inci-
dents the user might be interested in while keeping the
valuable information of the context around by high-
lighting the selected ones and graying out the others.
The map allows narrowing down the dataset through
geospatial selection of interesting areas by zooming
into the map. In parallel, the timelines highlight the
inspected period in time, the depth, or the level of ex-
pertise of divers with accidents.
For example, suppose an age bracket or dive group
type is selected in the stacked bar charts. In that case,
the prototype highlights the corresponding data points
by displaying them in yellow on the incident time-
line and statistical visualizations and displays the un-
selected incidents on the map as gray. By doing this
and displaying all the incidents on the incident map,
the geospatial context is maintained while highlight-
ing the important features.
In addition to the Incident Map, the Incident Time-
line, and Statistic Visualizations, our MDIR prototype
enables the user to view detailed and comprehensive
information regarding a specific incident.
When an incident is selected, a pop-up window
displays the complete information, including name,
age, rebreather type, country, coordinates, depth,
summary, training implications, design implications,
and sources. E.g., an incident that occurred in Por-
tugal as part of a training dive with an expert-level
scuba diver appears to be a Belgium Military Diver
taking part in a NATO exercise. Furthermore, a user
can understand where the incident occurred (geo-
located), at what depth, and the specific rebreather in-
volved in the fatality (in this case, a Semi-Closed Re-
breather). Additionally, the complete summary infor-
mation for each incident is available. In the example,
Belgian divers tended to remove the SCR PPO
2
mon-
itor from their equipment because they caused many
false alarms, resulting in a fatality in this incident.
5 DISCUSSION
Prototype Limitations. As this paper primarily fo-
cuses on the rebreather aspect of military diving, we
acknowledge that this represents only a fraction of
the diverse scenarios and equipment utilized in mil-
itary diving operations. The complexity of military
diving extends far beyond rebreathers, encompassing
a wide range of equipment, environments, and oper-
ational contexts as described in Section 2. Each of
these elements brings its own set of challenges and
risks. Recognizing this limitation, our prototype does
not support a wide range of equipment, environments,
and operational contexts in this iteration.
Another limitation of this prototype is the dataset
used. The dataset from (Deep Life Group, 2020), used
as a proof of concept, is lacking in accuracy in terms
of data formatting and precise geospatial and some-
times temporal data entries. This has resulted in an
approximation of some location markers in the proto-
type. Similarly, the dataset contains a lot of unknown
or blank entries, particularly relating to training and
design implications. This, in turn, has a negative ef-
fect on the use of this tool for training and design pur-
poses. However, this point highlights a gap and need
for a more robust method of reporting and collect-
ing information about rebreather fatalities and mili-
tary diving incidents more broadly.
Prototype Insights. The intuitive highlighting in-
teractions included in the prototype, as discussed in
Section 4, make it possible to perform an exploratory
search of incidents geospatially according to several
criteria mentioned in Section 4. This aspect is novel to
this visualization tool, as seen in Table 2 where other
tools do not implement such features.
6 CHALLENGES &
OPPORTUNITIES
Challenges. The development of the proposed
MDIR system has presented different challenges.
Specifically in the context of military diving, the secu-
rity of divers and mission-related data are under strict
scrutiny regarding who receives access to operational
and dive data and for what purposes. Development
of the proposed MDIR system would require support
from interested parties and their buy-in regarding the
sharing of operational information with other defense
forces. This would be a significant challenge to over-
come. However, it is not without its many semiotic
benefits. For instance, without mutual information
sharing across different forces, the volume of data
collected from national diving operations might be
too limited to discern patterns or analyze trends effec-
tively. This data is vital for enhancing diver training
and preparation. Overcoming these challenges is fea-
sible through responsible and balanced data-sharing
practices. A transparent and secure approach to data
exchange in any future MDIR system is essential, not
only for the system’s functionality but also for main-
taining the trust and safety of all involved parties.
Visual Analysis of Military Diving Incident Reports
755

Opportunities. The prototype revealed significant
improvements that can be made to improve the status
quo of European and NATO MDIR systems. A stan-
dard method of recording data in such MDOs would
need to be implemented to establish a common MDIR
system. The ultimate aim of a common MDIR system
is to overcome national boundaries and operational si-
los and instead offer increased sharing of information
and insights among military entities, particularly re-
lating to historical data of incidents. This could be
seen in a similar light to what currently exists in the
aviation sector with (European Union Aviation Safety
Agency, 2024). As mentioned in Section 5, there are
criteria as seen in Table 2 still to be fully realized in a
comprehensive MDIR system. As such, there is am-
ple opportunity to further increase the knowledge and
insight generation of the tool according to the sys-
tem requirements. This could cover a more exten-
sive evaluation of equipment performance, a deeper
understanding of environmental risks and conditions,
and how this correlates to the type of dive operation
through the MDIR tool.
6.1 Extending the Prototype
A future extension or iteration of a European MDIR
system could incorporate Navigation Systems, Com-
munication Systems, Thermal Protection, Thermal
Imaging, Sonar Systems, Heads-Up Displays, Under-
water Drones and ROVs, Diver Propulsion Vehicles,
Hyperbaric Chambers, and Biometric Systems to ad-
dress unrealized opportunities. For example, if real-
time data were available, an enhanced MDIR system
could build on the prototype by including advanced
analytics to predict potential mishaps based on histor-
ical data and current conditions. A further possibil-
ity of extension could lie in collaborating with equip-
ment manufacturers to integrate equipment-specific
data streams to identify equipment malfunctions or
potential design flaws better. A thoroughly devel-
oped extension could cover the range of diving equip-
ment and scenarios we could not address in our pro-
totype, providing a more representative view of and
insights into military diving. However, such an exten-
sion would still require a comprehensive and accurate
data collection similar to that mentioned in Table 2,
such that advanced data analysis techniques can be
implemented to increase analysis capabilities.
For example, in an extended MDIR system, a mili-
tary diver may want to deduce whether their dive pro-
file for their ascent or descent was appropriate. The
concept with this broader MDIR proposal is that they
could examine this using these data points in conjunc-
tion with safety system bio-metrics such as O
2
, CO
2
,
and heart rate to establish if it was safe and optimal.
6.2 Further Research Opportunities
The establishment of a common European MDIR sys-
tem opens the door to numerous research areas and
opportunities, including two novel opportunities:
Collaborative Research. The system can serve as
a platform for collaborative research projects
among NATO and European nations, pooling re-
sources and expertise to encourage and promote
enhanced innovation.
Predictive Modeling. Utilizing advanced analytics,
a future iteration of the MDIR system could
be used to develop predictive models for diving
mishaps, offering proactive solutions (with real-
time information integration).
The future potential of such a comprehensive and
common MDIR system is vast. It not only promises
enhanced safety and understanding of diving inci-
dents but also fosters a culture of collaboration, inno-
vation, and continuous improvement to better support
the challenges faced by divers in action.
7 CONCLUSION
This paper highlights the urgent need for a unified
MDIR system in Europe. Limited by national bound-
aries, current systems restrict collective learning from
incidents and near misses, impacting training, safety,
and risk assessment.
The development of a comprehensive European
MDIR system, as conceptualized through the proto-
type in Section 4, holds significant promise for the
future of military diving safety and analysis. Beyond
data visualization, this paper lays the groundwork for
a platform that integrates data collection, analysis,
and visualization, identifying key areas for improve-
ment such as scalability and data accuracy (Table 2).
The developed visualization tool allows for the
global, geospatial, and temporal exploration of re-
breather fatalities in both civilian and military con-
texts. It facilitates incident analysis by highlighting
key factors like type, location, depth, and year and
uses graphs to easily identify trends in fatalities.
A comprehensive European MDIR system, as en-
visioned in this paper, aspires to be more than just
a tool for visualization and analysis; it aims to rede-
fine and elevate the standards for a unified European
approach to military diving safety. While currently
focused on the rebreather aspect, the tool in this pa-
per lays the groundwork for a more expansive sys-
tem that can integrate various facets of military div-
ing, ranging from Navigation Systems to Biometric
IVAPP 2024 - 15th International Conference on Information Visualization Theory and Applications
756

Systems. Such a system hopes to promote and foster
joint research endeavors among NATO and European
nations, leveraging collective expertise to drive inno-
vation in various relevant research domains.
ACKNOWLEDGEMENTS
The survey paper includes some images under the fair
use copyright principle for commentary and discus-
sion purposes (image courtesy of (Hogan and Fos-
ter, 2022; Naval Safety Command, 2018). The Eu-
ropean Defence Industrial Development Programme
has supported this research under the project CUIIS
1
(Grant Agreement EDIDP-UCCRS-EDD-2020-059
— CUIIS). The authors independently produced this
work, which does not reflect the European Commis-
sion’s views, nor is the Commission responsible for
any use of the paper’s information.
REFERENCES
Andrienko, N. and Andrienko, G. (2006). A Framework for
Using Coordinated Displays for the Analysis of Mul-
tidimensional, Spatial, and Temporal Data. In Geo-
graphic Hypermedia, pages 293–308. Springer.
Breitstein, S. and Nevo, B. (1999). Psychological and be-
havioral aspects of diving. Best Publishing Co.
Card, S. K., Mackinlay, J., and Shneiderman, B. (1999).
Readings in information visualization: using vision to
think. Morgan Kaufmann.
CUIIS (2023). Comprehensive underwater intervention in-
formation system. URL: https://cuiis.eu/scope. Vis-
ited: 2023-09-09.
Deep Life (2012). Example iec 61508 safety case: Learning
from accident data. URL: https://deeplife.co.uk/or a
ccident.php. Visited: 2023-09-09.
Deep Life Group (2020). Iec 61508 safety case: Learning
from accident data. URL: https://www.opensafetygl
obal.com/or accident.php. Visited: 2023-09-09.
Department of the Navy (2020). Navy Safety and Occupa-
tional Health Manual. URL: https://secnav.navy.mil/
doni/SECNAV%20Manuals1/5100.23%20CH-2.pdf.
Visited: 2024-01-15.
European Defence Agency (2023). Defence data 2022: Key
findings and analysis. URL: https://eda.europa.eu/do
cs/default-source/brochures/2022-eda defencedata w
eb.pdf. Visited: 2023-09-09.
European Union Aviation Safety Agency (2024). Easa —
european aviation safety agency. URL: https://www.
easa.europa.eu/en. Visited: 2024-01-15.
Hogan, G. and Foster, S. (2022). The next-generation inci-
dent command system (nics). In Enhancing Capabil-
1
Dissemination website available at: https://cuiis.eu/
ities for Crisis Management and Disaster Response,
pages 23–32. Springer.
J
´
o
´
zwiak, D., Siermontowski, P., Da¸browieckiI, Z., and Ol-
sza
´
nski, R. (2016). Analysis of the risk of diving ac-
cidents in military and recreational diving. Polish Hy-
perbaric Research, 53(4):–.
Kapler, T. and Wright, W. (2005). Geotime information vi-
sualization. Information visualization, 4(2):136–146.
Kirwan, B., Basra, G., and Taylor-Adams, S. (1997). Core-
data: a computerised human error database for hu-
man reliability support. In Proceedings of the 1997
IEEE Sixth Conference on Human Factors and Power
Plants, 1997. ’Global Perspectives of Human Factors
in Power Generation’, pages 9/7–912.
Liberatore, T. C. (1998). Risk analysis and management of
diving operations: Assessing human factors. PhD the-
sis, Monterey California. Naval Postgraduate School.
Lock, G. (2023). Learning review for diving.
Mapbox (2006). Maps, navigation, search, and data. URL:
https://www.mapbox.com/.
Naval Safety Command (2018). Risk management infor-
mation - dive and jump reporting system (rmi-djrs).
URL: https://navalsafetycommand.navy.mil/Portals/
29/Documents/RMI-DJRS%20Smart%20Sheet.pdf.
Visited: 2023-08-23.
O’Connor, P., O’Dea, A., and Melton, J. (2007). A method-
ology for identifying human error in u.s. navy diving
accidents. Human Factors, 49(2):214–226.
Plotly (2023). Plotly: The front end for ml and data science
models. URL: https://plotly.com/dash/. Visited:
2023-09-09.
Shneiderman, B. (1996). The eyes have it: a task by data
type taxonomy for information visualizations. In Pro-
ceedings 1996 IEEE Symposium on Visual Languages,
pages 336–343.
Tarakanov, A. (2023). Official maintainer of next-
generation incident command system (nics). URL:
https://www.kontur.io/portfolio/nics/. Visited: 2024-
01-15.
Terrill, C. (2001). Romancing the bomb: Marine animals in
naval strategic defense. Organization & Environment,
14(1):105–113.
US Air Force (2023). Air force safety automated system
(afsas) preliminary mishap/incident reporting. URL:
https://afsas.safety.af.mil/. Visited: 2023-09-09.
U.S. Army (1998). Risk management [field manual fm 100-
14]. URL: https://apps.dtic.mil/sti/pdfs/ADA402771
.pdf. Visited: 2023-08-23.
US Army (2023). Center for army lessens learned - driving
army change. URL: https://www.army.mil/CALL.
Visited: 2023-09-09.
US Navy (2006a). Joint deficiency reporting system. URL:
https://www.jdrs.mil/. Visited: 2024-01-15.
US Navy (2006b). Us navy diving manual, 6th revision.
URL: www.navsea.navy.mil/Portals/103/Document
s/SUPSALV/Diving/Dive%20Manual%20Rev%206
%20with%20Chg%20A.pdf. Visited: 2023-08-23.
Von der Leyen, U. (2023). President von der leyen makes
call for powering up european defence. Visited: 2024-
01-15.
Visual Analysis of Military Diving Incident Reports
757

Walsh, G., Andersen, N. S., J
¨
anicke, S., and Stoianov, N.
(2023a). The lack of specialized symbology and vi-
sual interaction design guidance for sub-sea military
operations. In VisGap - The Gap between Visualiza-
tion Research and Visualization Software, pages 19–
26. The Eurographics Association.
Walsh, G., Andersen, N. S., Stoianov, N., and J
¨
anicke,
S. (2023b). A survey of geospatial-temporal visual-
izations for military operations. In Hurter, C., Pur-
chase, H., and Bouatouch, K., editors, Proceedings
of the 18th International Joint Conference on Com-
puter Vision, Imaging and Computer Graphics Theory
and Applications - IVAPP, volume 3, pages 115–129.
SCITEPRESS Digital Library.
Wang Baldonado, M. Q., Woodruff, A., and Kuchinsky, A.
(2000). Guidelines for Using Multiple Views in Infor-
mation Visualization. In Proceedings of the Working
Conference on Advanced Visual Interfaces, AVI ’00,
page 110–119, New York, NY, USA. Association for
Computing Machinery.
IVAPP 2024 - 15th International Conference on Information Visualization Theory and Applications
758
