
Really Can’t Hold On Anymore? Physiological Indicators Versus
Self-Reported Motivation Drop During Jogging
Shiyao Zhang
1 a
, Sergei Kolensnikov
2
, Till Rennspieß
2
, Robert Porzel
2 b
, Tanja Schultz
1 c
and Hui Liu
1 d
1
Cognitive System Lab, University of Bremen, Bibliothekstraße 1, Bremen, Germany
2
Digital Media Lab, University of Bremen, Bibliothekstraße 1, Bremen, Germany
Keywords:
Motivation, Self-Determination, SDT, Biosignals, ECG, sEMG, Respiration Rate, LSTM, HRV Analysis,
Causal Relationship.
Abstract:
Motivational dynamics in jogging constitute a pivotal factor influencing a runner’s performance, persistence,
and overall engagement in the running activity. The manifestation of diminished motivation is concomi-
tant with a cascade of physiological responses, capable of being represented through biological signals, for
which biosignal monitoring, a common practice in evaluating athletic performance, emerges as a valuable tool.
Should biosignals, as dynamic indicators during exercise, exhibit discernible shifts correlating with changes
in motivation, the prospect of actively modulating motivation levels and intervening in athletes’ performance
during exercise becomes feasible. This study consists of collecting comprehensive biological data, including
electrocardiogram (ECG), surface electromyogram (sEMG), and respiration signals (RSP), from runners who
participated in a 20-minute running session. Participants were asked to self-report a decrease in motivation
during jogging. Using heart rate variability analysis, self-similarity matrix and deep learning methodolo-
gies, this work seeks to explore whether the discomforts reported and triggered by decreased motivation had
discernible effects on monitored physiological signals, thus advancing our understanding of the nuanced rela-
tionship between physiological responses and motivational states in running.
1 INTRODUCTION
Etymologically, the word motivation is derived from
the Latin word movere, which denotes the driving
force behind an individual’s actions (Ryan et al.,
2010).
Given the pivotal role of motivation as a behav-
ioral driver, researchers have aimed to comprehend
how motivational processes manifest in people’s par-
ticipation and performance in sports, consequently
seeking avenues for intervention in sports perfor-
mance. Motivation has been proposed and confirmed
to contribute significantly to student achievement in
physical education (PE) and participation in sports
(Melliti et al., 2016). As dropout from sport is often
attributed to a lack of motivation and self-regulation
skills, it is essential to understand the underlying mo-
tivational processes (Weiss and Williams, 2004).
As examples, incorporating kinetic music in the
a
https://orcid.org/0000-0001-5965-0428
b
https://orcid.org/0000-0002-7686-2921
c
https://orcid.org/0000-0002-9809-7028
d
https://orcid.org/0000-0002-6850-9570
gym and providing continuous verbal encouragement
from the coach to the endurance athlete during exer-
cise are effective strategies for influencing individu-
als to engage in and sustain physical activity. These
methods enhance motivation levels, particularly in the
context of endurance sports, where they are frequently
employed. Endurance sports are characterized by re-
peated isotonic contractions of large skeletal muscle
groups. Classical examples include running, swim-
ming, and cycling among summer sports, and cross-
country skiing or speed skating among winter sports
(Morici et al., 2016). Motivation, as a driving force, is
highly manipulative of the athlete, performance, and
outcome of the competition during endurance sports.
Athletes must repeatedly override this inherent mo-
tivational response, which refers to the instinctive or
natural inclination to avoid discomfort, fatigue, or the
negative effects associated with resisting temptation,
to persevere and succeed in endurance sports(Taylor
et al., 2018).
Optimizing endurance performance involves ad-
dressing motivational interventions and their sus-
tained maintenance. Individuals experiencing a de-
cline in motivation during exercise often express
Zhang, S., Kolensnikov, S., Rennspieß, T., Porzel, R., Schultz, T. and Liu, H.
Really Can’t Hold On Anymore? Physiological Indicators Versus Self-Reported Motivation Drop During Jogging.
DOI: 10.5220/0012577300003657
Paper published under CC license (CC BY-NC-ND 4.0)
In Proceedings of the 17th International Joint Conference on Biomedical Engineering Systems and Technologies (BIOSTEC 2024) - Volume 1, pages 821-831
ISBN: 978-989-758-688-0; ISSN: 2184-4305
Proceedings Copyright © 2024 by SCITEPRESS – Science and Technology Publications, Lda.
821

physiological discomfort, prompting the need to dis-
cern whether it stems from an actual physiological
change or acts as a trigger for perceived discomfort
leading to thoughts of quitting. Understanding this is
crucial, as persisting in exercise despite genuine phys-
iological discomfort may exacerbate issues, while ef-
fective management of motivation becomes essential
for maintaining or enhancing the exercise state.
This study delves into the impact of altered phys-
iological states, specifically discomfort reported and
triggered by decreased motivation, on monitored
physiological signals. A hypothesis was formulated,
suggesting that the discomfort individuals express
when their exercise motivation drops is reflected by
abnormalities in physiological signals. The inquiry
seeks to determine whether the physiological discom-
fort resulting from decreased motivation influences
exercisers’ health status, thus enhancing the preci-
sion of motivational interventions. The findings aim
to shed light on the intricate relationship between
motivation-induced discomfort and physiological sig-
nals, contributing to a deeper understanding of the
dynamics at play during exercise. Electrical biolog-
ical signals (ECG, sEMG, RSP) are utilized in this
study obtained from wearable devices, ensuring min-
imal disruption to exercisers and paving the way for
innovative integration of motivation-related functions
into smart exercise devices.
2 RELATED WORK
Considerable progress has been made in investigat-
ing how motivation affects sports performance, ath-
lete behavior, and competitiveness in competitions.
Individual sports are motivated to sport because of in-
ternal factors (such as enjoyment or skill development
and mastery) and external factors (such as rewards,
health, and appearance) (Moradi et al., 2020). Those
factors are full of uncertainty and variability. As a
personalized drive, motivation is highly individual-
ized and the interaction with external environmental
factors is complex. Most researchers agree on the ex-
istence of individual differences in motivational pref-
erences or traits (Kanfer and Ackerman, 2000).
Despite individual differences, the importance of
maintaining or boosting motivation during exercise
is crucial. The incorporation of physiological signal
tracking in wearable devices has become a founda-
tional aspect of exercise, enhancing the relevance of
apps or products aimed at improving motivation for
users. The researcher tries to realize the function of
boosting motivation by using music when the mood
is low by making mood judgment based on physio-
logical signal EDA in wearable devices (Baldassarri
et al., 2023). (Bauer and Kratschmar, 2015) presents
the application requirements needed to increase run-
ners’ motivation and control training, based on heart
rate monitoring and using the music for regulating the
runners pace. While mental state identification has
progressed personalized motivation enhancement, the
significance of physiological states during low moti-
vation levels is underexplored. Physiological discom-
fort, emphasized when individuals halt exercise due
to decreased motivation, underscores the need to in-
tegrate the exerciser’s physiological state in person-
alized motivational enhancement systems. The ab-
normality of reported physiological discomfort dur-
ing low motivation levels in terms of physiological
signaling remains uncertain, warranting analysis and
tracking of physiological signals for insights into the
state during motivation drops.
The selection of representative biosignals allows
individually monitoring of physiological changes pro-
duced in organ systems during endurance exercise.
The cardiovascular and musculoskeletal systems are
the two main organ systems affected during aerobic
exercise. Electrocardiography (ECG) is a tool that can
be used to study electrical abnormalities in patients
with cardiac disease (Krittayaphong et al., 2019).
The surface Electromyographic (sEMG) signal is
a biomedical signal that measures the electric currents
generated in muscles during their contraction that rep-
resent neuromuscular activities. EMG signals are one
of the most commonly used data for studying human
activities and behaviors (Liu and Schultz, 2022; Hart-
mann et al., 2022; Cai et al., 2023; Liu et al., 2023;
Hartmann et al., 2023; Cai et al., 2024). The nervous
system always controls muscle activity (contraction /
relaxation) (Reaz et al., 2006).
Furthermore, the researchers also proposed that
changes in motivation may also be reflected in
changes in reported respiration rate (Martin et al.,
2018). Currently, physiological signals are widely
used in the field of sports psychology. Multimodal
information and multichannel physiological signals
to measure emotional responses offer more informa-
tion for emotion recognition. Possible physiological
signals include ECG, electromyogram (EMG), elec-
trooculogram (EOG), electroencephalogram (EEG),
skin conductance response (SCR), galvanic skin re-
sponse (GSR), pulseoximetry, skin temperature, an-
terial blood pressure (ABP), blood volume pulse
(BVP), and electrodermal activity (EDA), among oth-
ers (Wu et al., 2015; Shi et al., 2023).
The relationship between various types of physio-
logical signals (e.g.,ECG, sEMG, and RSP) and mo-
tivation levels has not been explored, which becomes
BIOSIGNALS 2024 - 17th International Conference on Bio-inspired Systems and Signal Processing
822

this study’s research topic, focusing on whether phys-
iological signals are associated with decreased self-
reported motivation.
3 DATA
Acknowledging the gap in dedicated databases for
investigating motivational dimensions in jogging, a
methodologically rigorous experiment has been de-
signed. The primary objective is to induce a notice-
able reduction in motivation during physical exertion,
simultaneously capturing biometric signals from par-
ticipating individuals. This systematic paradigm is
crafted to build a comprehensive database, enabling
an in-depth exploration of the interrelationship be-
tween motivational states and physiological signals
within the jogging context.
3.1 Experiment Design
3.1.1 Selections of Biosignals
Aerobic training requires the perfect matching of the
respiratory and cardiovascular systems, in order to
provide the muscles with the necessary supply of en-
ergy to be transformed into mechanical work (Beh,
1990). The state of the respiratory, cardiovascu-
lar, and skeletal muscle systems during jogging is
closely related to the current performance of the ath-
lete. Changes in these three physiological systems are
significant when exercisers are exercising, attempt-
ing to quit, or after quitting exercise. Based on my
own exercise experience, observation and communi-
cation with jogging athletes, shortness of breath, el-
evated heart rate, and muscle fatigue are commonly
cited physiological discomforts during exercise. It’s
also proved by this study’s post-questionnaire, which
is presented in section 5. The selection of biological
signals representative of all three physiological sys-
tems is undertaken to characterize the present state
of the system. These signals include ECG, RSP, and
sEMG.
3.1.2 Self-Reported Motivation Drops
The waning of motivation, serving as a behavioral
driver, significantly influences an individual’s deter-
mination to persist in exercise. Consequently, we de-
fine a drop in motivation as the inclination not to con-
tinue with the exercise, which may arise from factors
such as shortness of breathing, rapid heartbeat, anx-
iety, fatigue, among others. In the experiment, the
exercisers’ diminished motivation implied their reluc-
tance to continue exercising.
To capture instances of motivation drop without
disrupting the jogging process, each participant held a
small rubber duck smaller than the palm of their hand.
When an exerciser experienced a defined drop in mo-
tivation, they were required to squeeze the rubber
duck, thereby completing a self-report of the dimin-
ished motivation. Throughout the designated exercise
period (20 minutes), participants were permitted to
squeeze the little yellow duck an unlimited number of
times, yet were obligated to persist until the comple-
tion of the predefined exercise duration. The purpose
of this design is that it is desired to collect as much
physiological data about motivation drops as possible
from participants.
3.1.3 Experiment Procedure
The study conducted a jogging experiment, capturing
ECG, RSP, and sEMG signals, selected for their rel-
evance to an exerciser’s ongoing performance. Par-
ticipants jogged on a treadmill under specified condi-
tions, completing pre- and post-questionnaires cover-
ing personal details, motivation levels, emotional re-
sponses, and physiological sensations.
The running duration of 20 minutes was deter-
mined to allow runners of diverse backgrounds to
experience at least one power drop at an appro-
priate speed. The treadmill settings included 11
evenly divided subsections, with each mode further
divided into 3 phases: 2 warm-up segments at 6 km/h
for approximately 3.6 minutes and 8 constant-speed
running segments lasting around 15 minutes. Two
modes, moderate (7 km/h) and high (8 km/h), along
with a relaxation mode (5 km/h for about 1.5 min-
utes), were designated. These settings applied to male
participants, and adjustments were made for female
participants by reducing speed by 0.5 km/h in each
phase. Additional details are provided in Table 1.
Running speed varied according to individual run-
ner backgrounds, and the trials were conducted in-
doors on a treadmill to control environmental vari-
ables. Recognizing motivation’s sensitivity to envi-
ronmental factors, the experiment implemented mea-
sures to minimize external stimuli, such as covering
the treadmill screen to create a silent environment.
Subjects refrained from wearing headphones to elim-
inate temporal cues during exercise, and communica-
tion between subjects and experimenters was limited,
intentionally cultivating a ”boring and monotonous”
experimental setting.
The goal was to induce as many motivation drops
as possible, ensuring a balanced database. Two tread-
mill modes were configured: the ”high” mode, de-
signed to induce motivation drops even for habitual
exercisers (comprising over 60% of subjects exercis-
Really Can’t Hold On Anymore? Physiological Indicators Versus Self-Reported Motivation Drop During Jogging
823
ing 3 hours or more per week), and the ”moderate”
mode, more suitable for non-habitual exercisers.
Before the experiment, participants were briefed
on the definition of ”motivation drops,” and instances
of these feelings were self-reported by squeezing a
rubber duck. The entire session was audio-recorded,
and debriefing timings were manually documented.
The rubber duck, chosen for its ergonomic size,
ensured minimal additional exertion and avoided gen-
erating abnormal physiological signals during report-
ing. All participants provided informed consent,
signed a data protection agreement, and agreed to
audio recording during the experimental sessions.
To ensure safety, participants were required to pro-
vide information about their health status in the pre-
questionnaire, including their medical history, and
were informed they could voluntarily halt the exper-
iment if they experienced any abnormalities intolera-
ble to their body.
Table 1: Two mode of running.
Mode 1 Mode 2
Setting
Pace
(km/h)
Incline
(
◦
)
Pace
(km/h)
Incline
(
◦
)
Warm-Up 6 6 5.5 5
Moderate 7 7 6.5 6
High 8 8 7.5 7
Cooldown 5 5 4.5 5
3.2 Data Acquisition
In this study, 11 subjects, free from known car-
diac diseases, participated in data collection activi-
ties, comprising six females and five males aged 22
to 37, with weights ranging from 51 kg to 100 kg.
Eight subjects engaged in regular endurance exercise,
while two did not have a fixed exercise routine. The
participation time for each subject was approximately
35 minutes, covering various activities. All subjects
provided written informed consent for data storage
and subsequent studies, with the dataset shared in
anonymized form.
The study employed ECG and sEMG sensors
from PLUX’s Cardio BAN and Muscle BAN, along
with a wired RSP sensor connected to PLUX’s
Hub, using OpenSignals software for data collection.
These sensors facilitated signal acquisition during ex-
ercise, and the collected data were pseudonymized to
ensure participant anonymity.
3.3 Dataset
The dataset, adhering to the h5-format, was systemat-
ically recorded for 11 subjects, encompassing a total
duration of 211 minutes and 36 seconds (equivalent
to 3 hours, 31 minutes, 36 seconds) of data.
One subject’s data did not include a self-reported
motivation drop; however, for the efficient allocation
of academic resources, it was retained in the dataset.
In the following Table 2, 11 subjects reported a to-
tal of 68 motivation drops. Male subjects reported 41
motivation drops, while female subjects reported 24
motivation drops. On average, each male subject re-
ported 8.2 times motivation drops, while the average
number of motivation drops reported by female sub-
jects was only half of that reported by male subjects.
Table 2: Dataset statistical results.
Male Female
Numbers 5 6
Amounts of MDs 41 24
Averaged number of MDs 8.2±4.83 4±4.43
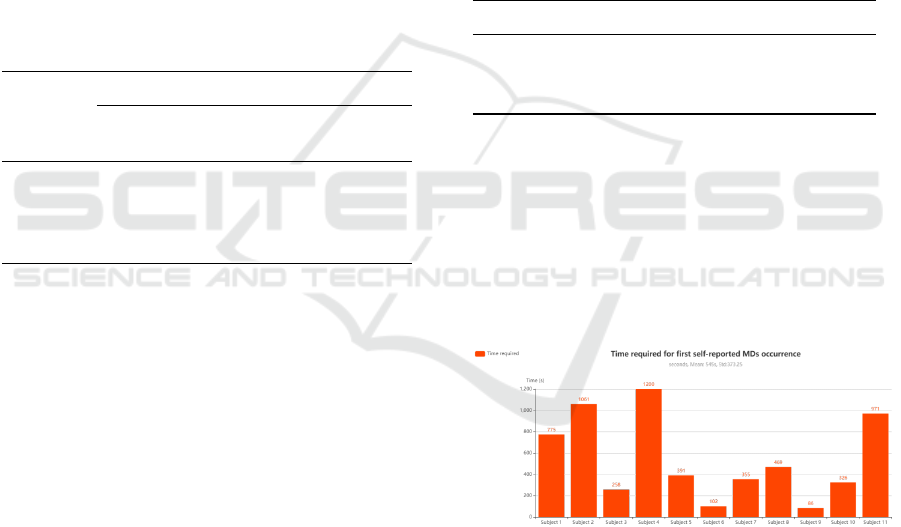
Notably, one participant exhibited a sustained mo-
tivational state throughout the entirety of the experi-
ment. Among instances wherein motivation drops oc-
curred, the temporal spectrum for reaching the first
episode varied, with the swiftest occurrence transpir-
ing at 86 seconds and the most protracted interval ex-
tending to 1061 seconds (17 minutes and 41 seconds)
1. The manifestation of diminished motivation ap-
pears to be subject to individual variability.
Figure 1: The time it takes for the first motivational drop to
occur among different subjects.
4 METHODOLOGY
In this section, the methodologies employed for the
analysis and detection of occurrences of diminished
motivation are delineated, encompassing HRV anal-
ysis, and a deep learning model, specifically Long
Short-Term Memory (LSTM). An overview of anal-
ysis framework used in this study are shown in the
figure 2.
BIOSIGNALS 2024 - 17th International Conference on Bio-inspired Systems and Signal Processing
824

Figure 2: The framework for investigating relationship be-
tween self-reported Motivation drops and biosignals.
4.1 HRV Analysis
HRV consists of great value in sports due to the syn-
ergy between the heart and numerous systems. Heart
rate variability is often mentioned by exercisers af-
ter exercise, and this feedback is also reflected in the
post-questionnaire. HRV may be recognized as the re-
sponse of the heart towards any kind of stimuli so that
it compensates the situations accordingly, and thus,
its variation may be used as warning signs of cardiac
diseases (ChuDuc et al., 2013). If a person quits ex-
ercising because of decreased motivation, he or she
often complains of cardiac distress, such as tachycar-
dia, chest tightness, etc.
HRV is one of the means to find out the state of
the automatic nerve system (ANS). The variation be-
tween heartbeat is low in sympathetic activation and
high in parasympathetic mode. It has been observed
that low HRV indicates cardiovascular diseases such
as hypertension, whereas high HRV shows higher car-
diac fitness (Tiwari et al., 2021). Abnormalities in
HRV analysis can be used as a basis for abnormal
physiologic signals.
4.2 Self-Similarity Matrix Anlysis
The purpose of the Self-Similarity Matrix (SSM) is
to compare each sample of the signals with all the
other samples. To calculate the SSM, the dot prod-
uct between the transposed Feature Matrix (FM) and
itself is performed. Hence, each column of the ma-
trix is compared with every other column, yielding
a similarity score (Santos et al., 2021). Columns
sharing common feature values exhibit higher similar-
ity scores, while those with diverging feature values
manifest lower similarity scores (Paulus et al., 2010)
(Bello et al., 2018). Each column of the matrix signi-
fies the characterization of each segment of the signal
selected during the sliding window process.
The value of the principal diagonal represents the
highest similarity value. Block structures signify ho-
mogeneous regions in the signal, and when a block
structure transitions to a different one along the di-
agonal, it indicates a change in the signal’s behav-
ior. The presence of additional diagonals in the ma-
trix, aside from the primary diagonal, suggests that
the columns and rows divided by the secondary diag-
onal share similar properties.
It’s worth noting that, a widely used biomedical
signal, ECG, has testified to the feasibility of SSM
(Rodrigues et al., 2022). This analysis enables the
scrutiny of the correlation between decreased motiva-
tion for autonomous reporting and abnormal physio-
logical signals. Detailed results of the self-similarity
matrix analysis are elucidated in the Results section.
4.3 LSTM Model
The choice of LSTM was inspired by research ”Ro-
bust ECG R-peak detection using LSTM”. This study
discusses the use of LSTM models to learn long-time
dependencies in temporal signal ECGs and to iden-
tify R-peaks(Laitala et al., 2020). LSTM networks
are known for their ability to capture long tempo-
ral dependencies, to learn complex pattern and their
robustness to irregularity. LSTM has the process-
ing power before or without feature extraction (Wang
et al., 2024). The data employed in this study consist
entirely of time-series signals, with motivation levels
characterized by changes over time. In the case of
complex and elusive signal patterns, the LSTM model
excels in learning the structural features of intricate
signals through supervised learning on pre-labeled
segments.
4.3.1 Annotation Based on Self-Reported
Using a sampling frequency of 1000Hz, the moment
of rubber duck squeezing as the central point was con-
sidered. Subsequently, we marked 500 adjacent sam-
pling points to this moment as 1, while the remaining
points were labeled as 0. The conceptualization of
motivation drop occurrence extends beyond a singu-
lar moment, viewing it as a process with a specific
duration. It’s also important to note that the act of
squeezing the rubber duck lags behind the moment of
perceiving the motivation drop, and the drop does not
immediately dissipate upon squeezing.
4.3.2 Time Series Data Splitting and Cross
Validation
The training approach adapts to individual motiva-
tional profiles, employing an individual-dependent
model due to motivational variations. A sliding win-
dow approach is employed for homogeneous cross-
Really Can’t Hold On Anymore? Physiological Indicators Versus Self-Reported Motivation Drop During Jogging
825
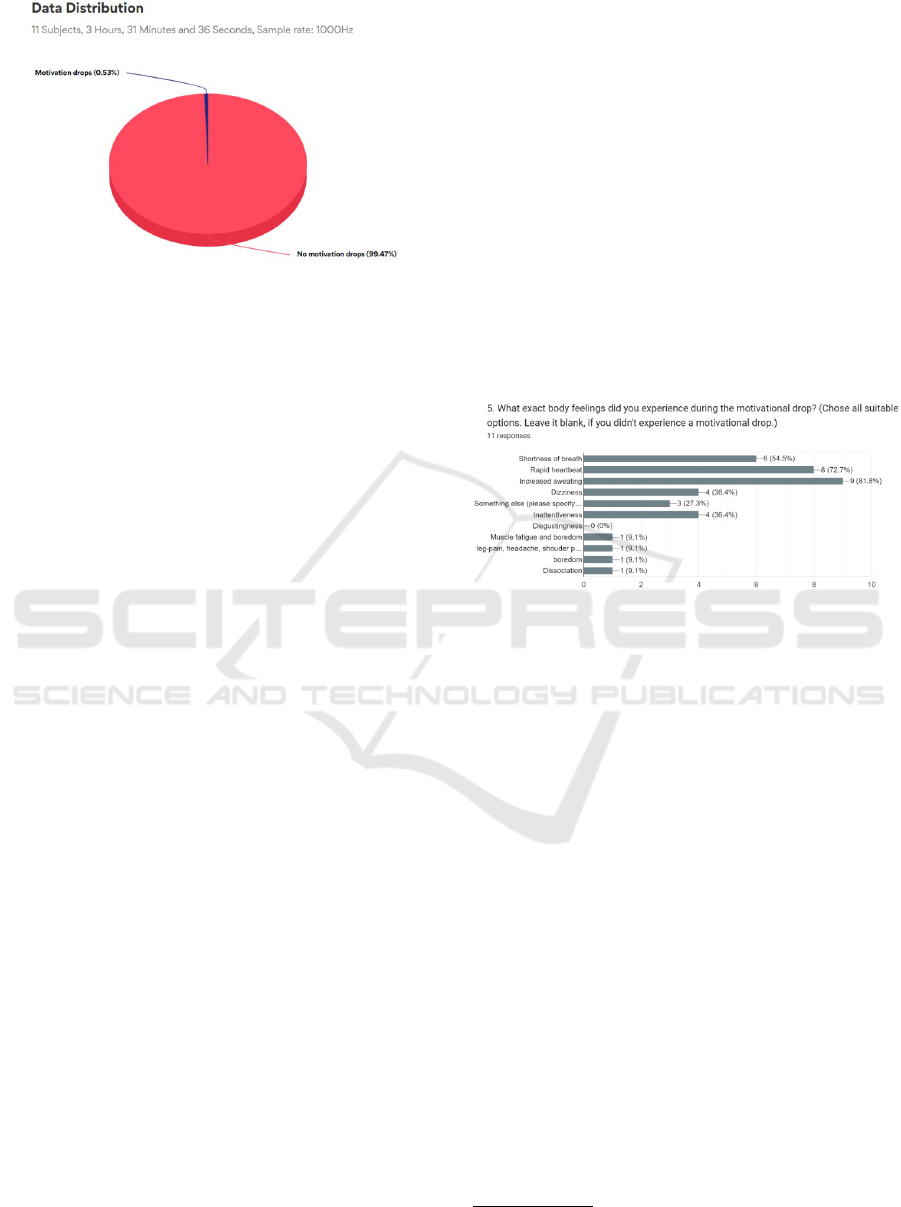
Figure 3: Data proportion (Motivation Drops (MDs)).
validation, initially dividing each subject’s data into
80% training, validation, and 20% test sets. Sub-
sequently, 80% of the training set undergoes a four-
segment division, with the initial 80% forming train-
ing sets and the remaining 20% constituting valida-
tion sets, resulting in a 4-fold cross-verification.
4.4 Motivation Drop Prediction: LTSM
Model
The bidirectional LSTM layer and a dense layer of
the constructed sequence model. Each layer has 64
units, and the final dense layer contains only one out-
put unit. The hyperbolic tangent is used as the activa-
tion function of all other layers, except that the final
output layer uses sigmoid as the activation function.
This model, which has proven effective in the study
of R-peak recognition, serves as a reference for train-
ing in this study (Laitala et al., 2020) aiming to derive
initial conclusions using a relatively compact network
structure. The model was not optimized in this phase,
as the primary objective of this study was to iden-
tify the presence of physiological abnormalities. The
input sequence is three channels, respectively ECG,
RSP and sEMG. The data length of each sequence is
4000, and the overlap between each two sequences is
50%.
5 RESULTS AND DISCUSSION
5.1 Questionnaire
As evident from the post-questionnaire statistics in
figure 4, the three most frequently reported physiolog-
ical discomforts during motivational drops are short-
ness of breath, rapid heartbeat, and profuse sweat-
ing. Among the 11 subjects, 6 mentioned experi-
encing shortness of breath, 8 reported a rapid heart-
beat, and 9 noted an increase in sweating during self-
reported motivation drops. This implies that the cho-
sen ECG and respiratory signals for the experiment
are apt for describing the physiological discomfort as-
sociated with declining motivation.
However, it’s worth noting that increased sweat-
ing, mentioned by the majority of subjects, was not
captured by relevant physiological signals such as
Electrodermal Activity (EDA), which can measure
skin changes. EDA is a common feature integrated
into many healthcare monitoring devices, including
smartwatches.
Additionally, only one person reported muscle
soreness and fatigue during the autonomous debrief-
ing of motivation drops. Interestingly, vertigo and
inattention were more frequently mentioned. This
provides a rationale for subsequent analysis focusing
on neurologically related indicators.
Figure 4: Results from post-questionnaire about how sub-
jects felt when motivation drops happened.
5.2 RR-Interval, Instantaneous Heart
Rate (IHR) and LF/HF Ratio
5.2.1 RR-Interval
Heart rate variability (HRV) is one of the health in-
dicators used worldwide (Litscher et al., 2014). It
is important to assess the variation in heart rate for
evaluating cardiac conditions by studying the fluctu-
ation in RR intervals (Tiwari et al., 2021). RR in-
tervals (R-wave peak to R-wave peak in electrocar-
diograms, RRI) represent the measurements of the
sinus heart period in chronological or heartbeat or-
der (Electrophysiology, 1996). RR-Interval and IHR
were generated in real-time by Heart Rate Variabil-
ity (HRV) Add-on while acquisition
1
. The fluctua-
tion interval of RR-Interval is depicted in the figure 5
through box plots, wherein the RR-Interval at the mo-
ment (s) of motivational drops is highlighted as a red
dot. The results illustrate variations in the fluctuation
range and magnitude of RR-Interval among differ-
ent subjects, highlighting the individual independence
1
https://www.pluxbiosignals.com/products/heart-rate-
variability-hrv-add-on (accessed 13.Jan.2024)
BIOSIGNALS 2024 - 17th International Conference on Bio-inspired Systems and Signal Processing
826
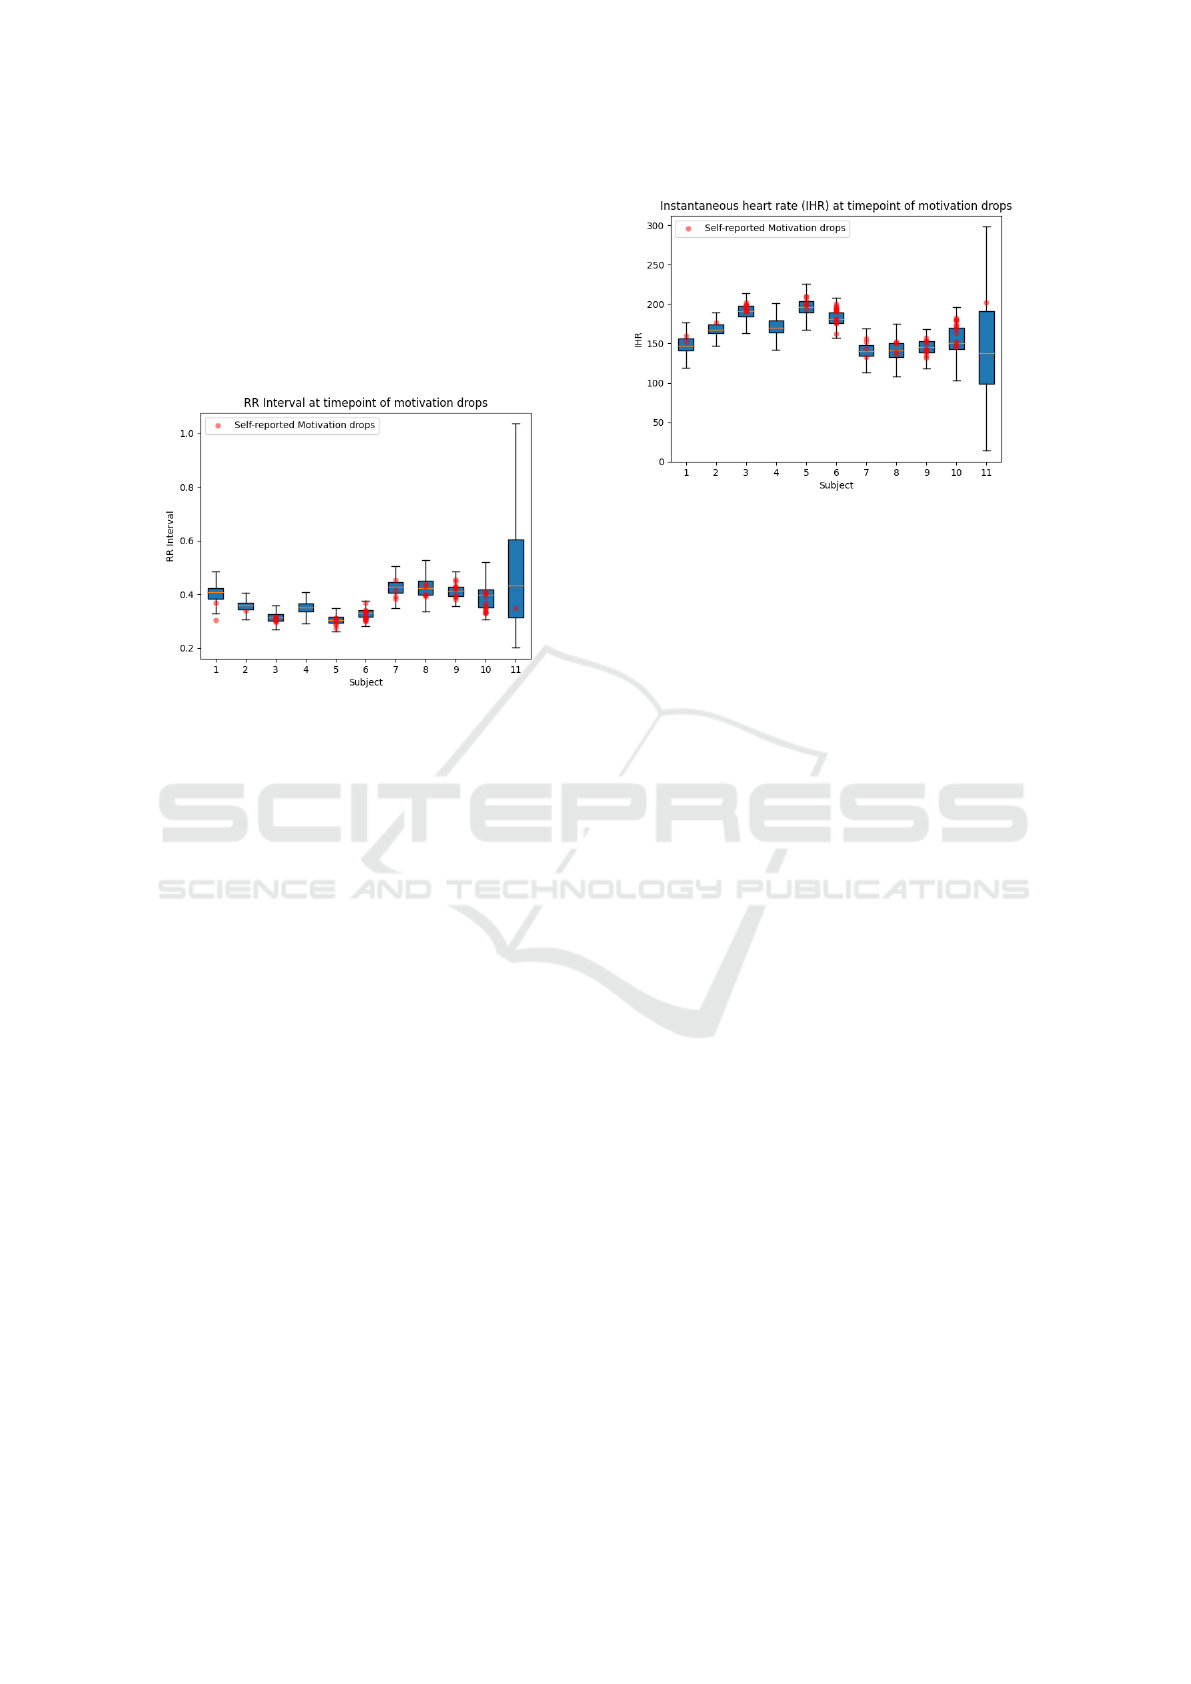
of RR-interval data. Among the RR-intervals corre-
sponding to moments of motivational drops, only one
fell within the range of outliers, while the data for
the remaining self-reported motivation drop instances
were distributed between the maximum and minimum
values. This suggests that RR-interval did not exhibit
observable anomalies when individuals became aware
of motivational drops.
Figure 5: Box plots of the range of variation in subjects’
RR-interval, and the RR-interval corresponding to the onset
of motivational drops.
5.2.2 Instantaneous Heart Rate (IHR)
HRV helps not only in identifying the risk of cardiac
diseases but also in the state of ANS (Tiwari et al.,
2021). Instantaneous heart rate provides a direct mea-
sure of vagal nerve and sympathetic nervous system
activity and is of substantial use in a number of an-
alyzes and applications (Jarchi and Casson, 2017).
Initially, the box plot in figure 6 illustrates the time-
domain distribution of IHR for each subject, provid-
ing insight into the range of IHR distribution. Con-
currently, the IHR at the onset of motivational drops
is denoted by a red dot in the plot. Similar to the RR-
Interval distribution plot, the distribution interval var-
ied for each subject, underscoring the individual inde-
pendence of the data. Notably, the IHR corresponding
to the moment of motivational drops did not qualify as
an outlier for all subjects, despite rapid heartbeat be-
ing was reported as a physiological discomfort in the
Post-questionnaire by eight subjects.
5.2.3 LF/HF Ratio
Empirical evidence suggests that the activity of
theSympathetic Nervous System (SNS) influences the
low frequency band (LF) of the HRV, from 0.04 to
0.15 Hz, while the Parasympathetic Nervous Sys-
tem (PNS) is predominantly reflected in the high
frequency band (HF), from 0.15 to 0.4 Hz, and
Figure 6: Box plots of the range of variation in subjects’
IHR, and the IHR corresponding to the onset of motiva-
tional drops.
also possibly in a proportion of LF (Malik et al.,
1996). By comparing the timepoint at which the
subjects reported in the experiment that the Motiva-
tion drop occurred (i.e., the point in time at which
they felt a physical or psychological change) with
the changes in sympathetic-vagal balance that were
found through the HRV analysis. The low-Frequency
power/ high-Frequency power (LF/HF) ratio assumes
that a low LF/HF ratio reflects parasympathetic dom-
inance. This is seen when we conserve energy and
engage in tend-and-befriend behaviors. In contrast,
a high LF/HF ratio indicates sympathetic dominance,
which occurs when we engage in fight-or-flight be-
haviors or parasympathetic withdrawal (Shaffer and
Ginsberg, 2017). Pagani proposed to combine low
frequency band (LF) and high frequency band (HF)
into the low-to-high frequency ratio (LF/HF) as an in-
dex for the sympathovagal balance between the two
nervous systems (Pagani et al., 1986). But this theory
also received some criticism. Such as in a compre-
hensive study by Billman, it was conclusively shown
that sympathovagal balance cannot be quantified by
a single number, the LF/HF, which assumes a sim-
plistic linear relationship between the activity of the
nervous systems and the frequency bands (Billman,
2013). From the results of HRV analysis in frequency
domain, among the 68 reported motivation drops, 44
occurred when the LF/HF ratio was below 0.5. In
healthy adult, during rest ratio (LF/HF) is 1:2 (Ti-
wari et al., 2021). However, not all instances of self-
reported motivation drops coincide with a low LF/HF
ratio. Subject 4 exhibited a consistent absence of mo-
tivation drops during running, concomitant with the
sustained maintenance of an LF/HF ratio below 0.5.
Unfortunately, these findings in the ECG signal do not
form a consistent indicator that directly points to the
occurrence of decreased motivation.
Really Can’t Hold On Anymore? Physiological Indicators Versus Self-Reported Motivation Drop During Jogging
827

5.3 sEMG and RSP Analysis and
Observation
During jogging, the frequency of breathing and the
motion state of the upper and lower limb muscles of-
ten play a crucial role in determining whether to cease
exercise. The time nodes of self-reported motivation
drops were marked on the respiration rate graph and
the thigh sEMG signal graph. Through observation, it
was noted that the peak physiological signals, namely
the peak respiration rate and muscle signal, did not
consistently align with the self-reported motivation
drop points. Despite subjects repeatedly reaching the
peak of the biological signal, interpreted as the phys-
iological limit value for the current exercise (defined
here as the highest peak value not breached during
exercise), they did not report a decrease in motivation
each time the limit value was reached. This suggests
a lack of significant association between respiration
signals and sEMG signals on motivation drops.
The respiration rate chart clearly illustrates that
subjects proactively adjust their respiration rate after
reporting motivation drops, reducing it through con-
scious modulation. This aligns with the subject’s def-
inition of decreased motivation, and the decrease in
breathing rate aids in continuing the exercise. Con-
versely, excessive breathing rate or shortness of breath
may induce a sense of decreased motivation.
However, in sEMG from the thigh, this modula-
tion consciousness is less evident. This observation
may be linked to the experimental environment, as
jogging on the treadmill aligns the running rhythm
closely with the treadmill setting, limiting the vari-
ability in thigh muscle movement.
5.4 Self-Similarity Matrix Analysis
Results
Self-similarity matrix reports abnormal segments of
physiological signals and segments with similar pat-
tern or features through diagonal and blocks showed
in matrix in Figure 7. This results are produced by
subject 6 who has 4 self-reported motivation drops
time interval 800s-900s out of the whole 20min jog-
ging. In total, subject 6 reported 15 times motiva-
tion drops in 20min jogging. The top row shows the
raw data of ECG, sEMG and RSP, the middle part is
the self-similarity matrix and in the bottom row, those
peak values represents changes happened in signals.
The self-similarity matrix of ECG presents clearly the
periodicity, in contrast, the matrix of sEMG point to
non-periodicity and very little similarity. And the ma-
trix of respiration indicates respiration system stayed
in a stable state.
However, all three analysis (diagonal matrix,
blocks and secondary matrix) mentioned in last sec-
tion shows that there isn’t some significant abnor-
mal pattern when participants self-reported motiva-
tion drops. Peak values can suggests certain changes,
but the difference between the peak and the mean is
not significant. Not enough to reveal an abnormal sig-
nal fragment. Also, the frequency of peaks was much
higher than the number of participant complaints, so
changes in physiological signals could not be recog-
nized as antecedents or consequences of motivation
drops.
Figure 7: Subject 6: Self-Similarity Matrix (SSM) of ECG,
sEMG, RSP, Window length: 2s, overlap: 50%.
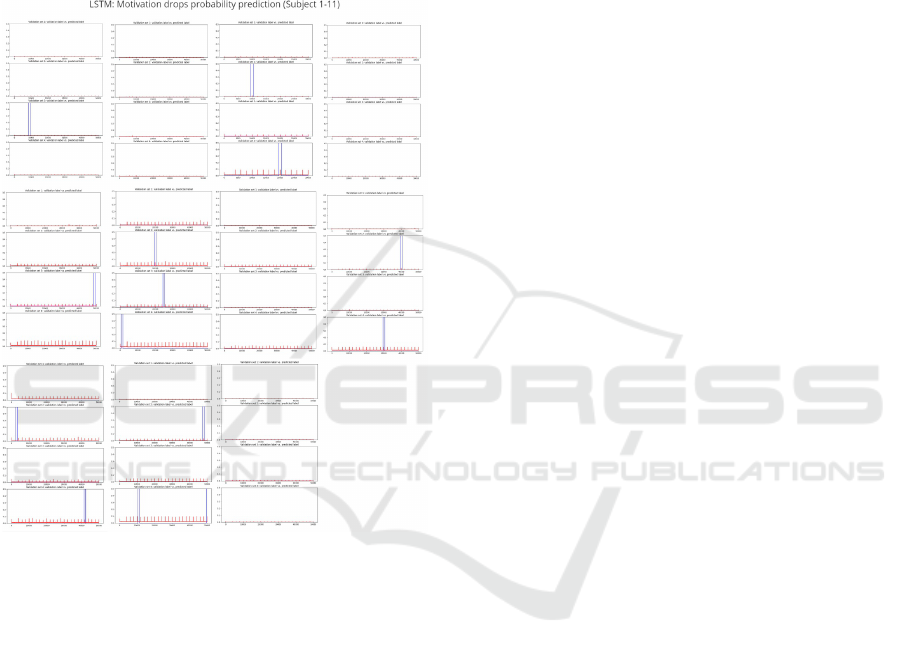
5.5 LSTM Prediction
The predicted probability of motivation drops based
on labeled data by self-reported motivation drops dur-
ing jogging is shown in Figure 8. Firstly, the gener-
ally low predicted values (ranging from 0 to 1) stem
from the extreme imbalance within the database. .
Secondly, the occurrence frequency of time points
predicted to have relatively high probabilities signifi-
cantly surpasses the frequency of subjects experienc-
ing motivation drops. This suggests that, according to
the LSTM learning results, signal fragments resem-
bling the characteristics of the fragment labeled at the
time of motivation drops occur much more frequently
than autonomously reported motivation drops. This
also indicates that the pattern of the signal corre-
sponding to autonomously reported motivation drops
is not rare in the LSTM model’s learning results.
Meanwhile, in both the validation and test sets,
only a limited number of signal segments at the time
points labeled as motivation drops were predicted to
share similar characteristics with those labeled as 1 in
the training set, and this occurred with higher proba-
bility. This illustrates that the commonality between
the labeled segments is not apparent. However, it is
essential to note that the extreme imbalance in the
database and the person-dependent nature of the re-
search methodology might hinder definitive conclu-
sions regarding whether the lack of commonality is
intrinsic to the signals or if it results from insufficient
BIOSIGNALS 2024 - 17th International Conference on Bio-inspired Systems and Signal Processing
828
data at the labeled motivation drop, thereby impact-
ing optimal learning. An observable periodicity is
evident, potentially linked to the periodic nature of
ECG and respiration signals. Remarkably, this peri-
odicity remains unaffected by the presence or absence
of motivation drops. Partial findings indicate that the
aggregate predicted value tends to be lower than in-
stances of self-reported motivation drops during seg-
ments when no motivational drops is reported.
Figure 8: Left to right: Subject1-4 (row 1), Subject 5-8
(row 2), Subject 9-11 (row 3), windowlength: 4000, over-
lap 50%, Predicted results on validation set. Blue square:
self-reported motivation drops. Left: y-scale: 0-1, Right:
y-scale: 0-0.5.
5.6 Discussion
This study aimed to explore whether the discom-
forts reported and triggered by decreased motiva-
tion had discernible effects on monitored physio-
logical signals. A comprehensive analysis frame-
work was proposed in this study which inlcudes data
acquisition, pre-/post- questionnaire, HRV analysis,
self-similarity matrix analysis and machine leanring
with LSTM model. ECG and RSP serve as rep-
resentative signals in the experiments, enabling the
characterization of the proposed main physiologi-
cal discomforts. These signals can be collected in
real-time without interfering with exercise, making
them justified for studying motivation drops during
physical activity. Although EDA, mentioned sev-
eral times as a physiological discomfort, was not ex-
plored in the experiments, its widespread use in health
monitoring devices suggests potential applications in
motivation-related studies, opening avenues for inte-
grating motivation-related functions into health mon-
itoring devices.
In HRV analysis, ECG signal segments corre-
sponding to the onset of autonomously reported mo-
tivation decrements were analyzed in both time and
frequency domains. The resulting indicators (RR-
Interval, IHR, LF/HF ratio) fell within the nor-
mal range, indicating that these signal segments
lacked observable abnormalities. On the contrary,
the self-similarity matrix focused on detecting mu-
tated abnormal segments in the three signals (ECG,
sEMG, RSP). Results demonstrated significant pat-
tern changes in all three signals at the moment of
motivation drops. However, compared to motor seg-
ments without reported motivation decrements, the
signals corresponding to the onset of self-reported
motivation decrements showed no observable pattern
changes, suggesting that no abnormal physiological
signals were generated alongside motivation decre-
ments.
The prediction results of the LSTM were not
highly convincing, attributed to database size and bal-
ancing issues. For a single subject, the LSTM model
did not sufficiently learn features of physiological sig-
nal segments corresponding to autonomous reporting
of motivation drops. Improvements could be made
by increasing single-subject data length and balancing
the database. Nonetheless, the learning results still
indicate that signal fragments with high similarity to
those labeled as motivation drops appear frequently
and at non-subject-mentioned time points. The dif-
ficulty in discriminating the model when signal frag-
ments labeled as motivation drops appeared in the test
set was due to low similarity of representative features
between these fragments.
The experimental design did not account for gen-
der differences in the autonomous expression of mo-
tivational decrements, with male subjects reporting
them twice as often as female subjects. Females
tended to hesitate in reporting and employed positive
mental cues, while males exhibited a stronger need
for communication when bored, potentially influenc-
ing the frequency of reported motivation drops. De-
spite efforts to control the experimental environment,
self-reported data’s highly subjective nature reveals
significant variability in subjects’ processing and re-
action to the environment and decision-making.
Really Can’t Hold On Anymore? Physiological Indicators Versus Self-Reported Motivation Drop During Jogging
829

6 CONCLUSION AND FUTURE
WORK
Contrary to hyphothesis, our findings reveal the ab-
sence of a direct link between self-reported motiva-
tion and biological signals. Specifically, biological
signals prove inadequate as reliable indicators of per-
sonalized motivation drops. Instances of motivation
drops do not elicit abnormal biological signals, and
certain biological signals peak without corresponding
to motivation drops.
While diminished motivation prompts exercise
cessation, it does not manifest in discernible alter-
ations in biological signals. Our study introduces a
pioneering hypothesis, aiming to explore whether mo-
tivation drop elicits abnormalities in biological sig-
nals or self-comparative irregularities. Future in-
vestigations should also prioritize database equilib-
rium, striving to achieve a balanced representation.
Addressing the data balancing issue before training
may enhance the interpretability and credibility of
the predicted results. The focus ought to shift from
singularly scrutinizing predictive probability values
to emphasizing trends foreseen by the algorithm.
In essence, attention should pivot towards instances
when the probability of motivation drop exhibits con-
tinuous or relatively substantial escalation, rather than
fixating on discrete probability values at isolated time
points.
Assessing the trustworthiness of self-reporting is
challenging due to the strongly subjective nature of
self-reported motivation drops. In future studies,
objective descriptions of motivation drops can miti-
gate the effects of personal dependence brought about
by subjective awareness in studies exploring whether
motivational drop causes abnormal physiological sig-
nals. Natural facial expressions (Bian et al., 2023;
Veldanda et al., 2024), as an auxiliary to physiologi-
cal signals, also have the potential to provide another
dimension of information.
REFERENCES
Baldassarri, S., Garc
´
ıa de Quir
´
os, J., Beltr
´
an, J. R., and
´
Alvarez, P. (2023). Wearables and machine learning
for improving runners’ motivation from an affective
perspective. Sensors, 23(3):1608.
Bauer, C. and Kratschmar, A. (2015). Designing a music-
controlled running application. Proceedings of the
33rd Annual ACM Conference Extended Abstracts on
Human Factors in Computing Systems.
Beh, H. C. (1990). Achievement motivation, performance
and cardiovascular activity. International Journal of
Psychophysiology, 10(1):39–45.
Bello, J. P., Grosche, P., M
¨
uller, M., and Weiss, R. (2018).
Content-based methods for knowledge discovery in
music. Springer Handbook of Systematic Musicology,
page 823–840.
Bian, Y., K
¨
uster, D., Liu, H., and Krumhuber, E. G.
(2023). Understanding naturalistic facial expressions
with deep learning and multimodal large language
models. Sensors, 24(1):126.
Billman, G. E. (2013). The lf/hf ratio does not accurately
measure cardiac sympatho-vagal balance. Frontiers in
Physiology, 4.
Cai, L., Yan, S., Ouyang, C., Zhang, T., Zhu, J., Chen,
L., and Liu, H. (2024). Associating endpoint accu-
racy and similarity of muscle synergies. In BIOSIG-
NALS 2024 — 17th International Conference on Bio-
Inspired Systems and Signal Processing. INSTICC,
SciTePress.
Cai, L., Yan, S., Ouyang, C., Zhang, T., Zhu, J., Chen,
L., Ma, X., and Liu, H. (2023). Muscle synergies
in joystick manipulation. Frontiers in Physiology,
14:1282295.
ChuDuc, H., NguyenPhan, K., and NguyenViet, D. (2013).
A review of heart rate variability and its applications.
APCBEE Procedia, 7:80–85.
Electrophysiology, T. F. (1996). Heart rate variability. Cir-
culation, 93(5):1043–1065.
Hartmann, Y., Liu, H., Lahrberg, S., and Schultz, T. (2022).
Interpretable high-level features for human activity
recognition. In Proceedings of the 15th Interna-
tional Joint Conference on Biomedical Engineering
Systems and Technologies (BIOSTEC 2022) - Volume
4: BIOSIGNALS, pages 40–49.
Hartmann, Y., Liu, H., and Schultz, T. (2023). High-level
features for human activity recognition and model-
ing. In Roque, A. C. A., Gracanin, D., Lorenz, R.,
Tsanas, A., Bier, N., Fred, A., and Gamboa, H., edi-
tors, Biomedical Engineering Systems and Technolo-
gies, pages 141–163, Cham. Springer Nature Switzer-
land.
Jarchi, D. and Casson, A. J. (2017). Towards
photoplethysmography-based estimation of in-
stantaneous heart rate during physical activity.
IEEE Transactions on Biomedical Engineering,
64(9):2042–2053.
Kanfer, R. and Ackerman, P. (2000). Individual differences
in work motivation: Further explorations of a trait
framework. Applied Psychology, 49(3):470–482.
Krittayaphong, R., Muenkaew, M., Chiewvit, P., Ratanasit,
N., Kaolawanich, Y., Phrommintikul, A., and CORE
Investigators (2019). Electrocardiographic predictors
of cardiovascular events in patients at high cardiovas-
cular risk: a multicenter study. J. Geriatr. Cardiol.,
16(8):630–638.
Laitala, J., Jiang, M., Syrj
¨
al
¨
a, E., Naeini, E. K., Airola, A.,
Rahmani, A. M., Dutt, N. D., and Liljeberg, P. (2020).
Robust ecg r-peak detection using lstm. Proceedings
of the 35th Annual ACM Symposium on Applied Com-
puting.
Litscher, G., He, W., Yi, S.-H., and Wang, L.
(2014). Heart rate variability and complementary
BIOSIGNALS 2024 - 17th International Conference on Bio-inspired Systems and Signal Processing
830

medicine. Evidence-Based Complementary and Al-
ternative Medicine, 2014:1–2.
Liu, H. and Schultz, T. (2022). How long are various types
of daily activities? statistical analysis of a multimodal
wearable sensor-based human activity dataset. In Pro-
ceedings of the 15th International Joint Conference
on Biomedical Engineering Systems and Technologies
(BIOSTEC 2022) - Volume 5: HEALTHINF, pages
680–688.
Liu, H., Xue, T., and Schultz, T. (2023). On a real real-time
wearable human activity recognition system. In Pro-
ceedings of the 16th International Joint Conference
on Biomedical Engineering Systems and Technologies
(BIOSTEC 2023) - WHC, pages 711–720.
Malik, M., Bigger, J. T., Camm, A. J., Kleiger, R. E.,
Malliani, A., Moss, A. J., and Schwartz, P. J. (1996).
Heart rate variability: Standards of measurement,
physiological interpretation, and clinical use. Euro-
pean Heart Journal, 17(3):354–381.
Martin, K., Meeusen, R., Thompson, K. G., Keegan, R.,
and Rattray, B. (2018). Mental fatigue impairs en-
durance performance: A physiological explanation.
Sports Medicine, 48(9):2041–2051.
Melliti, N., Zarrouk, F., and Souissi, N. (2016). Motiva-
tion expectations and motivational styles adopted by
the physical education teacher towards his students:
A study in a natural context of teaching and learning.
Creative Education, 07(15):2226–2250.
Moradi, J., Bahrami, A., and Dana, A. (2020). Motivation
for participation in sports based on athletes in team
and individual sports. Physical Culture and Sport.
Studies and Research, 85(1):14–21.
Morici, G., Gruttad’Auria, C. I., Baiamonte, P., Mazzuca,
E., Castrogiovanni, A., and Bonsignore, M. R. (2016).
Endurance training: Is it bad for&you?; Breathe,
12(2):140–147.
Pagani, M., Lombardi, F., Guzzetti, S., Rimoldi, O.,
Furlan, R., Pizzinelli, P., Sandrone, G., Malfatto, G.,
Dell’Orto, S., and Piccaluga, E. (1986). Power spec-
tral analysis of heart rate and arterial pressure vari-
abilities as a marker of sympatho-vagal interaction
in man and conscious dog. Circulation Research,
59(2):178–193.
Paulus, J., M
¨
uller, M., and Klapuri, A. (2010). State of
the art report: Audio-based music structure analysis.
pages 625–636.
Reaz, M. B., Hussain, M. S., and Mohd-Yasin, F. (2006).
Techniques of emg signal analysis: Detection, pro-
cessing, classification and applications. Biological
Procedures Online, 8(1):11–35.
Rodrigues, J., Liu, H., Folgado, D., Belo, D., Schultz,
T., and Gamboa, H. (2022). Feature-based informa-
tion retrieval of multimodal biosignals with a self-
similarity matrix: Focus on automatic segmentation.
Biosensors, 12(12):1182.
Ryan, R. M., Lynch, M. F., Vansteenkiste, M., and Deci,
E. L. (2010). Motivation and autonomy in counseling,
psychotherapy, and behavior change: A look at the-
ory and practice 1ψ7. The Counseling Psychologist,
39(2):193–260.
Santos, A., Rodrigues, J., Folgado, D., Santos, S., Fuj
˜
ao,
C., and Gamboa, H. (2021). Self-similarity matrix
of morphological features for motion data analysis in
manufacturing scenarios. Proceedings of the 14th In-
ternational Joint Conference on Biomedical Engineer-
ing Systems and Technologies.
Shaffer, F. and Ginsberg, J. P. (2017). An overview of heart
rate variability metrics and norms. Frontiers in Public
Health, 5.
Shi, W., Zhou, C., Zhang, Y., Li, K., Ren, X., Liu, H., and
Ye, X. (2023). Hybrid modeling on reconstitution of
continuous arterial blood pressure using finger photo-
plethysmography. Biomedical Signal Processing and
Control, 85:104972.
Taylor, I. M., Boat, R., and Murphy, S. L. (2018). Integrat-
ing theories of self-control and motivation to advance
endurance performance. International Review of Sport
and Exercise Psychology, 13(1):1–20.
Tiwari, R., Kumar, R., Malik, S., Raj, T., and Kumar, P.
(2021). Analysis of heart rate variability and implica-
tion of different factors on heart rate variability. Cur-
rent Cardiology Reviews, 17(5).
Veldanda, A., Liu, H., Koschke, R., Schultz, T., and K
¨
uster,
D. (2024). Can electromyography alone reveal facial
action units? a pilot emg-based action unit recogni-
tion study with real-time validation. In BIODEVICES
2024 — 17th International Conference on Biomedical
Electronics and Devices. INSTICC, SciTePress.
Wang, H., Li, K., Liu, H., Ye, X., and Zhou, C. (2024).
Comfort assessment method of eeg-based exoskele-
ton walkingassistive device. In BIOSIGNALS 2024
— 17th International Conference on Bio-Inspired Sys-
tems and Signal Processing. INSTICC, SciTePress.
Weiss, M. R. and Williams, L. (2004). The Why of Youth
Sport Involvement: A Developmental Perspective on
Motivational Processes., page 223–268. Fitness In-
formation Technology.
Wu, C., Huang, Y., and Hwang, J. (2015). Review of af-
fective computing in education/learning: Trends and
challenges. British Journal of Educational Technol-
ogy, 47(6):1304–1323.
Really Can’t Hold On Anymore? Physiological Indicators Versus Self-Reported Motivation Drop During Jogging
831
