
Sign Language Recognition Based on Subspace Representations in the
Spatio-Temporal Frequency Domain
Ryota Sato
1
, Suzana Rita Alves Beleza
1 a
, Erica K. Shimomoto
2 b
, Matheus Silva de Lima
1
,
Nobuko Kato
3 c
and Kazuhiro Fukui
1 d
1
University of Tsukuba, Department of Computer Science, Tsukuba, Ibaraki, Japan
2
National Institute of Advanced Industrial Science and Technology (AIST), Tokyo, Japan
3
Tsukuba University of Technology, Faculty of Industrial Technology, Tsukuba, Ibaraki, Japan
Keywords:
Sign Language Recognition, 3D Fast Fourier Transform, Product Grassmann Manifold, Subspace-Based
Methods.
Abstract:
This paper proposes a subspace-based method for sign language recognition in videos. Typical subspace-based
methods represent a video as a low-dimensional subspace generated by applying principal component analysis
(PCA) to a set of images from the video. Such representation is compact and practical for motion recognition
under few learning data. However, given the complex motion and structure in sign languages, subspace-based
methods need to improve performance as they do not consider temporal information like the order of frames.
To address this issue, we propose processing time-domain information on the frequency-domain by applying
the three-dimensional fast Fourier transform (3D-FFT) to sign videos, where a sign video is represented as a
3D amplitude spectrum tensor, which is invariant to deviations in the spatial and temporal directions of target
objects. Further, a 3D amplitude spectral tensor is regarded as one point on the Product Grassmann Manifold
(PGM). By unfolding the tensor in all three dimensions, PGM can account for the temporal information.
Finally, we calculate video similarity by using the distances between two corresponding points on the PGM.
The effectiveness of the proposed method is demonstrated on private and public sign language recognition
datasets, showing a significant performance improvement over conventional subspace-based methods.
1 INTRODUCTION
Sign languages consist of visual and movement-based
languages primarily used by deaf and hard-of-hearing
communities worldwide. As with any language, they
have a rich grammatical structure and allow the com-
munication of complex information. However, sign
languages are often restricted to being used within
these minority groups and are not widely spoken by
the average member of society. This restriction intro-
duces a significant challenge in integrating deaf and
hard-of-hearing individuals into public systems.
Developing sign language recognition systems is
an essential step towards overcoming this challenge.
Since sign languages are primarily visual-based, the
task of sign language recognition is often seen as a
task in action recognition. In this context, several
methods have been proposed to solve action recog-
nition, using classical methods, such as the subspace-
a
https://orcid.org/0000-0003-3200-8501
b
https://orcid.org/0000-0001-7838-8285
c
https://orcid.org/0000-0003-0657-6740
d
https://orcid.org/0000-0002-4201-1096
based methods (Tanaka et al., 2016; Peris and Fukui,
2012), and deep learning methods, such as (Tufek
et al., 2019; Jaouedi et al., 2020).
Subspace-based methods are attractive due to their
robustness in performance and require low computa-
tional resources, being suitable for embedded appli-
cations. They have also been shown to achieve good
performance using few data. This situation is typi-
cal in sign language recognition, where datasets are
scarce. Such methods represent videos as linear sub-
spaces modeled by applying the principal components
analysis (PCA) to the set of the video’s frames. This
representation is invariant to operating speed changes,
i.e., the same action performed at different speeds
will lead to similar subspace representations. Thus, a
typical subspace can represent simple human actions,
such as gait (Iwashita et al., 2015; Iwashita et al.,
2017; Sakai et al., 2019).
However, since each frame does not explicitly
carry temporal information, PCA by itself cannot ac-
count for the order of the frames. Therefore, they may
not be suitable for complex human actions such as
sign language.
152
Sato, R., Beleza, S., Shimomoto, E., Silva de Lima, M., Kato, N. and Fukui, K.
Sign Language Recognition Based on Subspace Representations in the Spatio-Temporal Frequency Domain.
DOI: 10.5220/0012577000003654
Paper published under CC license (CC BY-NC-ND 4.0)
In Proceedings of the 13th International Conference on Pattern Recognition Applications and Methods (ICPRAM 2024), pages 152-159
ISBN: 978-989-758-684-2; ISSN: 2184-4313
Proceedings Copyright © 2024 by SCITEPRESS – Science and Technology Publications, Lda.
!"#$$%
&'()* +,-.)/
012
012
012
!"3-.45'67()3
/4)86,7.36)9/*,
:7;/4-8)
:7;/4-8)
:7;/4-8)
:5'8)3'93!3
(',)86'*9/
! " # " $
!
!"
#
#!
"
#"
!
!"#
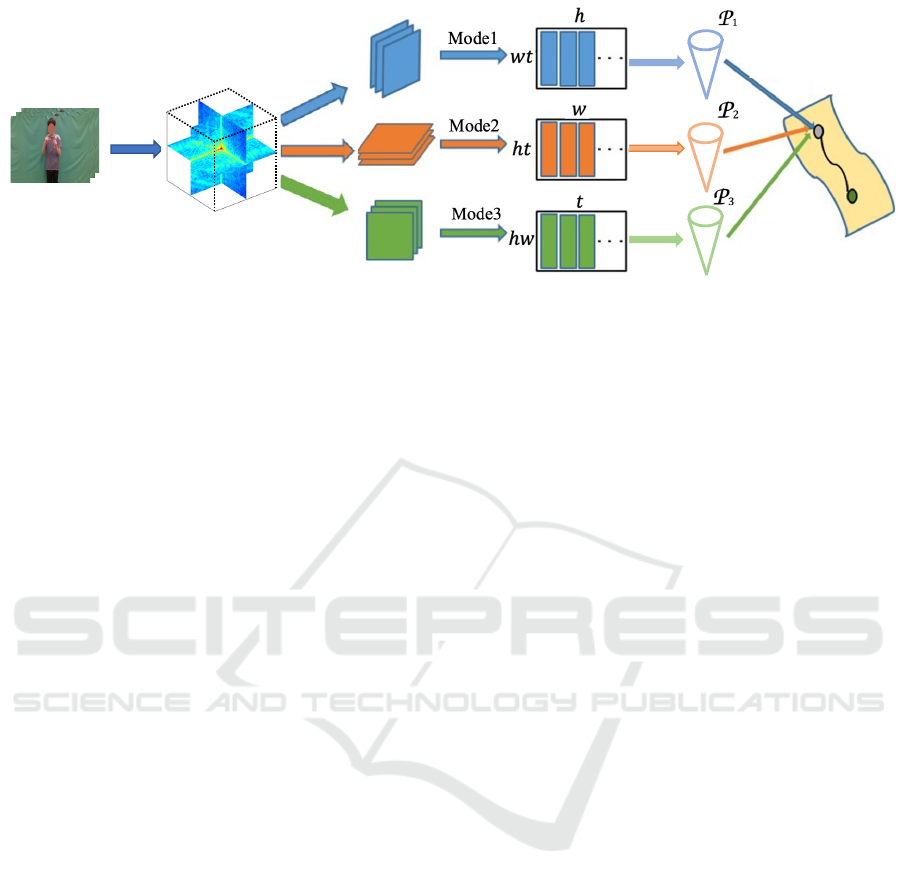
Figure 1: Overview of our method. We generate a 3D amplitude spectrum tensor A ∈ R
h×w×t
from set of frames of the input
video {V
i
}
t
i=1
∈ R
h×w
by applying the 3D-FFT. This 3D tensor is unfolded along the three dimensions resulting in the set
of modes A = {A
A
A
1
∈ R
(wt)×h
, A
A
A
2
∈ R
(ht)×w
, A
A
A
3
∈ R
(wh)×t
}. Then, we apply PCA to each mode matrix, resulting in three
mode subspaces {P
j
}
3
j=1
. Finally, the 3D tensor is regarded as a single point on the product Grassmann manifold (PGM).
The similarity between two 3D tensors is calculated as the distance between two corresponding points on the PGM.
Other subspace representations have been pro-
posed to overcome such naive subspaces’ lack of time
representation. For example, the randomized time
warping (RTW) (Suryanto et al., 2016) can flexibly
represent such changes in speed by representing a
video as a subspace from its time-elastic features. The
RTW-based subspace is robust against internal varia-
tions in the video data. However, RTW requires con-
catenating feature vectors to account for temporal or-
dering. This operation leads to a significant increase
in memory consumption when high-dimensional fea-
ture vectors are used. As another example, slow fea-
ture subspace (SFS) (Beleza et al., 2023) generated by
applying the Slow Feature Analysis (SFA) (Wiskott
and Sejnowski, 2002) to a video can also handle the
issue by selectively extracting slow temporal features.
However, two new hyper-parameters need to be con-
sidered to generate the SFS. They can be set to a fixed
number, but extra experiments are needed to deter-
mine their values.
We propose an effective method based on the
three-dimensional fast Fourier transform (3D-FFT),
where each video is represented as a 3D tensor. Fig-
ure 1 shows a conceptual diagram of the proposed
method. Our method has been motivated by the posi-
tion invariance of 2D-FFT (Modler and Myatt, 2007;
Mahbub et al., 2013) in image recognition. The 3D
amplitude spectral tensor is invariant to spatial and
temporal shifts, so the proposed method is robust to
hand motion shifts.
By representing videos as 3D tensors, we con-
vert the problem of measuring the similarity between
two videos to measuring the similarity between the
3D amplitude spectrum tensors of the spatio-temporal
spectrum of the videos in the frequency domain. One
could simply vectorize the tensors and perform cosine
similarity; however, this approach could lead to loss
of the data structure within the tensors.
To avoid this issue, we apply the product Grass-
mann manifold (PGM) (Lui, 2012; Lui et al., 2010;
Batalo et al., 2022) that can effectively compare and
classify multiple 3D tensors. In our setting, we gen-
erate three subspaces from the unfolded vectors of
the modes of the 3D tensor using PCA, where sub-
spaces for each mode lie in a different Grassmann
manifold (Wong, 1967). PGM is then defined as the
Cartesian product space of each mode’s correspond-
ing manifold. While PGM also uses PCA, due to
the unfolding operation in all three directions, re-
sulting unfolded vectors still carry temporal informa-
tion, making this subspace representation aware of the
frame orders.
Comparison between two 3D tensors is possible
by measuring the geodesic distance between their two
respective representations in PGM. Such similarity
measure relies on the subspace similarity (Yamaguchi
et al., 1998; Fukui, 2014; Fukui and Maki, 2015) and
can account for the unique structure present in each
mode.
Unlike other subspace representations, the pro-
posed method does not require the concatenation of
feature vectors or additional experiments to determine
parameters. Therefore, the proposed method can ef-
ficiently represent subspaces with a small computa-
tional cost.
The effectiveness of the proposed method is eval-
uated on two datasets: Tsukuba New Signs Dataset
(TNSD) that we created for this research and the
Chinese Sign Language Dataset (CSLD) (Liu et al.,
2016), showing significant improvement in perfor-
mance against the conventional subspace-based meth-
ods.
Sign Language Recognition Based on Subspace Representations in the Spatio-Temporal Frequency Domain
153
The rest of the paper is organized as follows. In
Section 2, we formulate the problem of sign language
recognition and describe our method. In Section
3, we demonstrate the effectiveness of our method
through experimental evaluation on private and public
sign language datasets. Finally, Section 4 concludes
the paper.
2 PROPOSED METHOD
In this section, we describe our method for sign lan-
guage recognition. We formulate the sign recognition
task as follows: Let {(v
i
, y
i
)}
n
i=1
be a set of n reference
videos of hand signs from sign languages. Each video
v
i
is paired with a respective label y
i
corresponding
to its class, which describes the meaning of the hand
sign. Given an input video v
in
, the goal is to correctly
classify it into the corresponding class.
In the following, we first explain our basic video
representation, obtained using 3D-FFT. Then, we
elaborate on how to compare the obtained 3D ampli-
tude tensors using the product Grassmann manifold.
Finally, we describe the identification framework for
sign language recognition using our method.
2.1 3D-FFT Based Video
Representation
To effectively capture complex internal variations in
videos, we propose representing them as 3D ampli-
tude spectrum tensors in the frequency domain by ap-
plying the 3D-FFT. Our motivation comes from the
object position invariance property of 2D amplitude
spectrum image obtained with 2D-FFT. 3D ampli-
tude spectrum tensors obtained from the 3D-FFT are
invariant not only to changes in space, but also to
changes in time. This property is depicted in Figure 2.
Therefore, in our method, we apply the 3D-FFT
to each video v
i
, defined as a set of video frames
{ f
i j
}
t
j=1
, f
i j
∈ R
h×w
, resulting in a 3D amplitude
spectrum A
i
∈ R
h×w×t
.
2.2 Product Grassmann Manifold
In sign language recognition, it is necessary to com-
pare 3D amplitude tensors effectively. In this com-
parison, it is essential to consider the data structure
within the tensor and keep the computational cost rea-
sonable, as larger tensors lead to an increase in mem-
ory consumption.
In this context, we incorporate the concept of the
product Grassmann manifold (PGM) (Lui, 2012; Lui
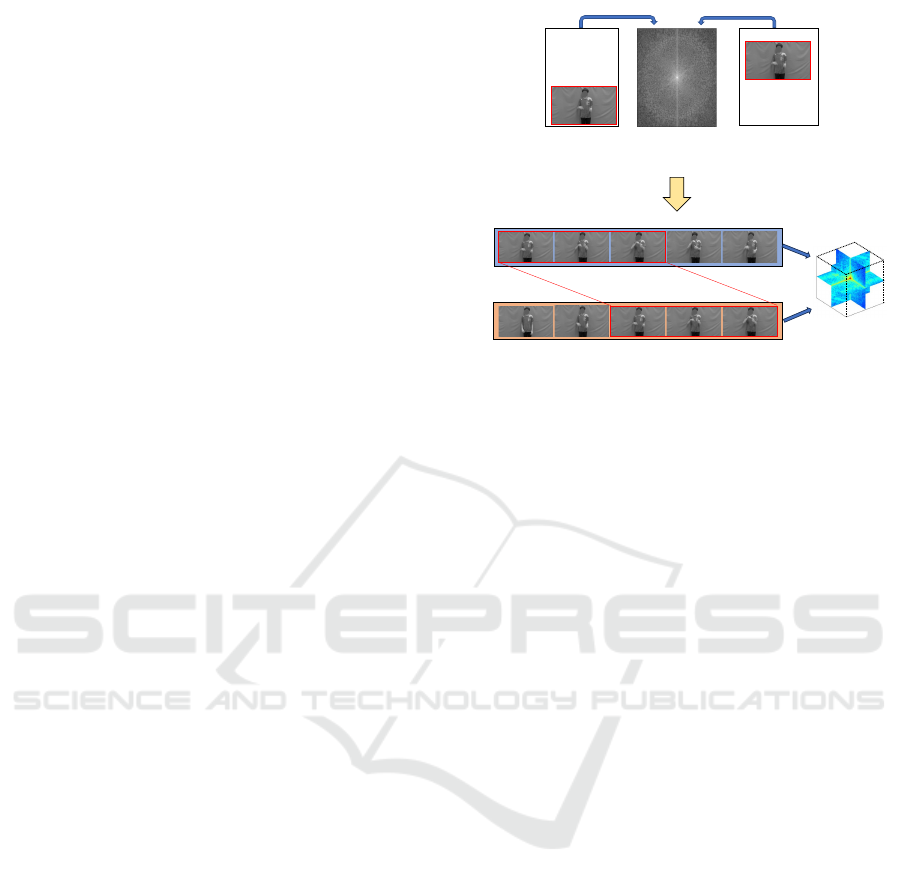
!"#$$%
!"&'"
!"#$$%
'"#$$%
'"()*+,-./01(
2+13.4/*(.15264
!"()*+,-./01(
2+13.4/*(-*)71
Figure 2: Process of 3D-FTT. Just as the 2D amplitude
spectrum image obtained from 2D-FFT is the same between
images of the same object in different positions, applying
3D-FFT to videos that perform similar motion yields a sim-
ilar 3D amplitude spectrum tensor.
et al., 2010) in our method. PGM is defined as the
space of products of multiple Grassmann manifolds
and is a way to effectively represent tensors that hold
multiple dimensions or modes as a single data set.
Let A ∈ R
h×w×t
be a 3D amplitude spectrum video
tensor, where h, w, and t denote height, width, and
number of frames, respectively. Unfolding this tensor
along each dimension generates a set of mode matri-
ces A = {A
A
A
1
∈ R
(wt)×h
, A
A
A
2
∈ R
(ht)×w
, A
A
A
3
∈ R
(hw)×t
},
where each sliced matrix retains distinctive features
along its direction.
Then, we apply PCA to each mode matrix to com-
pactly represent them as low-dimensional subspaces
{S
j
}
3
j=1
, with dimension m
j
in a d
j
-dimensional
space. Formally, each subspace is represented as a
matrix S
S
S
j
∈ R
d
j
×m
j
, which has the orthonormal basis
vectors of the subspace as its column vectors.
While the subspaces in PGM are also modeled
through simple PCA, the unfolded vectors in modes 1
and 2, along the directions of the height and width of
the video frames, contain temporal information and,
therefore, the representation on PGM can compactly
account for the order of the frames.
Each subspace S
j
is a point on the Grassmann
manifold M
j
(m
j
, d
j
). A unified representation is con-
structed on product Grassmann manifold from a set of
factor manifolds {M
j
}
3
j=1
as follows:
M = M
1
× M
2
× M
3
= (S
1
, S
2
, S
3
), (1)
where × denotes Cartesian product. Consequently,
each tensor is represented as a single point on M.
Comparison on the PGM M is possible by mea-
suring the geodesic distance between two points on
M. Given the tensors X and Y , represented by sets
ICPRAM 2024 - 13th International Conference on Pattern Recognition Applications and Methods
154
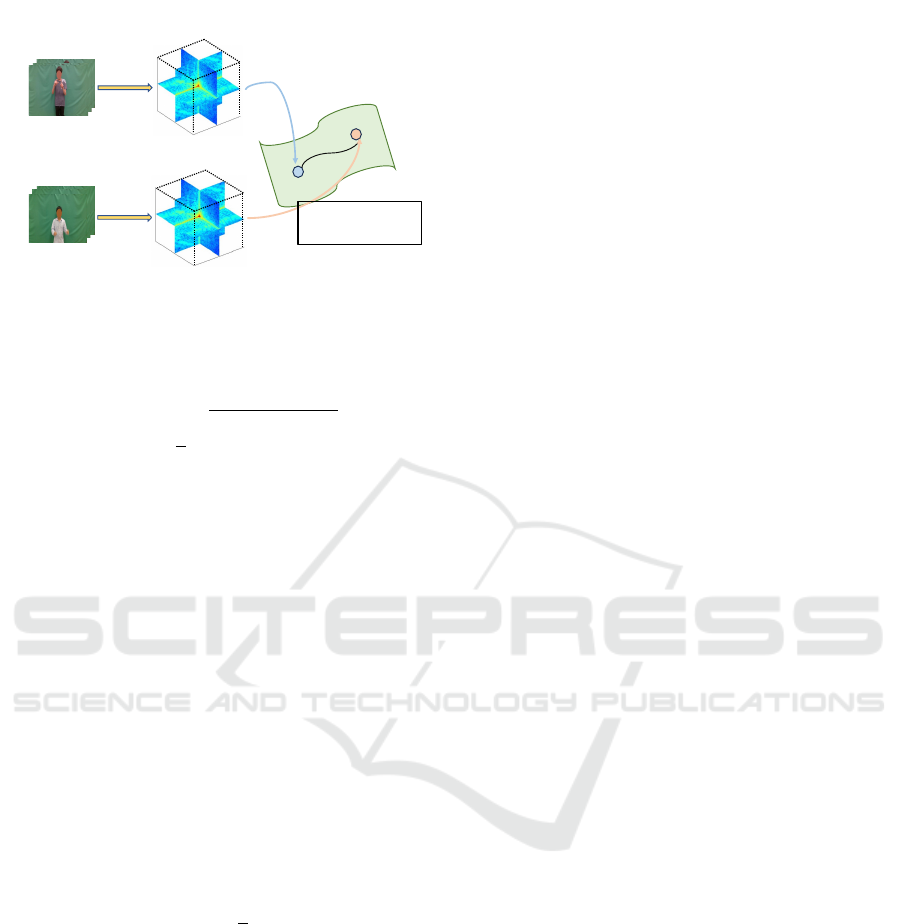
!"#$% &'()$*
+,-./01"#$%0&'()$*
!"#$$%
!"#$$%
234
560()-7"/.#$0
*-$8/'.)0/$,*%'
9(78.7(/$0
:$%#$*"80#"*/(,8$0
Figure 3: Conceptual figure of comparison between two 3D
amplitude tensors on PGM. Each tensor is represented as a
point on the PGM.
of subspaces {P
j
}
3
j=1
and {Q
j
}
3
j=1
, the similarity be-
tween them is defined as follows:
ρ(X , Y ) =
1
3
v
u
u
t
3
∑
j=1
sim(P
j
, Q
j
)
2
, (2)
where sim(P
j
, Q
j
) denotes the structual similarity be-
tween subspaces P
j
and Q
j
.
The similarity sim(P
j
, Q
j
) can be measured with
the canonical angles {θ} between them in the mu-
tual subspace method (MSM) framework (Yamaguchi
et al., 1998; Fukui, 2014; Fukui and Maki, 2015).
Within the PGM context, this similarity allows the
comparison between tensor modes while considering
the unique structure information contained in each
mode.
Let P
P
P ∈ R
d×m
p
and Q
Q
Q ∈ R
d×m
q
be the orthonormal
basis vectors of the two subspaces P and Q , with m
p
and m
q
dimensions respectively, and m
p
≤ m
q
. We
first calculate the SVD P
P
P
⊤
Q
Q
Q = U
U
UΣ
Σ
ΣV
V
V
⊤
, where Σ
Σ
Σ =
diag(κ
1
, . . . , κ
i
), {κ
i
}
m
p
i=1
represents the set of singular
values(=cos θ
i
), and κ
1
≥ . . . ≥ κ
m
p
. The similarity
can then be calculated as follows:
sim(P , Q ) =
1
r
r
∑
i=1
κ
2
i
, (3)
where 1 ≤ r ≤ m
p
.
The representation of the 3D amplitude tensors on
PGM allows their comparison without compromising
their essential structural information. This process is
depicted in Figure 3.
2.3 Algorithm for Sign Recognition
In this section, we describe the identification frame-
work for sign language recognition using the pro-
posed method, shown in Figure 4. Given a set of n
training examples {(v
i
, y
i
)}
n
i=1
, where each video v
i
is
paired with a respective label y
i
∈ C which describes
the meaning of the hand sign, We perform recognition
of a given input video v
in
, according to the following
phases:
In the training phase, there are three steps:
1. For each training video v
i
, apply 3D-FFT to obtain
the 3D amplitude spectrum tensors {A
i
}
n
i=1
.
2. Unfold each tensor along the three dimen-
sions, resulting in the sets of mode matrices
{A
A
A
i
1
, A
A
A
i
2
, A
A
A
i
3
, }
n
i=1
.
3. Apply PCA to each mode matrix, yielding one set
of subspaces {S
n
1
, S
n
2
, S
n
3
} for each video, where
each mode subspace S
n
j
lies in the manifold M
j
.
Next, the recognition phase consists of the following
four steps:
1. Apply 3D-FFT to the input video v
in
to generate
an 3D amplitude spectrum tensor A
in
.
2. Unfold the obtained tensor in all three directions,
obtaining the set of mode matrices {A
A
A
in
1
, A
A
A
in
2
, A
A
A
in
3
}.
3. Apply PCA to each mode matrix, yielding the set
of input subspaces {S
in
1
, S
in
2
, S
in
3
}.
4. Calculate the similarity between the input video
and each training video in the PGM using Equa-
tion 2. The class of the most similar training video
is considered the identification result.
3 EVALUATION
This section compares our results to baseline methods
in our new Tsukuba New Signs Dataset (TNSD) and
Chinese Sign Language Dataset (CSLD) (Liu et al.,
2016). We evaluated the performance of the meth-
ods on the action recognition task using video frames
without pre-processing (i.e., raw images) and CNN
features.
3.1 Baseline Methods
We consider recent baseline methods that propose
different subspace types to represent video temporal
data. As they are all subspace-based methods, they
use the subspace similarity defined in Equation 3 to
perform recognition. In the following, we briefly ex-
plain each one and refer the reader to the original pa-
pers for details.
PCA: The subspace is obtained by applying PCA di-
rectly to the video data. Therefore, no time repre-
sentation is considered.
RTW (Suryanto et al., 2016): features are ran-
domly sampled from multiple video frames
Sign Language Recognition Based on Subspace Representations in the Spatio-Temporal Frequency Domain
155
!!!
!!!
!!!
!"#$%#"&'(&)'(*+,+#"-+&.(/'&0''1(
*%/*2"$'*(+1 '"$)(,34'
!"#$%&'('$&)*+,"-)$&
+."/+%"),'0'1+/'(2)
!
!
!
!
!
!
!
!
!
534'6 534'7 534'8
Figure 4: The overview of the proposed framework. It consists of two phases: 1) In the training phase, a 3D amplitude tensor
A
i
in the training set is obtained by applying the 3D-FFT. Each tensor is unfolded into three mode matrices {A
A
A
j
}
3
j=1
. PCA is
applied to each mode matrix yielding one set of subspaces {S
n
1
, S
n
2
, S
n
3
} for each video, where each mode subspace S
n
j
lies in
the manifold M
j
.; 2) In the recognition phase, we apply the 3D-FFT to the input video v
in
, obtaining its 3D tensor A
in
. This
tensor is unfolded into three mode matrices, which are modeled as mode subspaces {S
in
1
, S
in
2
, S
in
3
} by PCA. Recognition is
then performed based on the geodesic distance on the PGM.
while maintaining the original temporal order.
By applying PCA to this feature set, a compact
subspace that considers sequential information is
computed.
Slow Feature Subspace (SFS) (Beleza et al., 2023):
This subspace is obtained by applying PCA to the
weight vectors extracted from the video data by
the slow feature analysis (SFA). Thus, the SFS
can represent the video characteristics with slow
temporal variation and is considered robust to
temporal fluctuations and noise.
3D-FFT: the subspace is obtained by applying 3D-
FFT to the input data.
CNN+baseline: We also compare our results to the
baseline methods using CNN features. In this ap-
proach, we first extract the CNN features of each
video using a VGG19 model pre-trained on Ima-
geNet
1
and then build the subspace as previously
explained in each baseline method.
3.2 Datasets
In our experiments, we used two different datasets:
Tsukuba New Signs Dataset. We created a new
dataset, called Tsukuba New Signs Dataset (TNSD),
for this research. TNSD consists of 31 signs cap-
tured from nine Japanese sign language native indi-
viduals in a controlled environment. These signs in-
clude terms from the IT area considered common to
daily use by the Japan Institute for Sign Language
Studies. In this dataset, the individuals performed
1
https://www.robots.ox.ac.uk/
∼
vgg/research/very dee
p/
ICPRAM 2024 - 13th International Conference on Pattern Recognition Applications and Methods
156
!"#$%&'
()*+,
-)./
0,1'.,'1
2#+&
!"3'&
47
67(
-'8
933):,1
Figure 5: Examples of the Tsukuba New Signs Dataset.
each sign three times, generating a total of 837 short
videos (=9 subjects×31 classes×3 shots). All videos
have the same structure, starting with the individ-
ual’s arms lowered, followed by a sign, and then their
arms lowered again. The fps of each video is 30,
and the number of frames ranges from 40 to 144.
Therefore, the dimension {d
j
}
3
j=1
of each mode is
{72 × 40, 128 × 40, 72 × 128}. For videos with more
than 40 frames, the first 40 frames of the amplitude
spectral tensor are extracted. A dataset sample can be
seen in Figure 5.
This dataset contains three types of data: Un-
masked, where the face of the subjects is visible; eye-
masked, where the eye region is masked; and face-
masked, where the whole face is masked. We pro-
cessed the videos by converting them into gray-scale
images with dimensions of 72×128 pixels.
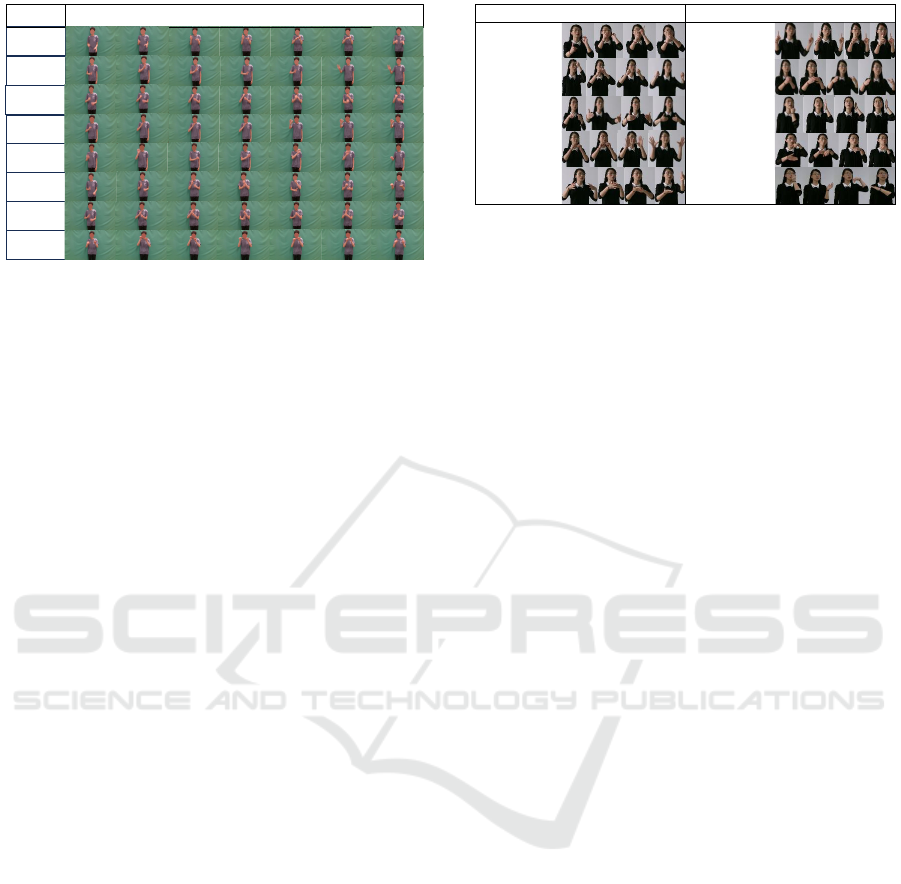
Chinese Sign Language Dataset. The Chinese
Sign Language Dataset (CSLD) (Liu et al., 2016) con-
sists of 500 different Chinese Sign Languages, per-
formed by 50 subjects in each class, amounting to
25,000 videos. Each video consists of 50 frames.
In the experiment, 10 signs were randomly sampled
from the entire dataset to create a subset of 500
videos. Figure 6 shows a sample of the CSLD.
3.3 Experiments on TNSD
For this dataset, we ran experiments with all three
types of data, i.e., unmasked, eye-masked and face-
masked to assess the influence of masking in our
framework’s performance. Furthermore, we consid-
ered two different experimental settings, described in
the following:
Experimental Setting 1. We considered the same
subjects for training and testing. Since there are three
videos for each class, one was used as training data
and two as test data. We consider 3-fold cross vali-
Goal
Clue
Development
Composition
Short
Swell
Brother
Grandmother
Soda
Class Example Class Example
Tag
1
2
3
4
5
Tag
6
7
8
9
10
Public welfare
Figure 6: Examples of Chinese Sign Language dataset. Fig-
ure taken from (Beleza and Fukui, 2021).
dation and report the average accuracy and the macro
F1-score obtained across all folds. The same process
was performed by swapping the training and test data
to reduce the influence of data bias. Across all of the
experiments, we set the dimension m of the subspaces
to 10. The value of r in Eq.(3) also was set to 10.
Experimental Setting 2. To understand how much
the subjects’ face influence in the sign recognition re-
sult, we chose eight subjects for training data and one
subject for test data. To generate the reference sub-
spaces in the training phase, we randomly selected
one video from each individual. For the recognition
phase, we performed classification on the three videos
performed by each test individual. We performed 9-
fold cross validation by rotating the subjects in each
fold and report the average accuracy and the macro
F1-score obtained in these folds. We set the dimen-
sion m of the subspaces for all the experiments to 10.
The value of r also was set to 10.
Results and Discussions. Results for both experi-
mental settings are shown in Table 1 and Table 2.
Our method consistently outperformed all other ap-
proaches, except for the masked-eye region in setting
1, where PCA performed the best. This result indi-
cates that hand occlusion, which happens when the
hand overlaps the masked region, will likely not af-
fect the performance of any of the methods.
In setting 2, involving different subjects, our
method demonstrated significantly higher perfor-
mance than other methods, achieving over twice the
accuracy and F1-score of methods that did not apply
3D-FFT. This result highlights the effectiveness of an-
alyzing videos in the frequency domain and extract-
ing only the amplitude spectrum as a robust feature
in handling temporal variations. Moreover, the inte-
gration of PGM with 3D-FFT in our method resulted
in a 7.2% accuracy improvement compared to solely
applying 3D-FFT. This result indicates that PGM can
preserve essential information and avoid the loss of
temporal information in the tensor structure.
Sign Language Recognition Based on Subspace Representations in the Spatio-Temporal Frequency Domain
157

Table 1: TNSL Dataset experimental results. We report the
recognition accuracy (%) in both settings. The best results
for each type of data in each setting are highlighted in bold.
Method
Accuracy (%)
Raw Eye Face Average
PCA 88.7 ± 9.3 88.9 ± 9.5 88.9 ± 9.5 88.8 ± 9.4
RTW 86.9 ± 8.9 85.8 ± 9.5 86.4 ± 8.8 86.4 ± 9.1
Setting 1 SFS 88.7 ± 8.8 88.7 ± 8.9 89.3 ± 9.0 88.9 ± 8.9
3D-FFT 88.7 ± 10.3 88.0 ± 10.1 88.0 ± 10.2 88.2 ± 10.2
Ours 89.8 ± 8.6 88.7 ± 9.2 90.1 ± 7.9 89.5 ± 8.6
PCA 12.2 ± 5.6 12.1 ± 6.3 11.5 ± 6.5 11.9 ± 6.1
RTW 11.2 ± 6.1 11.6 ± 4.9 10.6 ± 5.4 11.1 ± 5.5
Setting 2 SFS 12.7 ± 4.9 12.7 ± 5.2 12.7 ± 5.5 12.7 ± 5.2
3D-FFT 22.0 ± 11.7 23.1 ± 12.0 22.6 ± 11.8 22.6 ± 11.8
Ours 30.2 ± 14.3 29.8 ± 14.5 29.3 ± 13.8 29.8 ± 14.2
Table 2: TNSL Dataset experimental results. We report the
macro F1-score (%) in both settings. The best results for
each type of data in each setting are highlighted in bold.
Method
Macro F1-score (%)
Raw Eye Face Average
PCA 88.8 89.1 89.1 89.0
RTW 87.1 87.0 86.8 87.0
Setting 1 SFS 88.9 88.9 89.5 89.1
3D-FFT 88.8 88.1 88.2 88.4
Ours 90.0 88.9 90.3 89.7
PCA 11.4 11.3 10.7 11.1
RTW 11.3 11.2 11.3 11.3
Setting 2 SFS 12.1 12.2 12.1 12.1
3D-FFT 21.1 21.3 20.7 21.0
Ours 30.2 30.0 29.2 29.8
Furthermore, the large difference in results from
setting 1 and setting 2 indicates that most methods
rely on subject-specific characteristics for recogni-
tion. While our method still faced a decrease in per-
formance in setting 1, the gap was smaller than the
other methods.
In addition, while there is the possibility of data
imbalance, as there are differences in the number of
frames per class in this dataset, we observe a differ-
ence between the accuracy and F1-score values, indi-
cating that the learning is equally distributed among
all the methods.
3.4 Experiments on CSLD
Experimental Setting. In this dataset, each gray-
scale video was resized to 38×24 pixels. Therefore,
the dimension {d
j
}
3
j=1
of each mode is {38×50, 24×
50, 38 × 24}, respectively. Furthermore, out of the
500 videos, 300 were considered as the training set,
100 as the validation set, and 100 as the test set. We
performed 10-fold cross-validation and reported the
average accuracy and the macro F1-score across all
folds.
In addition, we also performed experiments us-
ing CNN features from the pre-trained VGG19 (Si-
Table 3: CSL Dataset experimental results. We report the
recognition accuracy (%) on the baseline methods with raw
features and CNN features, and compare with our method.
As the data form of the CNN features is not a 3D tensor,
we report only results with raw features on methods using
3D-FFT. The best performance is highlighted in bold.
Method
Accuracy (%)
Raw CNN
PCA 49.0 ± 4.2 54.5 ± 4.2
RTW 47.4 ± 4.0 60.8 ± 1.5
SFS 47.4 ± 5.0 57.5 ± 3.9
3D-FFT 59.5 ± 5.5 -
Ours 72.2 ± 8.2 -
Table 4: CSL Dataset experimental results. We report the
macro F1-score (%) on the baseline methods with raw fea-
tures and CNN features, and compare with our method. As
the data form of the CNN features is not a 3D tensor, we
report only results with raw features on methods using 3D-
FFT. The best performance is highlighted in bold.
Method
Macro F1-score (%)
Raw CNN
PCA 49.3 53.4
RTW 47.7 60.7
SFS 47.6 56.1
3D-FFT 59.5 -
Ours 71.7 -
monyan and Zisserman, 2014) specified in Sec-
tion 3.1. We extracted the features after the global
mean pooling for the fifth hidden layer of VGG-19,
resulting in a vector of 512 dimensions to each frame.
Therefore, we hypothesize that these features include
local information from each sign and should improve
results. The obtained features are represented in their
respective subspace representations and are classified
using MSM-based methods. We varied the subspace
m from 2 to 10 with interval of 2 and performed
the test using the hyper-parameters that obtained the
highest classification accuracy in the validation set.
In this case, since the CNN features are vectors, we
cannot apply 3D-FFT to them.
Results and Discussion. Results for this dataset can
be found in Table 3 and Table 4. We can see that
our method outperforms all other methods, including
the ones using CNN features. This result shows that
although CNNs can generate discriminative features,
they are extracted without considering any relation-
ship between frames and thus fail to capture complex
movements such as sign languages. our method can
account for temporal information and thus can obtain
a higher accuracy rate than CNN-based classification
methods. There is small difference in the accuracy
and macro F1-score for any of the methods, indicat-
ing that the learning is consistent in all classes.
ICPRAM 2024 - 13th International Conference on Pattern Recognition Applications and Methods
158

4 CONCLUSIONS
In this paper, we proposed a new method for sign
language recognition that processes time-domain in-
formation on the frequency-domain by representing
videos as 3D amplitude tensors using the 3D Fast
Fourier Transform (3D-FFT) and effectively compar-
ing them in the Product Grassmann Manifold (PGM).
Focusing only on the amplitude spectrum, we ob-
tain features robust to time deviations. Furthermore,
PGM can effectively represent and compare the ten-
sor structures as subspaces generated from each ten-
sor mode while preserving the temporal information
due to the unfolding operation. Therefore, we estab-
lished a simple yet powerful subspace representation
that considers temporal information. Experimental
results showed that our method can significantly im-
prove performance over other subspace-based meth-
ods. In the future, we are interested in verifying the
efficacy of our method in other action recognition
tasks.
ACKNOWLEDGMENTS
This work was supported by JSPS KAKENHI Grant
Number 21K18481. The authors thank the Tsukuba
University of Technology students for their help in
collecting our TNSD data set.
REFERENCES
Batalo, B., Souza, L. S., Gatto, B. B., Sogi, N., and Fukui,
K. (2022). Temporal-stochastic tensor features for
action recognition. Machine Learning with Applica-
tions, 10:100407.
Beleza, S. R. and Fukui, K. (2021). Slow feature sub-
space for action recognition. In Pattern Recognition.
ICPR International Workshops and Challenges: Vir-
tual Event, January 10–15, 2021, Proceedings, Part
III, pages 702–716.
Beleza, S. R. A., Shimomoto, E. K., Souza, L. S., and
Fukui, K. (2023). Slow feature subspace: A video
representation based on slow feature analysis for ac-
tion recognition. Machine Learning with Applica-
tions, 14:100493.
Fukui, K. (2014). Subspace methods. In Computer Vision,
A Reference Guide, pages 777–781.
Fukui, K. and Maki, A. (2015). Difference subspace and
its generalization for subspace-based methods. IEEE
Transactions on Pattern Analysis and Machine Intel-
ligence, 37(11):2164–2177.
Iwashita, Y., Kakeshita, M., Sakano, H., and Kurazume,
R. (2017). Making gait recognition robust to speed
changes using mutual subspace method. In 2017 IEEE
International Conference on Robotics and Automation
(ICRA), pages 2273–2278.
Iwashita, Y., Sakano, H., and Kurazume, R. (2015). Gait
recognition robust to speed transition using mutual
subspace method. In International Conference on Im-
age Analysis and Processing, pages 141–149.
Jaouedi, N., Boujnah, N., and Bouhlel, M. S. (2020). A new
hybrid deep learning model for human action recogni-
tion. Journal of King Saud University-Computer and
Information Sciences, 32(4):447–453.
Liu, T., Zhou, W., and Li, H. (2016). Sign language recog-
nition with long short-term memory. In 2016 IEEE
international conference on image processing (ICIP),
pages 2871–2875.
Lui, Man, Y., Beveridge, Ross, J., Kirby, and Michael
(2010). Action classification on product manifolds.
In 2010 IEEE Computer Society Conference on Com-
puter Vision and Pattern Recognition, pages 833–839.
Lui, Y. M. (2012). Human gesture recognition on prod-
uct manifolds. The Journal of Machine Learning Re-
search, 13(1):3297–3321.
Mahbub, U., Imtiaz, H., Roy, T., Rahman, M. S., and Ahad,
M. A. R. (2013). A template matching approach of
one-shot-learning gesture recognition. Pattern Recog-
nition Letters, 34(15):1780–1788.
Modler, P. and Myatt, T. (2007). Image features based on
two-dimensional fft for gesture analysis and recogni-
tion. SMC07, Leykada, Greece.
Peris, M. and Fukui, K. (2012). Both-hand gesture recogni-
tion based on komsm with volume subspaces for robot
teleoperation. In 2012 IEEE International Conference
on Cyber Technology in Automation, Control, and In-
telligent Systems (CYBER), pages 191–196.
Sakai, A., Sogi, N., and Fukui, K. (2019). Gait recognition
based on constrained mutual subspace method with
cnn features. In 2019 16th international conference
on machine vision applications (MVA), pages 1–6.
Simonyan, K. and Zisserman, A. (2014). Very deep con-
volutional networks for large-scale image recognition.
arXiv preprint arXiv:1409.1556.
Suryanto, C. H., Xue, J.-H., and Fukui, K. (2016). Random-
ized time warping for motion recognition. Image and
Vision Computing, 54:1–11.
Tanaka, S., Okazaki, A., Kato, N., Hino, H., and Fukui,
K. (2016). Spotting fingerspelled words from sign
language video by temporally regularized canonical
component analysis. In 2016 IEEE International Con-
ference on Identity, Security and Behavior Analysis
(ISBA), pages 1–7.
Tufek, N., Yalcin, M., Altintas, M., Kalaoglu, F., Li, Y.,
and Bahadir, S. K. (2019). Human action recognition
using deep learning methods on limited sensory data.
IEEE Sensors Journal, 20(6):3101–3112.
Wiskott, L. and Sejnowski, T. J. (2002). Slow feature anal-
ysis: Unsupervised learning of invariances. Neural
computation, 14(4):715–770.
Wong, Y.-C. (1967). Differential geometry of grassmann
manifolds. Proceedings of the National Academy of
Sciences, 57(3):589–594.
Yamaguchi, O., Fukui, K., and Maeda, K. (1998). Face
recognition using temporal image sequence. In Pro-
ceedings third IEEE international conference on au-
tomatic face and gesture recognition, pages 318–323.
Sign Language Recognition Based on Subspace Representations in the Spatio-Temporal Frequency Domain
159
