
Augmentation of Motor Imagery Data for Brain-Controlled
Robot-Assisted Rehabilitation
Roman Mou
ˇ
cek
1 a
, Jakub Kodera
1
, Pavel Mautner
1 b
and Jaroslav Pr
˚
ucha
2 c
1
Department of Computer Science and Engineering, Faculty of Applied Sciences, University of West Bohemia,
Univerzitn
´
ı 8, Plze
ˇ
n, Czech Republic
2
Department of Information and Communication Technologies in Medicine, Faculty of Biomedical Engineering,
Czech Technical University, n
´
am. S
´
ıtn
´
a 3105, Kladno, Czech Republic
Keywords:
Brain-Computer Interface, Data Augmentation, Deep Learning, Electroencephalography, Motor Imagery,
Robot-Assisted Rehabilitation.
Abstract:
Brain-controlled robot-assisted rehabilitation is a promising approach in healthcare that can potentially and
in parallel improve and partly automate the rehabilitation of motor apparatus and related brain structures
responsible for movement. However, building a real-world rehabilitation system has many challenges and
limitations. One of these challenges is the small size of the data that can be collected from the target group of
people recovering from injured motor functions to train deep learning models recognizing motor imagery pat-
terns. Therefore, the primary experiments with data augmentation and classification results over the collected
and augmented dataset are presented.
1 INTRODUCTION
The further development of robot-assisted rehabili-
tation is a promising way to improve and partially
automate rehabilitation processes, especially for peo-
ple recovering from injured motor functions. In such
cases, a robot helps people with the desired and usu-
ally predefined movement according to the person’s
current movement abilities. Since motor rehabilita-
tion is an issue of the locomotor apparatus and related
brain structures responsible for movement, extending
rehabilitation procedures with brain-controlled robots
seems to be an exciting and promising approach.
Brain-Computer or Brain-Machine Interface (BCI
or BMI) is a direct communication between the hu-
man brain and the outside world (typically com-
puter or external devices). Non-invasive BCIs uti-
lize electroencephalography (EEG) and event-related
potential (ERP) methods and techniques; the scalp-
recorded electrical activity of the human brain is col-
lected and used to control an application or environ-
ment. Current BCI systems and applications rely
on several fundamental paradigms, including detect-
ing the brain frequencies, event-related or evoked
a
https://orcid.org/0000-0002-4665-8946
b
https://orcid.org/0000-0002-3775-0089
c
https://orcid.org/0000-0003-4958-7183
components, (Steady-State) Visual Evoked Potentials
(SSVEPs, VEPs), and Motor Imagery (MI).
MI, a mental process when people imagine per-
forming a physical action without actually executing
it, combined with measuring the related EEG signal,
is considered helpful in retraining neural pathways re-
sponsible for movement. The cortical EEG signal in
the alpha and beta bands exhibits a decrease in the
EEG amplitude during the preparation and execution
of a movement, known as Event-Related Desynchro-
nization (ERD). Simultaneously, Event-Related Syn-
chronization (ERS) represents an increase in the am-
plitude of the EEG cortical signal in the alpha and
beta bands in the resting state.
Of course, considering its potential to operate suc-
cessfully in real-world applications, there are many
challenges and limitations to using the MI paradigm
in BCI research and robot-assisted rehabilitation. It
includes, e.g., the quality and interpretability of the
collected EEG signal, the technology used for collect-
ing BCI data, recognition of MI patterns, use of suit-
able signal processing methods, and lack of data that
can realistically be collected from the target group to
train deep learning models. This paper focuses on the
last issue: the lack of suitable data for training deep
learning models and options to successfully augment
the already collected MI datasets.
812
Mou
ˇ
cek, R., Kodera, J., Mautner, P. and Pr˚ucha, J.
Augmentation of Motor Imagery Data for Brain-Controlled Robot-Assisted Rehabilitation.
DOI: 10.5220/0012575700003657
Paper published under CC license (CC BY-NC-ND 4.0)
In Proceedings of the 17th International Joint Conference on Biomedical Engineering Systems and Technologies (BIOSTEC 2024) - Volume 2, pages 812-819
ISBN: 978-989-758-688-0; ISSN: 2184-4305
Proceedings Copyright © 2024 by SCITEPRESS – Science and Technology Publications, Lda.

The paper is organized as follows. The state-of-
the-art section presents experiments, findings, and re-
views that have been made in research and applica-
tions of robot-assisted and brain-controlled rehabili-
tation; the data augmentation methods and methods
(especially deep learning methods) for EEG signal
(BCI data) analysis are mainly focused. The follow-
ing section, Materials and Methods, introduces read-
ers to the dataset used and data processing and aug-
mentation. The Results section provides the outcomes
related to using augmentation techniques over a spe-
cific MI dataset and classification results using a set of
various classifiers. The Discussion and Conclusions
sections offer ideas about the current results and fu-
ture work.
2 STATE OF THE ART
A survey on robots controlled by MI-BCIs was con-
ducted and described in (Zhang and Wang, 2021)
from several points of view: EEG evocation/BCI
paradigms, signal processing algorithms, and appli-
cations. As a result, various brain-controlled robots
were reviewed (from the perspective of the evo-
cation/BCI paradigms), and relevant algorithms for
EEG signal processing (including feature extraction
methods and classification algorithms) were intro-
duced. The experience with applications of the MI
brain-controlled robots was also summarized.
The authors concluded that MI-BCI technology
was still in the stage of rapid development, and we
still faced troubles in EEG signal processing and
asynchronous control. However, the innovation of
hybrid BCI paradigms can enhance the patient’s par-
ticipation, stimulate the patient’s intention to move,
and improve the efficiency of robot-assisted rehabili-
tation, as well as deep learning can significantly im-
prove the overall performance of the robot system
controlled by MI-BCI (Zhang and Wang, 2021). It is
believed that developing rehabilitation training robots
will effectively help patients recover from injured mo-
tor functions.
The study performed by (Yang et al., 2021) aims
to detect four movements of the left hand, right
hand, tongue, and both feet. Analyzing the data,
they found that MI tasks cause ERD and ERS over
the right and left hemispheres of the motor cortex,
mainly at C4 and C3 electrodes. The Cz electrode
was affected primarily by MI of the feet and tongue.
The measured EEG signal used two-second-long time
windows (epochs) for augmentation. They used a
combination of Conditional Variational Autoencoder
(cVAE) and Generative Adversarial Network (GAN)
as an augmentation method. For all subjects, the
cross-validation metric accuracy was several percent
higher when the generated data were included in the
dataset.
Tang et al. (Tang et al., 2017) used a deep Con-
volutional Neural Network (CNN) to classify single-
trial left- and right-handed MI. They selected a three-
second segment of the signal divided into 50ms win-
dows. CNN showed better results than Support Vec-
tor Machine (SVM) classifier when various feature
extraction methods were used. It achieved an aver-
age classification accuracy of 86.41±0.77%, while the
best result using the SVM classifier (82.61±6.15%)
was achieved with the Common Spatial Pattern (CSP)
feature extraction method.
Abdelfattah et al. (Abdelfattah et al., 2018) ex-
perimented with a recurrent architecture of the Gen-
erative Adversarial Network (GAN) augmentation
method to extend the dataset for MI classification us-
ing the freely available PhysioNet dataset. The results
showed the sensitivity of deep learning-based models
to the size of the training dataset. The classification
accuracy of all classifiers was better when the aug-
mented dataset was used.
In their study, (Zhang et al., 2020) experimented
with various augmentation methods to improve the
classification of CNN for MI detection. They used
two datasets to evaluate the classifiers and augmenta-
tion methods - freely available BCI Competition IV
dataset 1 and BCI Competition IV dataset 2b. A four-
second-long EEG signal (within the duration of MI)
was used for the analysis. The Fr
´
echet Inception Dis-
tance (FID) metric was used to evaluate each aug-
mentation method. All methods except the Geomet-
ric Transformation (GT) improved classification ac-
curacy. The best improvement (12.6%) was achieved
using the convolutional GAN.
When considering more general EEG analysis
based on deep learning, (Roy et al., 2019) conducted a
systematic review of studies published between 2010
and 2018. Most studies (40%) used a (CNN) architec-
ture for classification, 13% used a Recurrent Neural
Network (RNN), another 13% used an Autoencoder
(AE), and 7% used a combination of CNN and RNN.
Only 26% of studies used intra-subject classification,
62% focused on inter-subject classification, and 8%
performed both approaches. It is also interesting that
only 8% of studies can be easily replicated, whereas
up to 40% are impossible to replicate.
Lashgari et al. (Lashgari et al., 2020) focused their
systematic review on studies and papers dealing with
EEG data augmentation and deep learning methods
over EEG datasets. Only 29 out of 53 studies pro-
vided classification results before and after dataset
Augmentation of Motor Imagery Data for Brain-Controlled Robot-Assisted Rehabilitation
813

augmentation. The overall average improvement
across all augmentation methods was 0.29±0.08%,
with the best improvement using the Noise Injection
(NI) method (with the overall average improvement
of 0.36%), followed by the sliding window method
(average improvement of 0.33%), and GAN (average
improvement of 0.28%). The most commonly (62%)
used classifier was CNN. The second most popular
(16%) classifier was a hybrid one, the combination of
Long Short-Term Memory (LSTM) and CNN. In 8%
of studies, MultiLayer Perceptron (MLP) was used,
and in 6% of studies, only LSTM was used.
(Al-Saegh et al., 2021) discussed studies dealing
with EEG signal processing in MI tasks; specifically,
they went through 40 studies written between 2015
and 2020. The most significant proportion of studies
(45.6%) focused only on detecting two MI classes,
left-hand and right-hand movement. The second most
frequent (31.6%) classification task dealt with de-
tecting left-hand, right-hand, tongue, and foot move-
ments. The most used classifier (73% of the studies)
was CNN. Another 14% of studies used a form of hy-
brid architecture, typically a combination of CNN and
LSTM. The most frequently (66%) used classifier ac-
tivation function was ReLU, and the most frequently
(47%) used learning optimizer was Adam.
Experiments aimed at detecting MI in the EEG
signal are also described in (Mochura, 2021) and
(Saleh, 2022). (Mochura, 2021) work involved the
construction of various feature vectors as an input to
a MultiLayer Perceptron (MLP). The most success-
ful, in terms of classification accuracy, feature vec-
tor was constructed by computing ERD and ERS for
each measurement. (Mochura, 2021) produced an
inter-subject model, and the best average classifica-
tion accuracy (90.05%) was achieved using a feature
vector consisting of the calculated ERD followed by
the calculated ERS. Only one class of MI was consid-
ered (movement of any limb); movement vs. resting
state was classified. ERD was calculated in the alpha
band, whereas the ERS was calculated in the lower
beta band.
Saleh (Saleh, 2022) focused on detecting Senso-
riMotor Rhytm (SMR), where a band-pass type filter
with cutoff frequencies of 8-13Hz was applied to each
signal epoch. Either the CSP method was then applied
to the filtered epochs, or the filtered epochs created di-
rectly the input to the SVM and Linear Discriminant
Analysis (LDA) classifiers. The EEG signals from
the C3, C4, and Cz electrodes were used. (Saleh,
2022) formed intra-subject models, i.e., a personal-
ized model for each subject, and performed a multi-
class classification where classes represented the left
motion, right motion, and resting state, respectively.
When summarizing the literature review, we can
state that various methods and techniques are used for
processing EEG signals and detecting MI patterns. In
the preprocessing phase, a band-pass filter is used for
the alpha and beta bands. Then, the channels (elec-
trodes) to be used are selected; the relevant channels
are C3, Cz, and C4. The parts of the EEG signal for
which an event has occurred (epochs, e.g., when the
subject has been instructed to move their hand) are
selected. The duration of an epoch varies, typically
ranging from 2-4 seconds. Removing signal artifacts
is also crucial, but this step can be quite complex, and
most studies have not mentioned it.
The last step in the preprocessing phase is the se-
lection of features. Most reviewed studies have not
constructed feature vectors and used the time series
of each epoch as inputs to classifiers. Other stud-
ies performed feature extraction by calculating the
signal properties or converting the spectrogram into
an image. (Mochura, 2021) used directly calculated
ERD and ERS, and each epoch’s average power de-
crease/increase as input features. However, other
studies did not use averaging; single trials (individual
epochs) were used as classifier inputs.
The time series is the most commonly used repre-
sentation of the EEG signal due to the popularity of
CNN. This representation is also the easiest to imple-
ment, as no feature extraction is necessary. However,
the sampled signal is not usually used directly; it is
first preprocessed: electrode selection, filtering, and
artifact removal are generally performed as described
above. To detect MI, it is necessary to use a synchro-
nization label with the measured EEG signal. For the
analysis, we are only interested in selected windows
of the EEG signal around the synchronization mark-
ers; these time intervals are called epochs. Typically,
MI tasks are repeated during experiments, i.e., more
epochs are obtained from the EEG signal.
In addition to analyzing the signal in the time do-
main, it is also reasonable to analyze the signal in the
frequency domain. Since MI is associated with the
desynchronization (ERD) and subsequent synchro-
nization (ERS) of the alpha and beta frequency bands,
detecting motion from the EEG signal could be done
by analyzing its frequency spectrum.
By extracting features from the time domain only,
we do not consider the frequency spectrum features.
Similarly, we lose information from the time domain
by extracting features only from the frequency do-
main. For this reason, these characteristics are some-
times considered weak for extracting significant fea-
tures (Al-Saegh et al., 2021). The short-term Fourier
transform (STFT), wavelet transform, and Hilbert fil-
ter, in particular, convert the input signal into the time-
HEALTHINF 2024 - 17th International Conference on Health Informatics
814

frequency domain, thus combining information from
both the time and frequency domains.
In EEG signal processing, there is a big trouble
with the size of the original data that is available.
The classifier is likely to produce poor results if the
amount of training data is small compared to the size
of the feature vectors. It is recommended to use at
least five to ten times higher number of input vectors
per class than it is dimensionality. Unfortunately, this
requirement is troublesome because the number of in-
put data is usually small, and the dimensionality is
high (Va
ˇ
reka, 2018).
Since the classification using deep learning meth-
ods in EEG signal processing is gaining popularity,
a prerequisite for obtaining the expected results is
to have a large training set, which should provide
greater robustness and generalization capability to
deep learning-based classifiers (He et al., 2021), and
(Iglesias et al., 2023).
However, acquiring a large EEG dataset during
experimentation takes much work. On the other
hand, using a small dataset leads to overfitting and,
thus, poor generalization of the trained classifier. A
promising approach to deal with this problem is to use
data augmentation; then, the overfitting problem is
solved by using a more complex dataset to minimize
the distance between the training and test datasets.
There are two basic approaches for creating new ar-
tificial samples. The first approach is to make of-
ten simple changes (manipulations) to the collected
feature vectors, thereby augmenting the data directly.
The second approach is to use generative models to
learn the distribution of the input feature vectors. One
problem with data augmentation is that for specific
datasets, one can reasonably quickly decide whether
a new augmented data sample still resembles the orig-
inal class (e.g., for an image by visual inspection).
However, in EEG signal processing, it may not be so
straightforward (Lashgari et al., 2020).
The methods based on feature manipulation in-
clude modifications of the input feature vectors by ap-
plying some geometric transformations (sliding win-
dow, scaling); the second approach is to add noise to
the existing training data (Lashgari et al., 2020). The
advantages of these algorithms are their simplicity
and the relatively small number of configurable hy-
perparameters. Compared to generative models, they
also need less data. In the context of individual trans-
formations, it is essential to note that not all methods
are suitable for EEG signal processing because they
may distort the time domain of the signal, thus pro-
ducing non-valid data samples (Lashgari et al., 2020).
Generative models are machine/deep learning al-
gorithms that produce new data samples based on
learned features from a training dataset. Thus, gener-
ative models aim to predict new feature vectors from
a distribution similar to the original input training
set. The typical generative models include Variational
Autoencoder (VAE) and Generative Adversarial Net-
work (GAN). However, based on the results of the
studies, the impact of data augmentation on classifi-
cation accuracy was not proved to be significant.
There is no consensus for using augmented data
evaluation metrics in data augmentation studies. Most
of the metrics are primarily focused on the area
of machine vision because this area is where these
methods are most commonly used (Iglesias et al.,
2023). However, the following metrics are often
used: Fr
´
echet Inception Distance (FID), Signal-to-
noise ratio (SNR), Root mean square error (RMSE),
and Cross-correlation (CC).
According to the studies presented above, the
most popular classifiers for MI detection have been
CNN (73%), followed by RNN and a combination of
both approaches (14%). Traditional classifiers such
as MLP, LDA, and SVM can be a baseline for com-
paring classification results with more complex deep
learning architectures. Some studies have also been
on using transformers, e.g., (Tan et al., 2023).
3 MATERIALS AND METHODS
This section introduces the created and used MI
dataset and describes the basic parameters of EEG
signal preprocessing and processing methods and
the augmentation techniques, classifiers, and metrics
used.
3.1 Dataset
The experiment protocol to acquire EEG data us-
ing the rehabilitation robot was designed by Pavel
Mochura (Mochura, 2021). Three experimenters used
it to produce the resulting dataset. For the context of
this paper, it is briefly described further; for a more
detailed description of the protocol and the experi-
mental process, see (Mochura, 2021).
The participant sits in a chair and holds the arm of
the rehabilitation robot with his left or right hand. The
actual experimental measurement is then performed
by alternating resting and movement phases for the
duration of the experiment (10 minutes). In the rest-
ing phase, the subject is prevented from moving the
robot arm for 10 seconds. In the movement phase, the
subject moves the rehabilitation robot’s arm along a
predefined trajectory for 20 seconds.
The final dataset consists of data from 29
Augmentation of Motor Imagery Data for Brain-Controlled Robot-Assisted Rehabilitation
815
healthy subjects (men aged 21-26 and women
aged 18-23). The data have been anonymized
and are freely available for download at
https://zenodo.org/record/7893847.
3.2 Data Processing
The raw signal from three electrodes (Cz, C3, and C4)
was selected, four-second epochs were created, the
baseline correction was performed, the epochs were
undersampled to 500 Hz, epochs were filtered with
a band-pass filter with a finite impulse response and
cutoff frequencies of 8-30Hz, artifacts were rejected
with the threshold of 100 microvolts, and the epochs
were selected to balance the training classes. The fea-
ture extraction was already done; the measured volt-
ages create the values of the feature vector. The data
was randomly shuffled, and the resulting dataset was
divided (80% of the data was used as a training set
and 20% as a test set).
For data augmentation, the following methods
were used: noise injection (NI), conditional vari-
ational autoencoder (cVAE), and conditional GAN
with Wasserstein price function and gradient penalty
(cWGAN-GP). All augmentation metrics mentioned
above, i.e. Fr
´
echet Inception Distance (FID),
Signal-to-noise ratio (SNR), Root mean square er-
ror (RMSE), and Cross-correlation (CC)) were ap-
plied. As classifiers, the following methods were
used: Linear Discriminant Analysis (LDA), Sup-
port Vector Machine (SVM), MultiLayer Perceptron
(MLP), Long Short-Term Memory (LSTM), and Con-
volutional Neural Network (CNN). Traditional met-
rics (accuracy, precision, recall, and F1 score) were
used to evaluate the classification results.
All experiments were performed on a computer
with the following system specifications: CPU – Pro-
cessor Intel(R) Core(TM) i7-6700 CPU @ 3.40GHz,
3408 Mhz, 4 Core(s), 8 Logical Processor(s), RAM
– 16GB DDR4 3200MHz, GPU – NVIDIA GeForce
GTX1660 O6G, and OS – Microsoft Windows 10
Pro.
3.3 Data Augmentation
Ten-fold cross-validation was performed; the mean
and standard deviation of the ten cross-validation it-
erations were calculated for each classification met-
ric. In addition to classification metrics, the train-
ing and inference (classification) time were measured.
Training time was calculated as the total duration of
ten-fold cross-validation, and classification time was
measured as the duration of class prediction of a sin-
gle feature vector. All classifiers were trained using
GPU.
During the augmentation process, the original
dataset was doubled. It means that the augmented
training set comprised one-half of the actual EEG col-
lected data and half of the data generated by the aug-
mentation method.
4 RESULTS
The classification results provided in the following
tables have the format mean ± standard deviation.
A given classifier’s best classification metric result
is highlighted in bold. The best global result of a
classification metric for a given classification class is
framed .
Table 1 contains resulting metrics when augmen-
tation methods for the input data and binary classifi-
cation were performed. Table 2 presents the results
of classification metrics for different combinations of
classifiers and augmentation methods when perform-
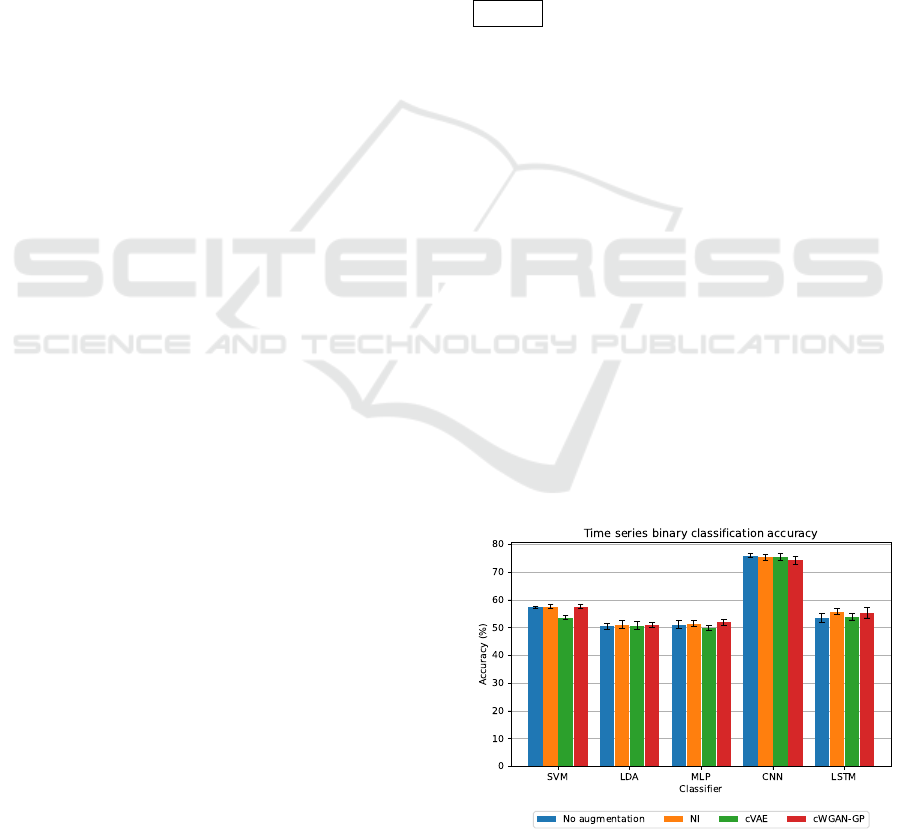
ing binary classification. A visual representation of
accuracy from Table 2 is shown in Figure 1. Simi-
larly, Tables 3 and 4, and Figure 2 present results for
multiclass classification.
The training time (duration of ten-fold cross-
validation) differed from 58 seconds for the SVM
method to more than 16 minutes for the cVAE CNN
in the case of binary classification and from 55 sec-
onds (the SVM method) to more than 15 minutes
for the cVAE CNN in case of multiclass classifica-
tion. The classification time (for one input sample)
differed from 1 millisecond (LDA-based methods) to
868 milliseconds (the cWGAN-GP LSTM method) in
the case of binary classification and from 1 millisec-
ond (LDA-based methods) to 961 milliseconds (the
LSTM method).
Figure 1: Visualization of accuracy when binary classifica-
tion was performed.
HEALTHINF 2024 - 17th International Conference on Health Informatics
816
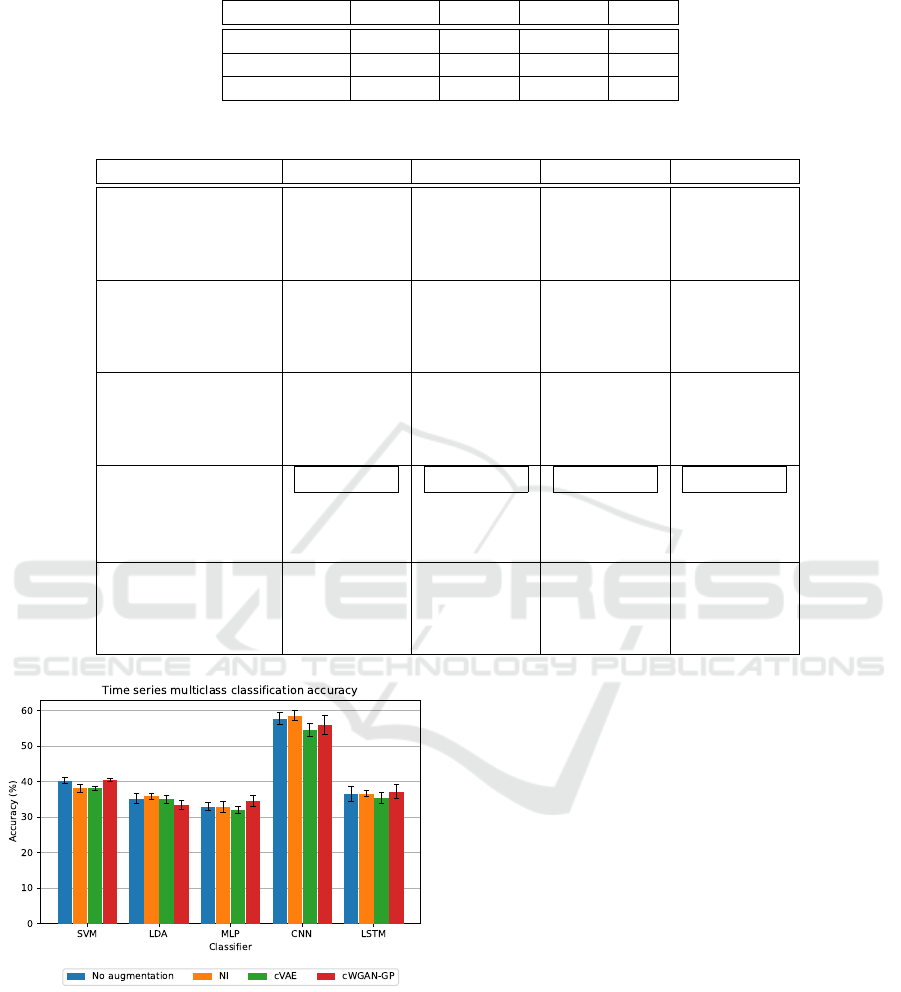
Table 1: Resulting metrics when augmentation methods for the input data and binary classification were performed.
Method FID SNR RMSE CC
NI 3243.64 4.207 1.41414 0.194
cVAE 9029.46 15.772 1.41045 0.489
cWGAN-GP 10900.1 2.953 1.41435 0.492
Table 2: Classification results when binary classification was performed.
Method Accuracy Precision Recall F1 Score
SVM 57.28±0.47 57.28±0.47 57.26±0.47 57.24±0.47
NI SVM 57.59±0.71 57.85±0.71 57.65±0.70 57.34±0.72
cVAE SVM 53.58±0.64 53.63±0.66 53.52±0.64 53.22±0.66
cWGAN-GP SVM 57.47±0.73 57.55±0.75 57.42±0.73 57.26±0.73
LDA 50.51±0.99 50.53±0.99 50.52±0.99 50.49±0.98
NI LDA 51.00±1.45 51.02±1.46 51.02±1.45 50.95±1.45
cVAE LDA 50.66±1.42 50.68±1.43 50.68±1.42 50.64±1.43
cWGAN-GP LDA 51.00±1.02 51.02±1.03 51.02±1.03 50.96±1.02
MLP 51.12±1.49 51.16±1.55 51.13±1.52 50.55±1.90
NI MLP 51.45±1.04 51.50±1.05 51.47±1.04 51.17±1.18
cVAE MLP 49.82±0.89 49.78±0.92 49.77±0.86 49.24±0.65
cWGAN-GP MLP 51.88±0.99 51.98±1.09 51.88±0.97 51.38±0.97
CNN 76.00±0.80 76.73±0.75 76.05±0.79 75.86±0.90
NI CNN 75.34±1.09 76.69±0.67 75.41±1.07 75.05±1.30
cVAE CNN 75.39±1.27 75.72±1.31 75.42±1.28 75.33±1.28
cWGAN-GP CNN 74.29±1.40 75.01±1.13 74.30±1.44 74.10±1.56
LSTM 53.60±1.64 53.62±1.65 53.60±1.64 53.55±1.62
NI LSTM 55.75±1.13 55.79±1.12 55.77±1.12 55.71±1.13
cVAE LSTM 53.98±1.21 54.00±1.20 53.99±1.21 53.95±1.25
cWGAN-GP LSTM 55.41±1.92 55.45±1.89 55.43±1.90 55.34±1.96
Figure 2: Visualization of accuracy when multiclass classi-
fication was performed.
5 DISCUSSION
The best classification result (76.00±0.80% accuracy)
was obtained using the CNN classifier for binary clas-
sification of time series data without augmentation.
The results of the other classification metrics are very
similar to the classification accuracy, indicating good
performance of the individual models (given the bal-
anced representation of each classification class, this
result was expected). At the same time, the CNN clas-
sifier provides statistically significantly better results
than the other classifiers (based on McNemar’s test;
p < 0.01). The results also represent an improvement
over those obtained in the work of (Mochura, 2021)
and (Saleh, 2022). The differences between the re-
sults of the used classifiers are probably due to the
high dimensionality of the individual feature vectors.
It is interesting to compare the results of bi-
nary and multiclass classification, where the best re-
sult (58.57±1.45%) of multiclass classification was
achieved by the CNN on the data augmented with
NI. Overall, the results of multiclass classification are
significantly worse than the results of binary classifi-
cation, and most classifiers did not even achieve an
accuracy of 50% in multiclass classification. This
fact suggests that the classifiers demonstrated some
predictive ability to distinguish between the subject’s
resting state and movement state but couldn’t longer
Augmentation of Motor Imagery Data for Brain-Controlled Robot-Assisted Rehabilitation
817

Table 3: Resulting metrics of augmentation methods when multiclass classification was performed.
Method FID SNR RMSE CC
NI 3303.68 4.206 1.41461 0.202
cVAE 8869.08 14.513 1.41593 0.442
cWGAN-GP 10869.6 3.643 1.4143 0.503
Table 4: Classification results when multiclass classification was performed.
Method Accuracy Precision Recall F1 Score
SVM 40.35±0.82 40.43±0.82 39.82±0.79 39.48±0.80
NI SVM 38.18±1.09 39.56±1.08 38.36±1.10 38.21±1.10
cVAE SVM 38.16±0.51 36.88±0.66 37.04±0.50 36.15±0.53
cWGAN-GP SVM 40.48±0.52 39.30±0.95 39.24±0.56 37.97±0.58
LDA 35.26±1.46 35.34±1.45 35.32±1.47 35.20±1.42
NI LDA 35.88±0.79 35.86±0.79 35.91±0.72 35.81±0.77
cVAE LDA 35.02±1.11 35.04±1.09 35.06±1.06 34.96±1.08
cWGAN-GP LDA 33.58±1.27 33.68±1.27 33.64±1.33 33.53±1.29
MLP 32.94±1.13 33.03±1.21 33.00±1.21 32.49±1.03
NI MLP 32.92±1.55 33.05±1.55 32.92±1.52 32.85±1.54
cVAE MLP 32.10±0.99 32.01±0.90 31.94±1.07 31.70±1.15
cWGAN-GP MLP 34.65±1.58 34.37±0.91 34.30±1.16 33.29±1.74
CNN 57.79±1.69 59.36±2.47 57.60±1.84 57.17±2.08
NI CNN 58.57±1.45 60.32±1.48 58.43±1.48 57.99±1.72
cVAE CNN 54.60±1.83 55.39±1.50 54.39±1.66 53.98±2.06
cWGAN-GP CNN 55.97±2.71 58.28±2.28 55.77±2.60 54.87±3.65
LSTM 36.54±2.20 36.59±2.25 36.47±2.22 36.39±2.22
NI LSTM 36.67±0.84 36.76±0.78 36.70±0.79 36.50±0.81
cVAE LSTM 35.44±1.56 35.45±1.52 35.37±1.60 35.31±1.58
cWGAN-GP LSTM 37.22±1.88 37.30±1.96 37.12±1.89 36.92±1.93
distinguish whether the movement was a left-hand or
a right-hand movement.
The impact of augmentation methods on classifi-
cation results gives no reason for optimism. However,
in most cases, at least one of the augmentation meth-
ods provided some improvement in classification ac-
curacy over classification without augmentation. The
low improvement values are consistent with the re-
sults provided in (Lashgari et al., 2020).
In the case of the cWGAN-GP method, the plau-
sibility of the result is quite questionable since the
method does not generate realistic data. Also of inter-
est is the impact of the cVAE method, which, based
on visual inspection and evaluated augmentation met-
rics, provides decent representative feature vectors
but the worst classification improvement on average.
One possible explanation may be that augmentation
methods represent one form of regularization. The
classifiers might produce simpler decision boundaries
to improve generalization ability, which typically re-
duces classification accuracy.
One of the critical indicators for the applicabil-
ity of the BCI system is the classification time. The
longer the classification time is, the longer the re-
sponse time of the BCI system to the request is (in
this case, to help with a movement). If the response
time is too long, it is uncomfortable for the subject
to use the system. Of course, the training time of the
classifier also plays an important role, but the training
can be done offline and is, therefore, not as important
as the classification time, which must be done in real
time.
It is also quite essential to note that although a
fairly decent classification result (76.00±0.80%) was
achieved (especially for the inter-subject model when
using single-trials classification), the data were col-
lected on a relatively small non-representative number
of people (29 healthy subjects aged 19 to 25 years).
However, the target user of the BCI system will be a
subject who is recovering from some injured motor
functions, and it is, therefore, questionable whether
the physical nature of the measured EEG signal is the
same as that of healthy subjects. Thus, to get more
robust results, it is necessary to obtain a larger size of
data from different subjects (Padfield et al., 2019).
Most hyperparameters of classifiers and augmen-
HEALTHINF 2024 - 17th International Conference on Health Informatics
818

tation methods have been set empirically or based on
similar studies; a sophisticated search of their space
could bring better classification results. It would also
be worthwhile to investigate the impact of augmenta-
tion methods on classification results using more gen-
erated data. Furthermore, intra-subject models can
also provide better classification results.
6 CONCLUSIONS
This paper presents the results of the augmentation
and classification methods on a dataset containing
data from motor imagery experiments. These ex-
periments help to verify whether the motor imagery
concept could be successfully used for real BCI-
controlled and robot-assisted motor rehabilitation.
The data augmentation was performed using three
methods. A single-trial inter-subject model was
trained, and the MI patterns were detected using five
classifiers. The best accuracy (76.00±0.80%) was ob-
tained using the CNN classifier without dataset aug-
mentation. Although the data augmentation and clas-
sification results are not too optimistic, they are com-
parable to the results obtained in the literature. They
also bring some improvements compared to the pre-
vious works of (Mochura, 2021) and (Saleh, 2022).
The future work includes mainly finishing the ex-
periments and bringing results when the frequency
and time-frequency spectrum are used as representa-
tions of input feature vectors, enlarging the size of the
real-world data by performing experiments with the
target group of people, generating more artificial data,
and training and using intra-subject models.
ACKNOWLEDGEMENTS
This work was supported by project FW03010025
Therapeutic rehabilitation robot controlled by brain
signals, and the university-specific research project
SGS-2022-016 Advanced Methods of Data Process-
ing and Analysis (project SGS-2022-016).
REFERENCES
Abdelfattah, S. M., Abdelrahman, G. M., and Wang, M.
(2018). Augmenting the size of eeg datasets using
generative adversarial networks. In 2018 Interna-
tional Joint Conference on Neural Networks (IJCNN),
pages 1–6.
Al-Saegh, A., Dawwd, S. A., and Abdul-Jabbar, J. M.
(2021). Deep learning for motor imagery eeg-based
classification: A review. Biomedical Signal Process-
ing and Control, 63:102172.
He, C., Liu, J., Zhu, Y., and Du, W. (2021). Data augmen-
tation for deep neural networks model in eeg classi-
fication task: A review. Frontiers in Human Neuro-
science, 15.
Iglesias, G., Talavera, E., Gonz
´
alez-Prieto,
´
A., Mozo,
A., and G
´
omez-Canaval, S. (2023). Data augmen-
tation techniques in time series domain: a survey
and taxonomy. Neural Computing and Applications,
35(14):10123–10145.
Lashgari, E., Liang, D., and Maoz, U. (2020). Data aug-
mentation for deep-learning-based electroencephalog-
raphy. Journal of Neuroscience Methods, 346:108885.
Mochura, P. (2021). Detection of limb movement from
eeg signal during exercise on a rehabilitation robot (in
czech). Diplomova thesis.
Padfield, N., Zabalza, J., Zhao, H., Masero, V., and Ren,
J. (2019). Eeg-based brain-computer interfaces using
motor-imagery: Techniques and challenges. Sensors,
19(6):1423.
Roy, Y., Banville, H., Albuquerque, I., Gramfort, A., Falk,
T. H., and Faubert, J. (2019). Deep learning-based
electroencephalography analysis: a systematic review.
Journal of Neural Engineering, 16(5):051001.
Saleh, J. Y. (2022). Design of movement detector of mea-
sured eeg data. Bachelor thesis.
Tan, X., Wang, D., Chen, J., and Xu, M. (2023).
Transformer-based network with optimization for
cross-subject motor imagery identification. Bioengi-
neering, 10(5):609.
Tang, Z., Li, C., and Sun, S. (2017). Single-trial eeg clas-
sification of motor imagery using deep convolutional
neural networks. Optik, 130:11–18.
Va
ˇ
reka, L. (2018). Methods for signal classification and
their application to the design of brain-computer in-
terfaces. Diserta
ˇ
cn
´
ı pr
´
ace.
Yang, J., Yu, H., Shen, T., Song, Y., and Chen, Z. (2021).
4-class mi-eeg signal generation and recognition with
cvae-gan. Applied Sciences, 11(4).
Zhang, J. and Wang, M. (2021). A survey on robots con-
trolled by motor imagery brain-computer interfaces.
Cognitive Robotics, 1:12–24.
Zhang, K., Xu, G., Han, Z., Ma, K., Zheng, X., Chen, L.,
Duan, N., and Zhang, S. (2020). Data augmentation
for motor imagery signal classification based on a hy-
brid neural network. Sensors, 20(16).
Augmentation of Motor Imagery Data for Brain-Controlled Robot-Assisted Rehabilitation
819
