
Performance Evaluation of Visual Analytics Framework for
Monitoring Neuromotor Rehabilitation
Maryam Boumrah
1
, Samir Garbaya
2
and Amina Radgui
1
1
Centre d’études doctorales Télécoms et Technologies de l’Information (CEDOC-2TI)”, INPT, Rabat, Morocco
2
Laboratoire END-ICAP, INSERM UMR1179, Arts et Metiers Institute of Technology,
CNAM, LIFSE, HESAM University, F-75013 Paris, France
Keywords: Fog Computing, Opentelemetry, Remote Patient Monitoring, Rehabilitation, Stroke, Latency, Scalability.
Abstract: Remote rehabilitation of stroke patients reinforces in-person rehabilitation and enhances the regaining of
neuromotor capabilities. However, monitoring stroke patients’ rehabilitation from different locations and on
a large scale requires a low latency and scalable approach. A real-time visual analytics framework for
monitoring in-home rehabilitation of stroke patients based on fog computing is proposed. The objective of
this paper is to evaluate the performance of the proposed framework in terms of latency and scalability.
OpenTelemetry was used for the evaluation of the proposed framework. OpenTelemetry was chosen over
simulation tools for its real-time observability features providing accurate comprehension of the distributed
system behaviors in real-world implementation. Five scenarios were setup by progressively escalating the
volume of data flow and the number of packets. These scenarios enabled a thorough examination of the
framework's ability to handle higher workloads and scalability. The results of end-to-end latency of the
proposed system were compared to the Cloud-only implementation. Compared to Cloud-only
implementation, the findings of the evaluation showed that the latency of the proposed system was
significantly low. Reflecting the scalability feature, the capacities of handling workload by the proposed
system in terms of latency, throughput, processing, and resource utilization were stable across the first four
configurations. However, the limitations noticed in the fifth configuration put in evidence the constraints of
the experimental setup used in this research. Moreover, the scalability and efficiency of the system can be
further enhanced in a distributed deployment in real-world conditions.
1 INTRODUCTION
The recent research in brain stroke focuses on in-
home rehabilitation interventions that are having the
most positive impact on functional, motor, and
cognitive recovery outcomes of the patient’s health.
Remote patient monitoring (RPM) of in-home
rehabilitation helps in reaching unassisted patients in
different geographical locations and enhances
patient-therapist communication (De Farias et al.,
2020). In addition, RPM allows users to interact with
therapy systems online and speeds up data
transmission between different health stakeholders
which improves the quality of healthcare and helps
approach the in-home patients.
In all stroke rehabilitation systems, it is important
to perform accurate assessments of physical recovery.
The collected data from patients must be processed
and presented to the therapist in a meaningful and
useful way, especially for unsupervised systems.
Furthermore, real-time information feedback
provided by rehabilitation systems enables the
therapists to take necessary and immediate actions. In
order to provide the support to therapists in
monitoring patients, the information must be
visualized with simple illustrations. Real-time data
analytics and visualization have the potential to
perform as an informative decision-support tool for
the therapists. According the literature investigations,
few monitoring systems implemented data analytics
but they did not include real-time data processing.
Hence, real-time visual analytics is an important
opportunity for the development of innovative
rehabilitation systems.
The potential of RPM systems makes it play a
crucial role in in-home neuromotor rehabilitation of
brain stroke patients. However, the spatiotemporal
nature of physical rehabilitation data and its massive
volume make it challenging to maintain the real-time
aspect of monitoring systems. The minimum latency
Boumrah, M., Garbaya, S. and Radgui, A.
Performance Evaluation of Visual Analytics Framework for Monitoring Neuromotor Rehabilitation.
DOI: 10.5220/0012575600003660
Paper published under CC license (CC BY-NC-ND 4.0)
In Proceedings of the 19th International Joint Conference on Computer Vision, Imaging and Computer Graphics Theory and Applications (VISIGRAPP 2024) - Volume 1: GRAPP, HUCAPP
and IVAPP, pages 557-566
ISBN: 978-989-758-679-8; ISSN: 2184-4321
Proceedings Copyright © 2024 by SCITEPRESS – Science and Technology Publications, Lda.
557

is a crucial requirement that ensures the patient’s
safety and the accuracy of information transmission.
The continuous increasing number of the stroke
patients with different disabilities and the limited
access to professional rehabilitation therapists
imposes the necessity of monitoring multiple patients
by each therapist. To fulfil these requirements, RPM
systems need to be versatile and highly scalable.
The RPM systems are witnessing a proliferation
of advanced technologies. Fog computing is a
trending paradigm in healthcare systems for its
scalability and low latency. However, existing RPM
systems based on fog computing which have proved
the ability to handle increasing workload and provide
low latency were evaluated using simulation tools.
While these tools, such as iFogSim (Gupta et al.,
2017) are providing efficient modelling and
simulating fog computing environments, they may
fall short in providing real-time observability. In
addition, their primary applicability is limited to
experimental scenarios instead of real deployment
conditions. On the other hand, as a relatively new
paradigm, OpenTelemetry (OTel) (Documentation |
OpenTelemetry, n.d.) is a unified opensource
framework for generating, collecting, and
transmitting telemetry data. OTel stands out for its
real-time observability features providing more
authentic operational insights.
In this paper, the performance of a proposed
visual analytics framework for monitoring stroke
neuromotor rehabilitation was evaluated using OTel.
Based on fog architecture, this new framework
approach was evaluated in terms of latency and
scalability and compared with Cloud-only
implementation. To the best of our knowledge, there
is no research previous to the work presented in this
paper that used OTel for evaluating the performance
of fog-based RPM systems.
2 RELATED WORK
Fog paradigm provides computational resources
closer to the data sources, such as IoT devices and
their gateways. Challenges arise in monitoring the
performance of the orchestrated services of this
distributed infrastructure (Bonomi et al., 2012).
Mahmud et al.(Mahmud et al., 2018) presented an
evaluation of performance of Fog-based IoT-
Healthcare solutions through simulation studies using
iFogSim (Gupta et al., 2017) in terms of service
delivery, cost, energy usage and latency. They setup
scenarios through simulations using the iFogSim
simulator and the obtained results were analyzed in
relation to distributed computing, reduction of latency
and power consumption.
Similarly, Asghar et al. (Asghar et al., 2021) used
iFogSim toolkit to validate the effectiveness of their
fog based approach for health monitoring systems.
They conducted five simulation scenarios for
evaluating the latency and network usage of their
approach while comparing it with Cloud-only
implementation. Das et al. (Das et al., 2022)
performed simulations using iFogSim to evaluate
their approach about enabling green healthcare
services using integrated iot-edge-fog-cloud
computing environments. They used simulation-
based analysis and real-time data analysis in Google
cloud platform (GCP). They evaluated the metrics of
stability, accuracy, latency, and energy consumption.
Saidi et al. (Saidi et al., 2020) analyzed the
performance of their proposed Fog to Cloud
computing solution in terms of latency and energy
consumption using FogWorkflowSim simulator (Liu
et al., 2019).
The existing approaches for evaluating the
performance of fog-based solutions for healthcare
monitoring are limited to the use of simulations
toolkits such as iFogSim. Recently, the advancement
of observability solutions such as OTel is growing.
However, their applications in performance
evaluation of healthcare monitoring solutions are still
limited and not yet explored.
3 BACKGROUND
In-home neuromotor rehabilitation aims to regain
neuromotor functionalities of patients and enhance
the coordination of their body limbs after the stroke.
The technology advancement opened opportunities
for patients to practice rehabilitation exercises at
home (Fig.1). These practices include activities of
daily living, gait training, range of motion
improvement, balance and strength exercises. The
data collected from the stroke patient during
rehabilitation is of multiple types. However, most of
this data has spatiotemporal nature that makes it
challenging in terms of processing and real-time
visualization.
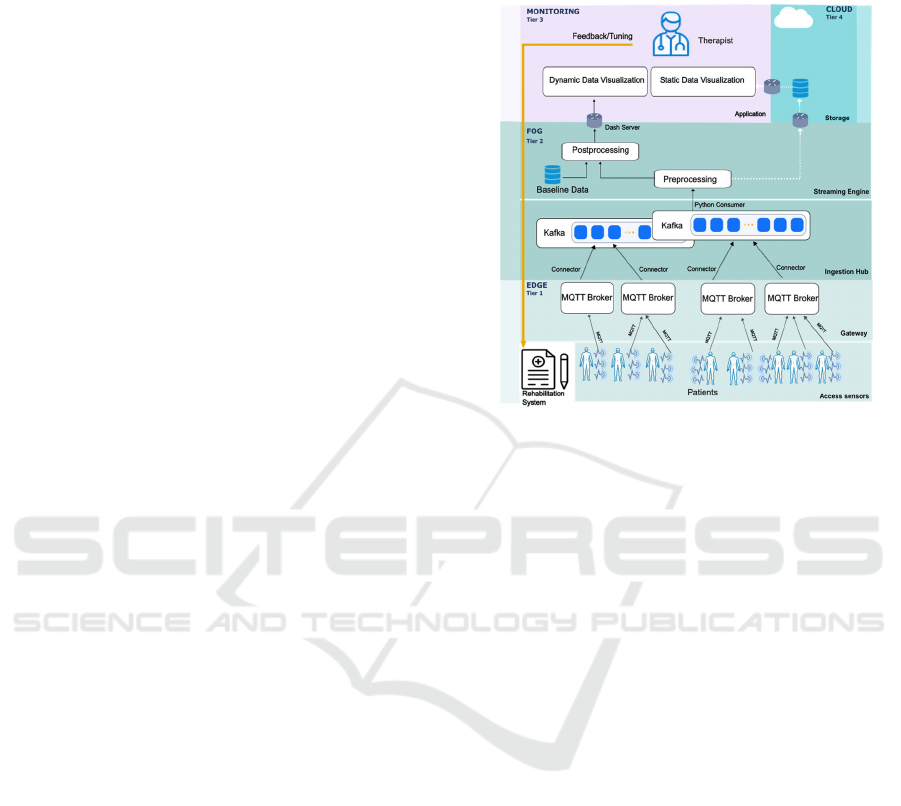
For monitoring in-home neuromotor
rehabilitation of stroke patients, a visual analytics
framework based on fog computing was proposed
(Fig.2). The architecture of the proposed framework
is based on a different approach from traditional fog-
based architectures. The requirement for real-time
visualization with minimal latency is crucial for
patient safety and the accuracy of information
HUCAPP 2024 - 8th International Conference on Human Computer Interaction Theory and Applications
558
displayed in the user interface. Thus, the streaming of
the IoT data was split between real-time streaming
and batch streaming. The real-time stream flows
directly to the monitoring layer where the therapist
dashboard is included without going through the
Cloud. The batch stream is forwarded to the Cloud for
storage and for complex data analysis such as the
optimization of the medical information using deep
learning algorithms. In addition, the proposed
framework is integrally based on software
microservices. Therefore, this allows the portability
and versatility for different choices of devices and
server capacities in real-world implementations.
For dynamic data visualization at the therapist
dashboard, the implemented framework includes
MQTT brokers at the Edge layer to facilitate the
channeling of spatiotemporal data collected from
motion sensors placed on patients' different joints
during the rehabilitation exercises. The fog layer
includes Apache Kafka for data ingestion and a
streaming engine for real-time processing of patient
data and its mapping with target data. The monitoring
layer receives and displays advanced dynamic graphs
using a dash server.
However, this new approach must be evaluated in
terms of performance including latency, scalability,
and resource usage. The objective of the performance
evaluation of the proposed framework is to answer
the following questions:
RQ1- Does the new approach of connecting the
fog layer directly to the monitoring layer for real-time
visualization provide a better latency than Cloud-only
approach?
RQ2- By using the minimum of computing
capacities, what are the limits of the framework
latency, scalability, and resource utilization?
Answering these questions represents an
important contribution to the optimization and real-
world application of the proposed visual analytics
framework.
Most of the existing works about the evaluation
of the performance of fog-based systems used
simulation tools notably iFogSim. While iFogSim is
efficient for modelling and simulating fog computing
environments, it may fall short in providing real-time
observability. In addition, its main applicability is
limited to experimental scenarios instead of real
deployment conditions. On the other hand, as a
relatively new paradigm, OTel stands out for its real-
time observability features providing more authentic
operational insights. It facilitates the collection of
telemetry data and offers a standardized approach for
different programming languages. The OTel
instrumentation capabilities provide a detailed
evaluation of multiple components of distributed
systems, ensuring a holistic view of performance
metrics, traces, and logs.
Figure 1: The architecture of Visual Analytics framework.
The preference for OTel over iFogSim in the
evaluation of the proposed framework stems from the
requirement for accurate comprehension of the
system behaviours in real world implementations.
4 METHODS
4.1 Instrumentation with OTel
(Testbed)
The implementation of holistic observability within
the proposed framework implied the integration of
OTel software development kits (SDKs) into the
system codebase. This was accomplished by
instrumenting the main components of the proposed
fog-based architecture for capturing distributed
traces, logs, and metrics. As shown in Fig.3, Tempo
is a designated backend known for its scalability and
cost-effective storage, it was used as a collector of the
instrumentation traces from the codebase. While Loki
was configured to aggregate and store logs,
Prometheus was integrated to systematically provide
metrics originating from Tempo traces. cAdvisor
(Tolaram, 2023) was selected to acquire resource
usage metrics on the container level within the
Docker environment. This orchestrated integration
required proficient visualization using Grafana for a
comprehensive perspective on the behaviour of the
evaluated visual analytics framework.
Performance Evaluation of Visual Analytics Framework for Monitoring Neuromotor Rehabilitation
559
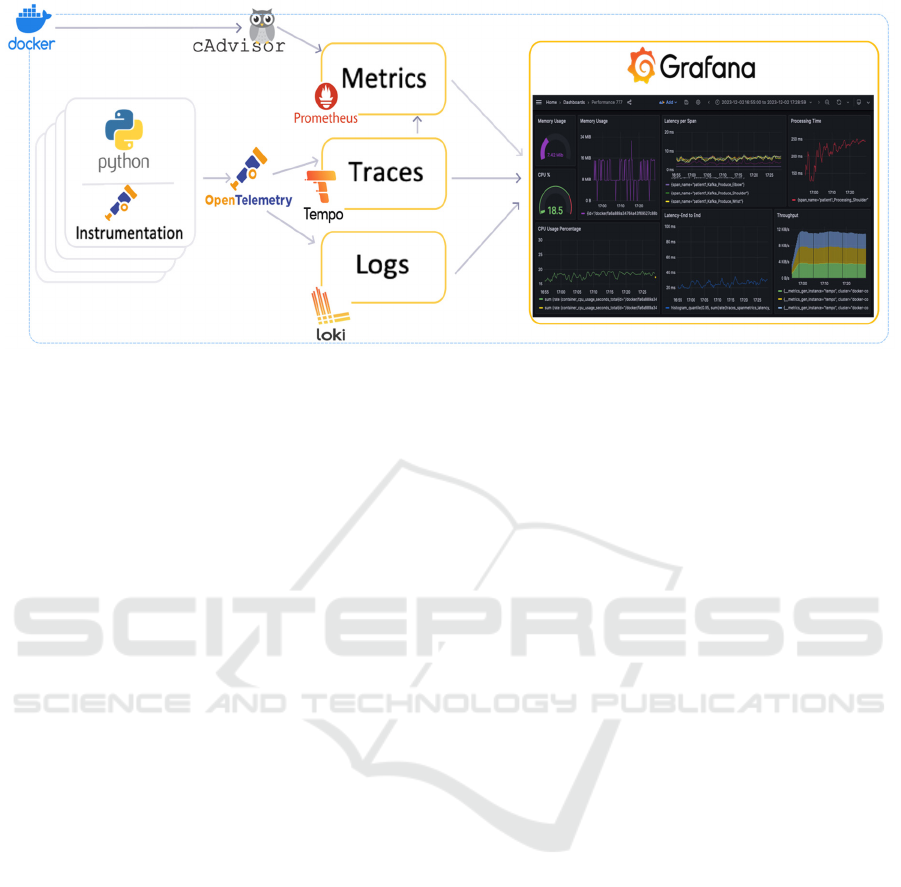
Figure 2: The structure of the testbed using OpenTelemetry instrumentation.
The instrumentation points are strategically placed to
capture critical traces of the data flow within the
system. These instrumentation points and their
functionalities are detailed as the followings:
IMU at Edge layer: This instrumentation
point is used to evaluate the data acquisition
from IMU sensors to the gateways.
MQTT at Edge layer: The instrumentation
encompassed both publishing and
subscribing functionalities. MQTT
publishing is used to write spatiotemporal
data in MQTT broker while MQTT
subscription is used to connect the data
stream with the fog layer.
Kafka at Fog layer: Kafka is deployed to
facilitate efficient and scalable exchange of
data streams. The instrumentation of Kafka
includes Kafka producer and Kafka
consumer. The functionality of Kafka
producer is to transmit data acquired from
the Edge layer to the Kafka Broker. On the
receiving end, the Kafka consumer is
employed to ingest the incoming data into
the processing unit within the fog layer.
Processing Engine at Fog layer: The
instrumentation within the processing node
includes preprocessing, mapping, and
postprocessing to capture relevant metrics.
The Dash server at the monitoring layer displays data
using callbacks with a predefined time interval. For
displaying graphs that the human eye can comfortably
perceive in real-time the common rate is ranging from
16 to 24 frames per second, which will imply a
minimum callback interval of 41.7 ms. For this
reason, the latency in the dash server was not included
in the evaluation of the framework.
4.2 Key Performance Indicators (KPIs)
In order to evaluate the efficiency of the proposed
framework and to offer valuable information about its
different aspects, the following KPIs were defined:
End-to-end latency: this metric is used to
measure the time taken for a sensor’s data
packet to flow through the entire Edge and
Fog layers. OTel enables tracking the
duration of each span in instrumentation
points detailed above,
Processing time: reflects the duration taken
by the execution of data processing in the
processing engine of the evaluated system,
CPU usage: indicates the percentage of the
capacity of the CPU being consumed by the
FastAPI application including the different
code components of the framework.
Monitoring CPU usage is important for the
determination of computing resource
requirements,
Memory usage: Tracking memory usage
reveals how much RAM is consumed by the
system application. This metric helps for
efficient memory management and the
estimation of the required configurations for
the optimization of the system performance,
Throughput: quantifies the rate in bytes at
which the system handles the stream of
medical spatiotemporal data. It helps to
HUCAPP 2024 - 8th International Conference on Human Computer Interaction Theory and Applications
560
evaluate the efficiency of the system in
handling increased workloads.
4.3 Experimental Setup
For implementing the designed evaluation testbed, a
dockerized deployment was used due to the
microservice nature of the distributed framework
(Fig. 4). Docker Desktop v20.10.21 was used on a
Mac operating system machine (Core i7 processor
with12GB of RAM, with 2.9 GHz frequency). Using
Pycharm v11.0.13 and Python 3, the different
containers were running within the same Docker
Engine. Docker containers encapsulated each element
of the evaluation structure including the evaluated
system application based on FastAPI. The following
tools were used for testbed containers:
- HiveMQ broker v.4.21 for MQTT protocol,
- Zookeeper and Kafka v7.0.1,
- Prometheus v2.45.0,
- Loki v2.8.3,
- cAdvisor v0.48.0
-Tempo v2.1.1
The deployment using Docker Compose ensures
the interconnection between the different containers
reflecting real-world implementation. The gRPC
(Google Remote Procedure Call) was used to export
collected traces using tempo as a collector. The
manual instrumentation was selected over the auto
instrumentation due to the limitation of the available
libraries for the components of the evaluated system.
Figure 3: Docker deployment.
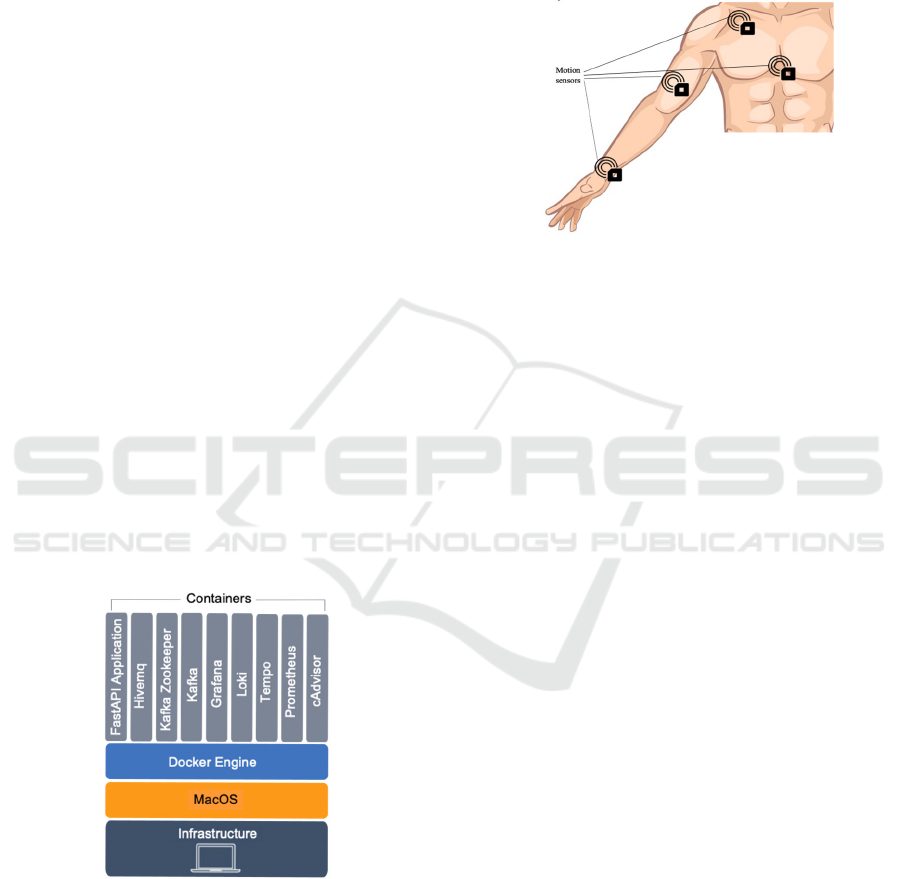
The proposed framework was mainly designed to
monitor remote neuromotor rehabilitation of post-
stroke patients. For this reason a dataset of stroke
rehabilitation of the upper limb including
spatiotemporal data of shoulder, elbow, and wrist
during activities of daily living was used in the
different test scenarios (Schwarz et al., 2020). Data
were acquired using IMU sensors placed on the
patient's upper limb as shown in Fig.5 (Averta et al.,
2021).
To simulate real-world conditions, the data were
looped and continuously ingested into the visual
analytics system.
Figure 4: Motion sensors attached to the patient’s body for
data capture.
The recommended minimum duration of a stroke
rehabilitation session is one hour (Clark et al., 2017).
For assessing the capabilities of the proposed
framework in monitoring stroke rehabilitation
sessions in real world conditions, five distinct
configuration scenarios were set up for a duration of
one hour each. During these scenarios, a single fog
node was used to comprehensively understand the
limitations and capacities of each node. The results
will reflect the requirements for scalability in terms
of the number of fog nodes in each use case. By
progressively increasing the volume of data flow and
number of packets, these scenarios enable a thorough
examination of the framework's ability to handle
higher workloads. The configurations used for the
evaluation of the framework are shown in Table 1.
The packet size used for the different scenarios is 232
bytes representing the size of a single spatiotemporal
message. For real deployment conditions, the number
of data streams is a multiplication of 3 which
represents the number of sensors used to capture data
from the patient’s upper limb.
5 RESULTS
The results of the evaluation of the performance of
the proposed framework were displayed in a Grafana
dashboard. Different graphs representing the defined
KPIs were generated using PromQL (Prometheus
Query Language) and TraceQL queries.
Performance Evaluation of Visual Analytics Framework for Monitoring Neuromotor Rehabilitation
561
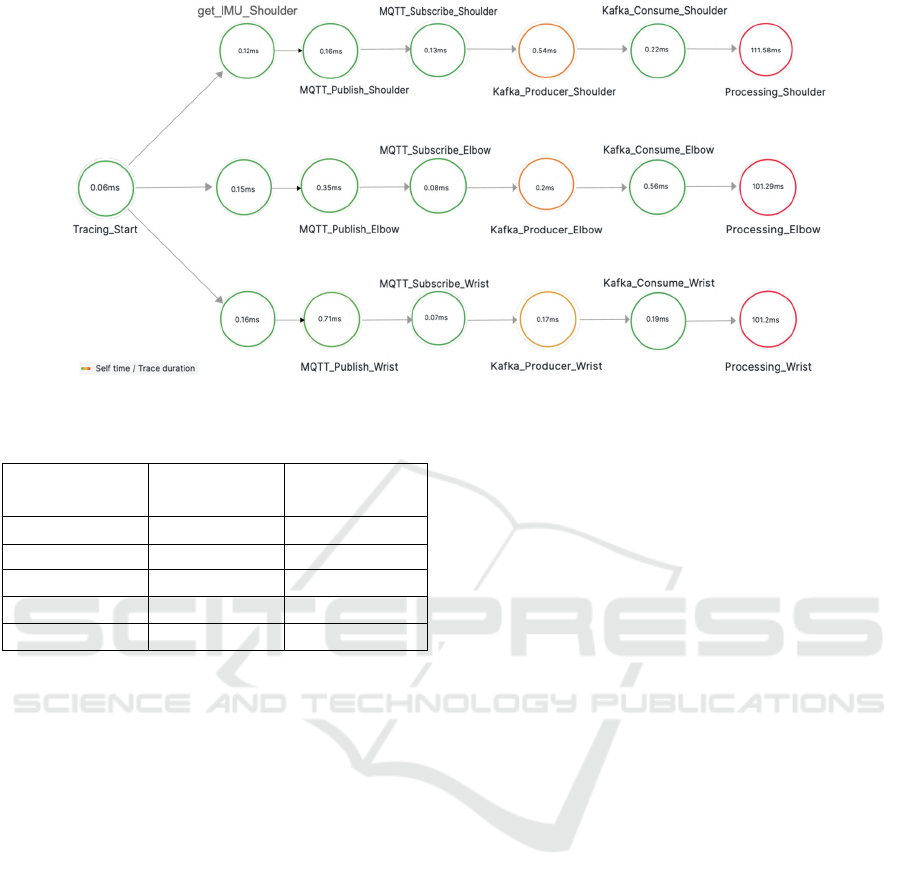
Figure 5: The node graph of the tracing propagation across instrumented points.
Table 1: Scenario Configurations (packet=232 bytes).
Configuration Number of
IoT streams
Number of
packets/second
Config 1 9 600
Config 2 18 1200
Config 3 27 1800
Config 4 36 2400
Config 5 45 3000
For a primary overview of the instrumentation,
figure 6 shows the node graph of the trace
propagation throughout the instrumented points
including parent span, MQTT publish/Subscribe
spans, Kafka Producer/Consumer spans and
processing spans. These traces were taken after
ingesting 3 spatiotemporal data packets (collected
from the movements of shoulder, elbow and wrist)
into the system in a single packet for each data type.
The upcoming results represent the measurements
made during the execution of the testing scenarios
described in the previous section.
5.1 Latency and Processing Time
The end-to-end latency of the proposed system is the
total time spans of the instrumented points of the
codebase. It represents the time taken by a data packet
to travel across the system nodes. For a baseline
comparison, cloud-only implementation was
evaluated in terms of latency in which the flow of data
is transmitted to the Cloud instead of the fog node.
The End-to-End latency of the proposed system (Ls),
and End-to-End latency of Cloud-only (Lc) are
respectively defined as the following:
Ls
=
L
get_IMU
+L
MQTT_Publish
+L
MQTT_Subscribe
+L
Kafka_Producer
+L
Kafka_Consume
Lc
=
L
get_IMU
+L
MQTT_Publish
+L
MQTT_Subscribe
+L
Write_Cloud
Where:
L
get_IMU:
Time to acquire IMU sensor data
L
MQTT_Publish:
Time to publish data in MQTT broker
L
Kafka_Producer:
Time to send data to Kafka topic
L
Kafka_Consume:
Time to consume data from Kafka topic
L
Write_Cloud
:
Time to write data in Cloud storage
Figure 7 shows the End-to-End latency
comparison between the proposed system and cloud-
only implementation for the five configurations. It is
noticed from the results that the latency in the
proposed system across all configurations is
significantly lower than in the cloud-only
implementation. For further investigations, the
proposed system latency was recorded for a duration
of one hour to evaluate the capacities of handling
increasing workload with a low latency (Fig. 8).
PromQL function histogram
_ quantile was
used by quantifying the 95th percentile latency across
various spans within the tracing service for in-depth
understanding. The resulting End-to-End latency and
per span latency were visualized in the graphs
displayed in Fig.8, they provide a detailed distribution
of latency values across the system. Each span of each
data packet is represented by a different colour to
illustrate the different trends. This diagnostic
approach provided a detailed perception of the
performance of the system in terms of latency under
different workload conditions. It is noticed that for the
configurations 1 to 4, the latency remained
HUCAPP 2024 - 8th International Conference on Human Computer Interaction Theory and Applications
562
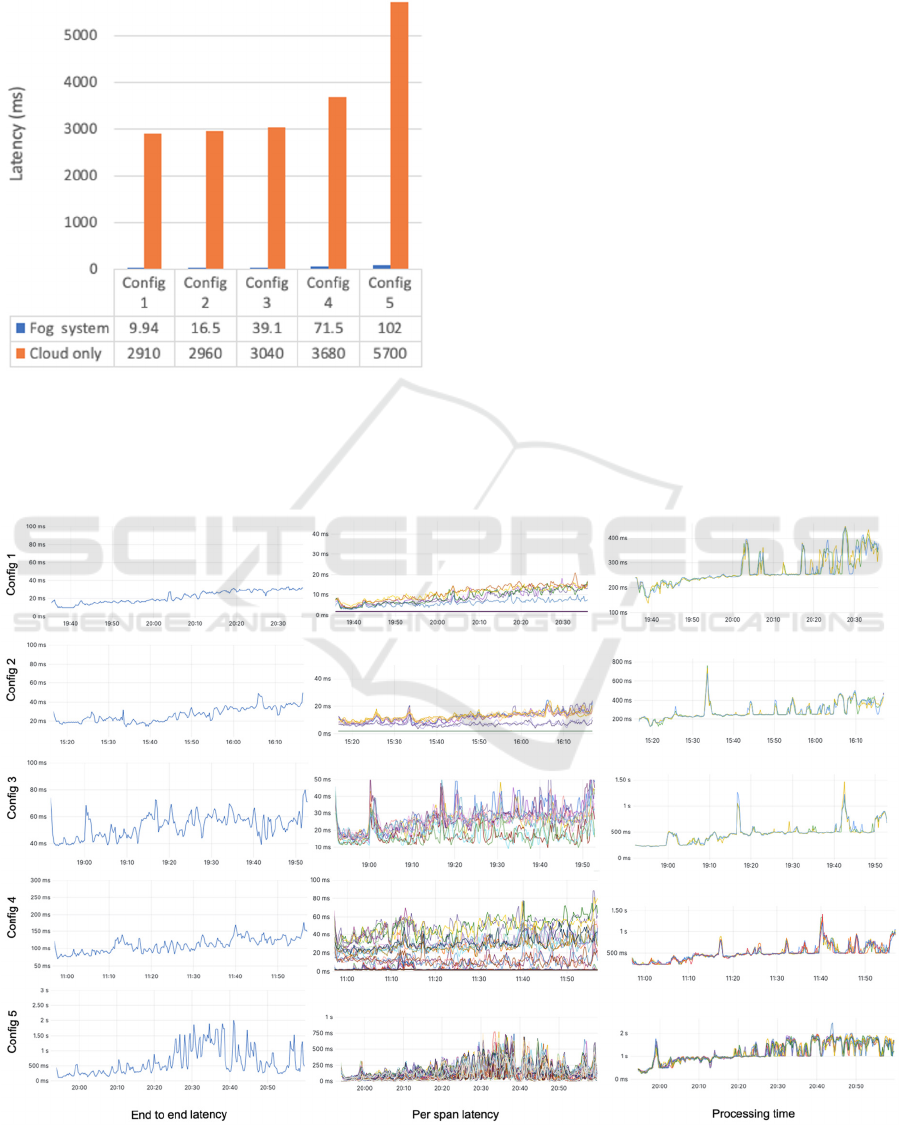
significantly low (less than 170 ms) and slightly
increased with the workload. However, in Config 5,
the latency starts scaling higher (up to 2 s).
Figure 6: End-to-End latency comparison between the
proposed system and cloud-only implementation.
Using the PromQL query
traces_spanmetrics_latency_bucket the
processing time taken by each data packet was
visualized in Grafana (Fig.8). Similar to the latency
evaluation, the processing time remained reasonably
stable (the average is less than 500 ms) for the four
the configurations 1, 2, 3 and 4. However, the
processing of data packets starts to slow down in the
configuration 5 (1.5 s in average).
5.2 Throughput and Resource
Utilization
The rate at which the data is successfully ingested
through the framework is commonly used throughput
in the performance evaluation of distributed systems.
In this research work presented in this paper, the
chosen throughput is the amount of data bytes
handled per second. Across the five configurations,
the throughput of the evaluated system was calculated
using the PromQL query
traces_spanmetrics_size_total. The
results of the observations across the different
scenarios are shown in Fig.9 in which different
colours represent different data packets handled. The
resource utilization metrics including CPU usage and
memory usage were calculated using the following
Figure 7: The End-to-end latencies, Per span latencies and processing time across the five configurations.
Performance Evaluation of Visual Analytics Framework for Monitoring Neuromotor Rehabilitation
563
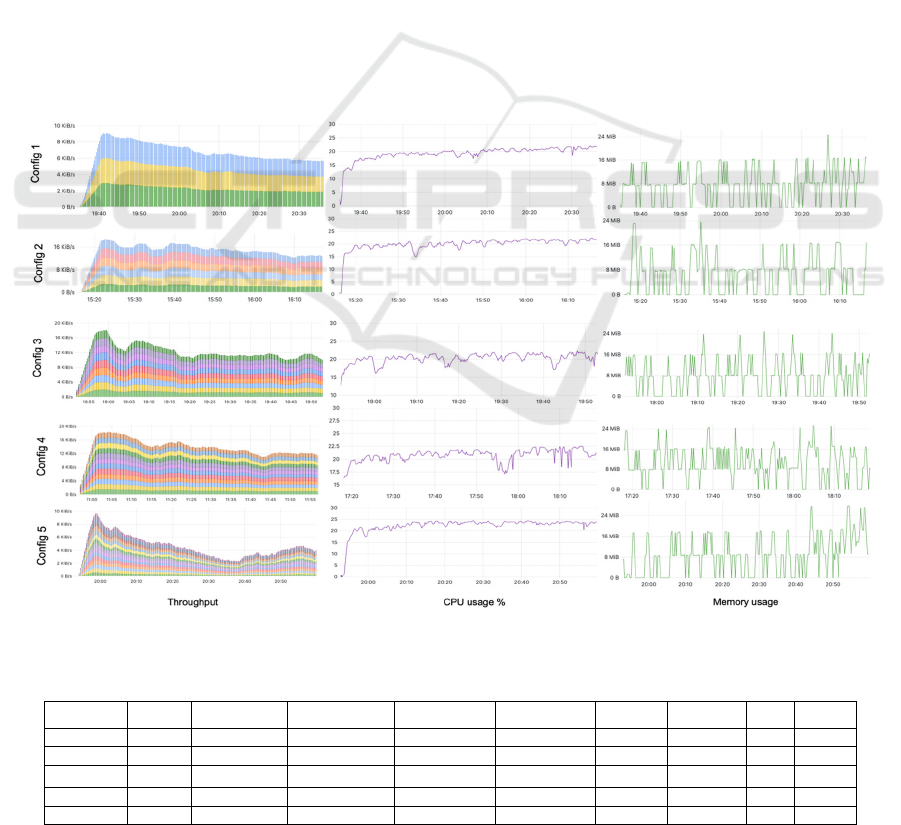
cAdvisor metrics:
container_cpu_usage_seconds_total and
container_memory_usage_bytes. The
graphs displayed in Fig.9 show the percentage of the
usage of CPU and Memory. Throughout the five
scenarios, the CPU usage remained under 25%, while
the memory usage did not exceed 24 MiB, which
reflects a stability in the usage of resources by the
system application. Table 2 Summarizes the
diagnostics values of the system performance metrics
across the five configurations. The included values
are samples of the instrumented spans latencies and
other metrics.
6 DISCUSSION
The performance evaluation of the proposed fog
based visual analytics framework was carried out
using OTel observability and performance metrics.
The evaluation procedure provided deep
understanding of the system’s behaviour and
capacity for handling different workloads. The
analysis of the latency results across different
configurations showed a significant trend of reduced
latency in the proposed system compared to the
cloud-only implementation. This confirms that the
proposed system operates with a low latency despite
the increase of the workload. It was also noticed that
the latency in the configuration 5 was relatively
increased but it remained limited compared to the
implementation based on cloud. The individual
latency per span showed that the time in the data
flow tends to evenly be consumed by the different
spans. The processing time is overall reasonable
despite the nature of the computing infrastructure
used for the evaluation. This indicated that the edge
and fog nodes requirements in term of
implementation devices are similar. The throughput
was consistently maintained across the four
configurations, but it has relatively decreased in
configuration 5. This showed that the system’s
handling capacity decreased in the workload of the
configuration 5. The results of CPU and memory
usages highlighted the system's efficiency across all
the defined configurations.
Figure 8: The Throughput, CPU and Memory usages across the five configurations.
Table 2: The metrics values across the five configurations.
Config
get_IMU
ms
MQTT_Publish
ms
MQTT_Subscribe
ms
Kafka_Producer
ms
Kafka_Consume
ms
Processing
ms
Throughput
KiB/s
CPU
%
Memory
MiB
Config 1 1.90 2.75 1.90 3.07 1.93 154 9.12 13.4 7.44
Config 2 1.91 7.08 1.91 6.78 1.95 168 18.5 16.4 15.6
Config 3 1.93 14.5 1.94 14.5 1.98 226 18.1 17.7 15.9
Config 4 6.74 30.6 7.19 29.4 3.68 251 17.8 20.8 23.3
Config 5 30.8 57.1 61.2 90.4 59.3 289 9.8 24.1 23.9
HUCAPP 2024 - 8th International Conference on Human Computer Interaction Theory and Applications
564

The findings stemming from the analysis of the
results was useful for the formulation of the following
answers to the research questions set in this research:
RQA1: The direct data streaming from the fog layer
to the monitoring layer without crossing the Cloud
has significantly reduced the system latency
compared to the Cloud-only approach. This
perspective is evident across various configurations,
showcasing the system's adaptability for real-time
visualization.
RQA2: With minimal computing capacities on a
macOS laptop and being accommodated with the
whole OTel evaluation structure, the proposed
framework showed stable performance in latency,
processing, and resource utilization across the
configurations 1, 2, 3 and 4. Thus, a capacity for
workload scalability. The minor limitations noticed in
the configuration 5 highlighted the experimental
setup constraint caused by using a single machine for
the whole system deployment. Furthermore, the
scalability and efficiency of the system can be further
enhanced in a distributed deployment in real-world
conditions. Previous approaches did not address
performance measurement using OpenTelemetry.
The framework developed in this research showed
lower latency despite the increase in streams. This
was confirmed by the significant difference in the
obtained latency compared to the results recorded by
(Asghar et al., 2021b) for analogous configurations:
452 ms and 1082 ms vs 9.94 ms and 16.5 ms.
It is also worth of mentioning that the proposed
framework was evaluated by conducting an
experiment design including a System Usability Scale
(SUS). The experiment provided qualitative and
quantitative data from a group of rehabilitation
experts and showed a good usability of the proposed
visual analytics framework. However, the details of
this study can be included in this paper due to the
limitation of space.
7 CONCLUSIONS
The main objective of this paper is to evaluate the
performance of visual analytics RPM framework
dedicated to neuromotor rehabilitation of stroke
survivors. The proposed framework is based on fog-
computing with new approach of splitting the data
stream into real-time and batch. The real-time stream
skips the Cloud layer and flows directly to the
monitoring layer, where the therapist interface for
data visualization was included. This approach was
evaluated in terms of latency and scalability.
Common evaluation techniques of fog-based systems
use simulation tools such as iFogSim. However, in
this paper the evaluation was performed using
observability and instrumentation through OTel. This
unified opensource framework helps in generating,
collecting, and transmitting telemetry data. Five
configurations were used by escalating the workload
for the evaluation of the proposed framework and for
obtaining deep insight into the behaviour of its
different components. The defined KPis for
evaluation were End-to-End latency, throughput,
processing time and resource utilization. The findings
suggested that the latency of the proposed system was
significantly low when compared to cloud-only
implementation. The scalability of the system was
reflected by its capacity of handling the increased
workload across different configuration scenarios.
Nevertheless, the minor limitations noticed in the
fifth configuration highlighted the experimental
setup's constraints imposed by using a single machine
for the whole system deployment. In future work, the
scalability and efficiency of the system will be further
enhanced by the implementation of a distributed
deployment in real-world conditions.
ACKNOWLEDGEMENTS
The authors acknowledge the contribution of the
French Ministry of Foreign Affairs and Campus
France in Morocco for their financial support to
conduct the research presented in this paper.
REFERENCES
Asghar, A., Abbas, A., Khattak, H. A., & Khan, S. U.
(2021). Fog Based Architecture and Load Balancing
Methodology for Health Monitoring Systems. IEEE
Access, 9(July), 96189–96200. doi: 10.1109/
ACCESS.2021.3094033
Averta, G., Barontini, F., Catrambone, V., Haddadin, S.,
Handjaras, G., Held, J. P. O., Hu, T., Jakubowitz, E.,
Kanzler, C. M., Kühn, J., Lambercy, O., Leo, A.,
Obermeier, A., Ricciardi, E., Schwarz, A., Valenza, G.,
Bicchi, A., & Bianchi, M. (2021). U-Limb: A multi-
modal, multi-center database on arm motion control in
healthy and post-stroke conditions. GigaScience, 10(6),
1–17. doi: 10.1093/gigascience/giab043
Bonomi, F., Milito, R., Zhu, J., & Addepalli, S. (2012). Fog
computing and its role in the internet of things. MCC’12
- Proceedings of the 1st ACM Mobile Cloud
Computing Workshop, 13–15. doi: 10.1145/
2342509.2342513
Performance Evaluation of Visual Analytics Framework for Monitoring Neuromotor Rehabilitation
565

Clark, B., Whitall, J., Kwakkel, G., Mehrholz, J., Ewings,
S., & Burridge, J. (2017). Time spent in rehabilitation
and effect on measures of activity after stroke. The
Cochrane Database of Systematic Reviews, 2017(3).
doi: 10.1002/14651858.CD012612
Das, J., Ghosh, S., Mukherjee, A., Ghosh, S. K., & Buyya,
R. (2022). RESCUE: Enabling green healthcare
services using integrated IoT-edge-fog-cloud
computing environments. Software - Practice and
Experience, 52(7), 1615–1642. doi: 10.1002/spe.3078
De Farias, F. A. C. D., Dagostini, C. M., Bicca, Y. D. A.,
Falavigna, V. F., & Falavigna, A. (2020). Remote
Patient Monitoring: A Systematic Review.
Https://Home.Liebertpub.Com/Tmj, 26(5), 576–583.
doi: 10.1089/TMJ.2019.0066
Documentation | OpenTelemetry. (n.d.). Retrieved from
https://opentelemetry.io/docs/
Gupta, H., Vahid Dastjerdi, A., Ghosh, S. K., & Buyya, R.
(2017). iFogSim: A toolkit for modeling and simulation
of resource management techniques in the Internet of
Things, Edge and Fog computing environments.
Software: Practice and Experience, 47(9), 1275–1296.
doi: 10.1002/SPE.2509
Liu, X., Fan, L., Xu, J., Li, X., Gong, L., Grundy, J., &
Yang, Y. (2019). FogWorkflowSim: An automated
simulation toolkit for workflow performance evaluation
in fog computing. Proceedings - 2019 34th IEEE/ACM
International Conference on Automated Software
Engineering, ASE 2019, 1114–1117. doi:
10.1109/ASE.2019.00115
Mahmud, R., Koch, F. L., & Buyya, R. (2018). Cloud-fog
interoperability in IoT-enabled healthcare solutions.
ACM International Conference Proceeding Series. doi:
10.1145/3154273.3154347
Saidi, H., Labraoui, N., Ari, A. A. A., & Bouida, D. (2020).
Remote health monitoring system of elderly based on
Fog to Cloud (F2C) computing. 2020 International
Conference on Intelligent Systems and Computer
Vision, ISCV 2020. doi: 10.1109/ISCV49265.
2020.9204096
Schwarz, A., Held, J. P. O., & Luft, A. R. (2020). Post-
stroke upper limb kinematics of a set of daily living
tasks. doi: 10.5281/ZENODO.3713449
Tolaram, N. (2023). cadvisor. Software Development with
Go, 347–376. doi: 10.1007/978-1-4842-8731-6_18.
HUCAPP 2024 - 8th International Conference on Human Computer Interaction Theory and Applications
566
