
Melanoma Classification Through Deep Ensemble Learning and
Explainable AI
Wadduwage Shanika Perera
a
, ABM Islam
b
, Van Vung Pham
c
and Min Kyung An
d
Department of Computer Science, Sam Houston State University, Huntsville, Texas, U.S.A.
Keywords: Melanoma Classification, Deep Learning, Deep Ensemble Learning, Explainable AI.
Abstract: Melanoma is one of the most aggressive and deadliest skin cancers, leading to mortality if not detected and
treated in the early stages. Artificial intelligence techniques have recently been developed to help
dermatologists in the early detection of melanoma, and systems based on deep learning (DL) have been able
to detect these lesions with high accuracy. However, the entire community must overcome the explainability
limit to get the maximum benefit from DL for diagnostics in the healthcare domain. Because of the black box
operation's shortcomings in DL models' decisions, there is a lack of reliability and trust in the outcomes.
However, Explainable Artificial Intelligence (XAI) can solve this problem by interpreting the predictions of
AI systems. This paper proposes a machine learning model using ensemble learning of three state-of-the-art
deep transfer Learning networks, along with an approach to ensure the reliability of the predictions by utilizing
XAI techniques to explain the basis of the predictions.
1 INTRODUCTION
The skin is the largest organ in the human body, and
approximately a third of the total number of cancer
cases are represented by skin cancers. Melanoma is
the deadliest form of skin cancer, which is responsible
for an overwhelming majority of skin cancer deaths.
The number of melanoma deaths is expected to
increase by 4.4% in 2023. Although the mortality is
significant, when detected early, the 5-year survival
rate for melanoma is over 99% (American Cancer
Society, 2022). Currently, the most accurate way to
diagnose melanoma is a biopsy. This is a penetrative
surgical procedure that involves higher costs but also
incorporates risks of developing various infectious
diseases (Lakhtakia et al., 2009). Thus, the usual
clinical practice of melanoma diagnosis is visual
inspection using Dermoscopy by dermatologists or
specially trained clinicians. This approach presents
challenges, primarily due to its resource-intensive
nature in terms of time and cost. This method's
accuracy of melanoma diagnosis is approximately
a
https://orcid.org/0009-0007-6123-1805
b
https://orcid.org/0000-0003-2610-7343
c
https://orcid.org/0000-0001-9702-8904
d
https://orcid.org/0000-0002-4571-5048
80%, and the results differ from one specialist to
another (Ichim et al., 2023).
Over the years, many non-invasive techniques
have emerged for diagnosing skin lesions to detect
melanoma. The focus has been mainly on automated,
computer-based approaches, due to their efficiency
and reduced susceptibility to errors. The newest trend
has been the using deep learning and neural networks
to detect and classify melanoma. Deep neural
networks (DNNs) are increasingly prevalent in
medical applications due to their capacity to address
complex problems. Automated melanoma diagnosis
using dermoscopy images provides a substantial
potential use for deep learning techniques. However,
melanoma detection is still challenging due to the
various characteristics in the dermoscopy images
such as low contrast, noise interference, and irregular
boarders. In addition, difficulties arise from the lack
of annotated data and class-imbalanced datasets.
Moreover, the black-box nature of the DNN’s
decision-making process challenges the
trustworthiness and reliability of the models. While
the existing automated artificial intelligence
Perera, W., Islam, A., Pham, V. and An, M.
Melanoma Classification Through Deep Ensemble Learning and Explainable AI.
DOI: 10.5220/0012575400003657
Paper published under CC license (CC BY-NC-ND 4.0)
In Proceedings of the 17th International Joint Conference on Biomedical Engineering Systems and Technologies (BIOSTEC 2024) - Volume 2, pages 263-274
ISBN: 978-989-758-688-0; ISSN: 2184-4305
Proceedings Copyright © 2024 by SCITEPRESS – Science and Technology Publications, Lda.
263
approaches can make accurate predictions, they might
lack transparency in explaining how they arrive at
those conclusions.
In this paper we propose a machine learning
framework to classify skin lesion images into
malignant (melanoma) and benign (non-melanoma)
classes, using ensemble learning of three state-of-the-
art Deep Transfer Learning Models, Resnet-101,
DenseNet-121, and Inception v3. Our goal is to
improve the accuracy of the classification of
melanoma using deep ensemble learning and to
explain the predictions using explainable artificial
intelligence (XAI) analysis that can aid the validation
and transparency of the results.
2 RELATED WORKS
The work done earlier in the time has more focused
on the segmentation of melanoma skin lesions,
however, most of the recent work has moved on from
segmentation and has focused on feature extraction
and classification of melanoma. Authors in (Li &
Shen, 2018) proposed two fully convolutional
residual networks for simultaneous segmentation and
classification. Research by (Harangi et al., 2018)
implemented an ensemble network of transfer learning
models AlexNet, VGG16, and GoogleNet for
classification. Authors in (Bisla et al., 2019) employed
a U-Net for segmentation and ResNet50 for melanoma
detection and classification. They have adapted two
Deep Convolutional generative adversarial networks to
generate images to overcome the class imbalance issue.
Authors in (Ali et al., 2019) avoided overfitting using
image augmentation and they used VGG19-UNet and
DeeplabV3+ for training.
Research by (Adegun & Viriri, 2020), proposed a
system using a single deep convolutional neural
network, based on an encoding-decoding principle to
robustly extract defining features of melanoma. The
encoder is responsible for learning general features
and location information. The decoder learns the
contour characteristics of melanoma. After extracting
the features, a pixel-level classifier divided the
lesions into two categories (melanoma and non-
melanoma) using SegNet, U-Net, and FCN. Research
by (Wei et al., 2020) developed a compact model
based on two DCNNs (Deep Convolutional Neural
Networks) MobileNet and DenseNet, which was
proposed for melanoma diagnosis. A classification
principle was introduced to improve detection
accuracy. Also, a compact U-Net model based on the
feature extraction module was proposed to segment
the lesion area as precisely as possible.
Authors in (Xie et al., 2021) proposed a Multi-
scale Convolutional Neural Network (CNN) that was
implemented for melanoma classification. They have
achieved significant performance by simultaneously
inputting images of two scales into the network. A
comparative analysis was done by (Sharma et al.,
2022) where they compared the performance of
transfer learning models such as VGG16, Vgg19,
DenseNet-121, and ResNet-101. They used
Adversarial training to generate synthetic data.
Authors in (Ichim et al., 2023) used an ensemble
learner of MobileNet, DenseNet-121, and DenseNet-
169 for skin lesion classification. They have used
weighted averaging and horizontal voting for
ensemble learning. Authors in (Nandhini et al., 2023)
extracted features from dermoscopy images using
VGG16 and used the Random Forest algorithm to
classify them.
While most of the studies focus on enhancing the
accuracy of the models overlooking the aspect of
assuring interpretability of their models, we focus on
building a model considering the limited availability
of data and amplifying model’s explainability.
3 DATASETS
In this study dermoscopy images from the ISIC
Challenge 2020 dataset and the ISIC Challenge 2019
dataset were used. The ISIC 2020 dataset includes
33,126 training images with metadata, and the ISIC
2019 dataset includes 25,331 training images with
metadata. The images are labelled as malignant/
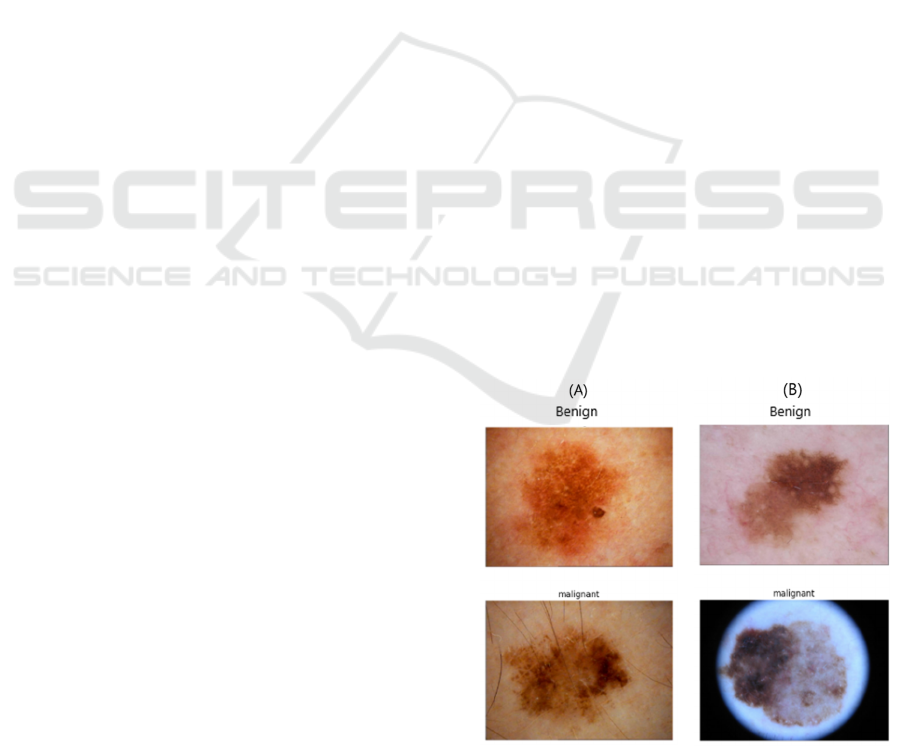
melanoma and benign/ non-melanoma (Figure 1).
Figure 1: Examples of dermoscopy images of skin lesions
from (A) ISIC 2020 dataset and (B) ISIC 2019 dataset.
HEALTHINF 2024 - 17th International Conference on Health Informatics
264
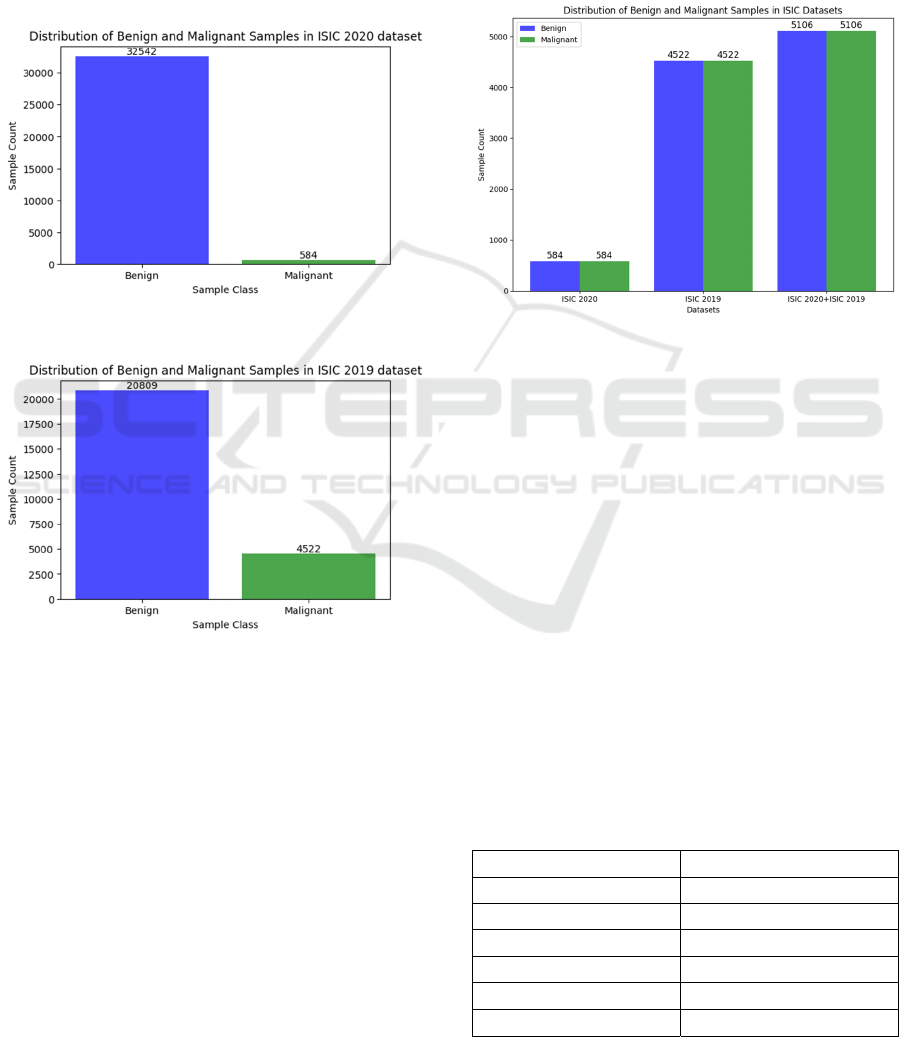
ISIC 2020 dataset includes 32,542 benign images,
584 malignant images, and 27,124 images with
unknown diagnoses. In this dataset, the malignant
class counts for 1.8% of the whole dataset, indicating
an extreme degree of class imbalance (Figure 2). ISIC
2019 dataset includes 20,809 benign images, 4,522
malignant images and, 0 images with unknown
diagnoses. In this dataset, the malignant class counts
for 17.8% of the whole dataset which also indicates
an extreme degree of class imbalance (Figure 3).
Figure 2: Class imbalance in ISIC 2020 dataset.
Figure 3: Class imbalance in ISIC 2019 dataset.
4 METHODOLOGIES
In this study, we implemented an ensembled
framework of three state-of-the-art deep transfer
learning neural networks, ResNet-101, Densenet-
121, and InceptionV3, using a weighted average
ensemble method with explainability. The
methodology mainly involved five phases.
4.1 Data Preparation
As the first step of data preparation, the images of
which the diagnosis is unknown were removed from
the ISIC 2020 dataset. Then to overcome the class
imbalance, ISIC 2020 and ISIC 2019 datasets were
balanced by down sampling the majority class, which
is the benign class, separately in two datasets and
eventually combining the images of two classes
(Figure 4). The final balanced dataset that was used
in our work included a total of 10,212 images, where
5,106 images were benign, and 5,106 images were
malignant.
Figure 4: Balanced datasets.
4.2 Image Pre-Processing
Most of the images exhibited variation in quality in
terms of lighting, resolution, and focus. Notably, the
degree of dissimilarity between the characteristics of
the skin lesion and the surrounding healthy skin was
low in a considerable number of images. This fact is
evident in the original images in Figure 5. Poor image
quality can affect the performance of classification
algorithms. Thus, the training images were enhanced
using different techniques (Table 1) available in the
Python Imaging Library (PIL) and OpenCV (Open-
Source Computer Vision Library). The values for the
factors were derived from experiments. Additionally,
the images were centre cropped to mitigate position
variations and normalized to eliminate redundant data
and data modification errors as well as to reduce the
training time.
Table 1: Image pre-processing and values used.
Pre-processing Factor/Value used
Colour enhancement 1.2
Sharpness enhancement 25.0
Brightness enhancement -20
Contrast enhancement 1.5
Center cropping 0.75 of height and width
Normalization Divided by 255
Melanoma Classification Through Deep Ensemble Learning and Explainable AI
265
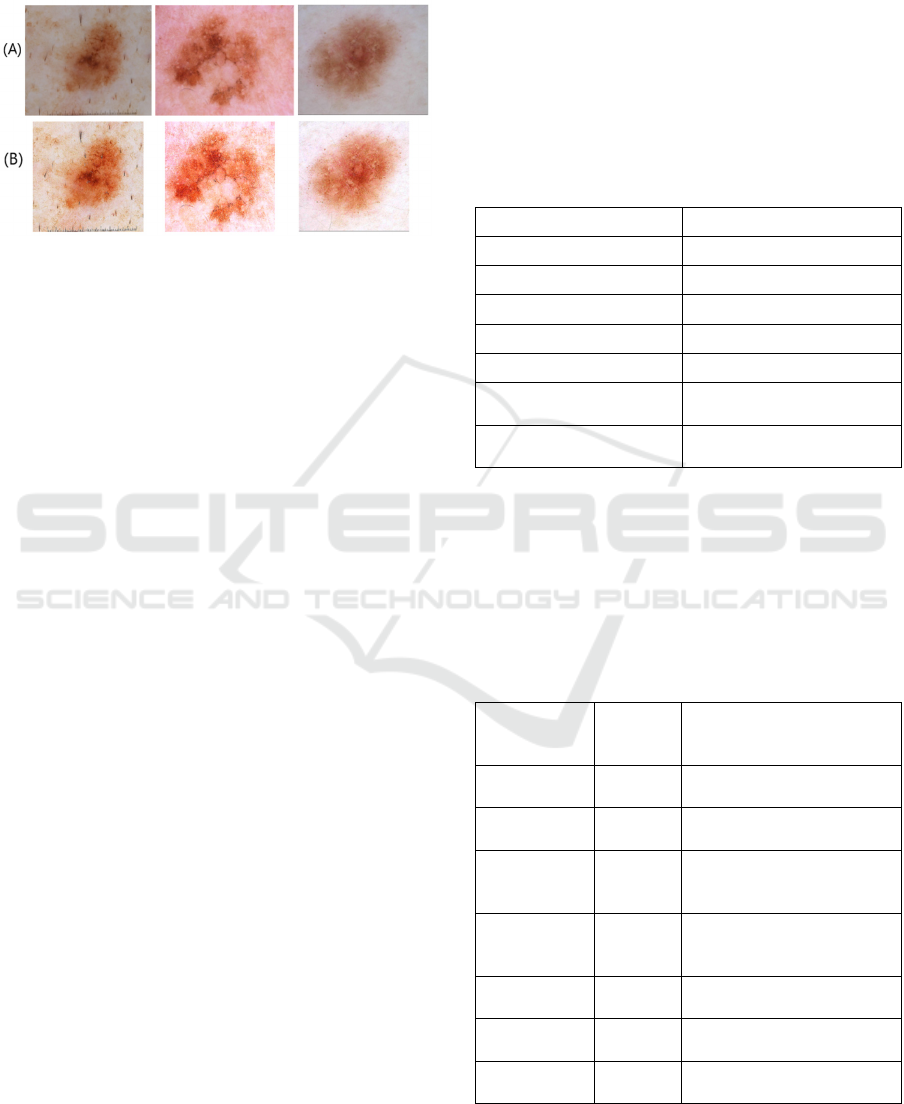
The dissimilarity or the differentiability between
the characteristics of the skin lesions and the
surrounding healthy skin improved after applying the
above enhancements (Figure 5).
Figure 5: (A) Original images vs (B) pre-processed images.
4.3 Training Deep Learning Models
Five different transfer learning deep learning neural
networks were trained and fine-tuned to select the
best candidates as the base models for the proposed
ensemble framework. They are VGG-19, ResNet-50,
ResNet-101, DenseNet-121 and Inception v3.
VGG-19 architecture was proposed by (Simonyan
& Zisserman, 2015), and it is a convolutional neural
network (CNN) that is 19 layers deep which consists
mainly of convolutional layers, followed by max-
pooling layers for down sampling. In addition, the
ResNet-50 and ResNet-101 proposed by (He et al.,
2016) are based on residual learning frameworks.
Residual blocks contain skip connections that allow
the gradient to flow directly through the network,
addressing the vanishing gradient problem. Besides,
ResNet-50 consists of 50 convolutional layers and
ResNet-101 consists of 101 of the same. Nonetheless
the DenseNet-121 architecture proposed by (Huang et
al., 2017) is characterized by its dense connectivity
pattern with skip connections. DenseNet concatenates
feature maps from different layers, leading to a more
compact and computationally efficient network. The
architecture has 121 trainable layers and is parameter
efficient compared to other deep architectures.
Inception v3, also known as GoogleNet v3, proposed
by Szegedy et al., 2016) is characterized by its unique
inception modules designed to capture features of
multiple scales and resolutions. Inception modules
combine different convolutional filter sizes within the
same layer.
Transfer learning was used to train all the
networks that were pre-trained using ImageNet
dataset. Thus, all the images were rescaled to the size
224x224x3 as expected by the pre-trained models. All
the pre-trained networks were loaded without the top
output layers and custom fully connected output
layers were added to make the predictions. For the
custom fully connected layers, the Rectified Linear
Unit (ReLU) activation function was used, and
regularization was applied to the weights of the layers
to eliminate overfitting. Both L1 and L2
regularization were used to further control overfitting.
The networks were fine-tuned using different sets of
hyperparameters. The best-performing values of the
hyperparameters used to fine-tune the base learners
during the training experiments are shown in Table 2.
Table 2: Hyperparameters used for training base learners.
Hyperparameter Value used
Batch size 64
Optimizer Adam
Loss function Categorical Cross Entropy
Learning rate 0.0001
Number of total epochs 1000
Early stop patience
(
number of e
p
ochs
)
100
Activation function of
the out
p
ut la
y
e
r
Softmax
We applied online data augmentation to the
training dataset to increase training data and
overcome overfitting by exposing the model to a
variety of data. We used different augmentation
parameters, as shown in Table 3. The resulting
augmented images after applying the augmentations
on a sample image are illustrated in Figure 6.
Table 3: Data augmentation parameters and values used.
Data
Augmentation
Paramete
r
Value used Effect on images
Horizontal
fli
p
True
Random flip through
horizontal axis
Vertical flip True
Random flip through
vertical axis
Rotation 90
Rotation in the range of -90
to 90 while filling on the
nearest
p
ixels
Zoom 0.3
Random in and out zoom,
in the proportion of 0.3
from the centre
Shear 0.1
Stretch image angle by
factor of 0.1
Width shift 0.1
Vertical random shift by
0.1
Height shift 0.1
Horizontal random shift by
0.1
HEALTHINF 2024 - 17th International Conference on Health Informatics
266
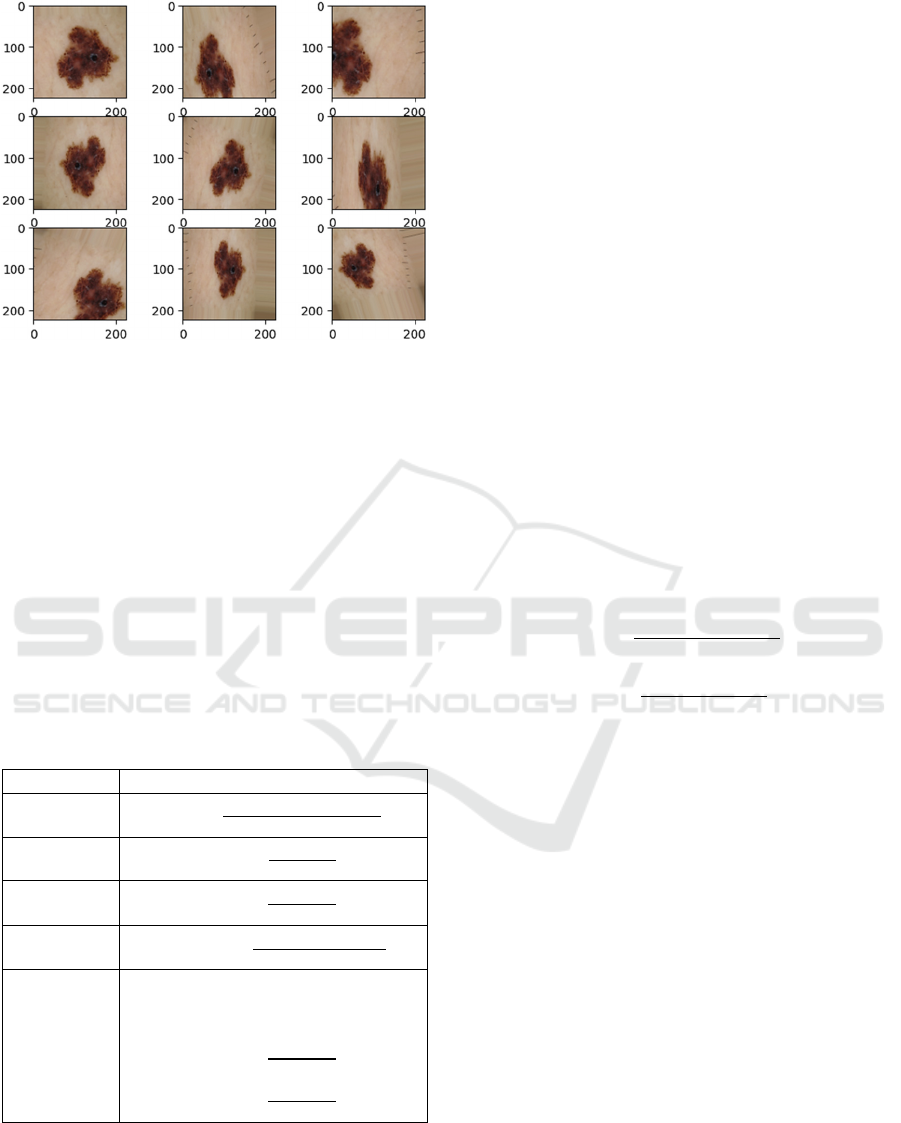
Figure 6: Different augmentations applied on a sample
image.
The metrics that were calculated for the
evaluation of the performance of the models are
Accuracy (ACC), Precision (PRE), Recall/Sensitivity
(REC), F1 score, and Area under the Receiver
Operating Characteristic (ROC) curve (ROC-AUC
score) as shown in Table 4. TP is the count of the true
positive predictions, TN is the count of true negative
predictions, FP is the count of false positive
predictions and FN is the count of false negative
predictions. Based on the model accuracy and the
ROC-AUC score, three base learners were chosen
from the experimented neural networks to build the
ensemble framework.
Table 4: Evaluation Metrics.
Metric Formula
Accuracy
𝐴𝐶𝐶 =
𝑇𝑃 + 𝑇𝑁
𝑇𝑃 + 𝑇𝑁 + 𝐹𝑃 + 𝐹𝑁
Precision
𝑃𝑅𝐸 =
𝑇𝑃
𝑇𝑃 + 𝐹𝑃
Recall
(Sensitivity)
𝑅𝐸𝐶 =
𝑇𝑃
𝑇𝑃 + 𝐹𝑁
F1-score
𝐹1 𝑠𝑐𝑜𝑟𝑒 =
2 .𝑇𝑃
2 .𝑇𝑃 + 𝐹𝑃 + 𝐹𝑁
ROC-AUC
score
𝐴𝑈𝐶 − 𝑅𝑂𝐶 𝑠𝑐𝑜𝑟𝑒
= 𝑅𝑂𝐶 𝐶𝑢𝑟𝑣𝑒 (𝑇𝑃𝑅 𝑣𝑠.𝐹𝑃𝑅) 𝑑(𝐹𝑃
𝑅
where,
𝑇𝑃𝑅 =
𝑇𝑃
𝑇𝑃 + 𝐹𝑁
𝐹𝑃𝑅 =
𝐹𝑃
𝐹𝑃 + 𝑇𝑁
4.4 Ensemble Learning
Ensemble learning combines the predictions of
multiple individual base learners to create a stronger,
more robust model by limiting the variance and the
bias issues associated with single learners with
improved performance and generalization (Mienye &
Sun, 2022). In our work, different fusion mechanisms
of combining the predictions from the individual base
learners were experimented on to find the ensemble
method that best performs in classifying melanoma
images. We experimented with the following four
fusion methods.
4.4.1 Hard Majority Voting
In hard majority voting, the final class label is the
class label (c) that is most frequently predicted by the
base models (1).
ŷ
=𝑚𝑜𝑑𝑒
(
𝑐
,𝑐
,𝑐
)
(1)
4.4.2 Probability Averaging/ Soft Majority
Voting
In probability averaging or soft majority voting, the
maximum averaged confidence/probability is used to
decide the final class prediction. The probabilities are
obtained, m for the malignant class (2) and b for the
benign class (3), and the final prediction is based on
the highest probability (4).
𝑚
=
𝑚
+𝑚
+𝑚
3
(2
)
𝑏
=
𝑏
+𝑏
+𝑏
3
(3
)
ŷ
=𝑎𝑟𝑔𝑚𝑎𝑥𝑏
,𝑚
(4
)
4.4.3 Max Rule Ensemble Method
The classifier's prediction, which gives the maximum
confidence score, is picked in the max rule ensemble
method. Confidence scores are obtained, m for the
malignant class (5) and b for the benign class (6), and
the final prediction is based on the highest probability
(7).
𝑚
=𝑚𝑎𝑥
(
𝑚
,𝑚
,𝑚
)
(5
)
𝑏
=𝑚𝑎𝑥
(
𝑏
,𝑏
,𝑏
)
(6
)
ŷ
=𝑎𝑟𝑔𝑚𝑎𝑥𝑏
,𝑚
(7
)
4.4.4 Weighted Probability Averaging
In weighted probability averaging, different weights
are assigned to each classifier before calculating the
average. Weighted average predictions are calculated,
m for the malignant class (8) and b for the benign
class (9), and the final prediction is based on the
Melanoma Classification Through Deep Ensemble Learning and Explainable AI
267
highest probability (10). The weights for three
different models are w1, w2 and w3.
𝑚
=
𝑤
×𝑚
+𝑤
×𝑚
+𝑤
×𝑚
𝑤
+𝑤
+𝑤
(8)
𝑏
=
𝑤
×𝑏
+𝑤
×𝑏
+𝑤
×𝑏
𝑤
+𝑤
+𝑤
(9)
ŷ
=𝑎𝑟𝑔𝑚𝑎𝑥𝑏
,𝑚
(10)
The weighted average ensemble method is a
highly effective fusion mechanism that is widely
used. However, choosing the weights allocated to the
individual base learners is a critical factor that
significantly influences the ensemble’s overall
performance and success. Most approaches in
literature set the weights experimentally or solely
based on the accuracy of the base learners. (Kaleem
et al., 2023). However, other evaluation measures,
such as precision, recall, f1-score, and ROC-AUC
score, also provide robust information for
determining the importance of the base learners
(Mabrouk et al., 2022). Thus, considering all the
metrics in this study, we experimented with the
Hyperbolic Tangent function to compute weights for
our proposed ensemble framework.
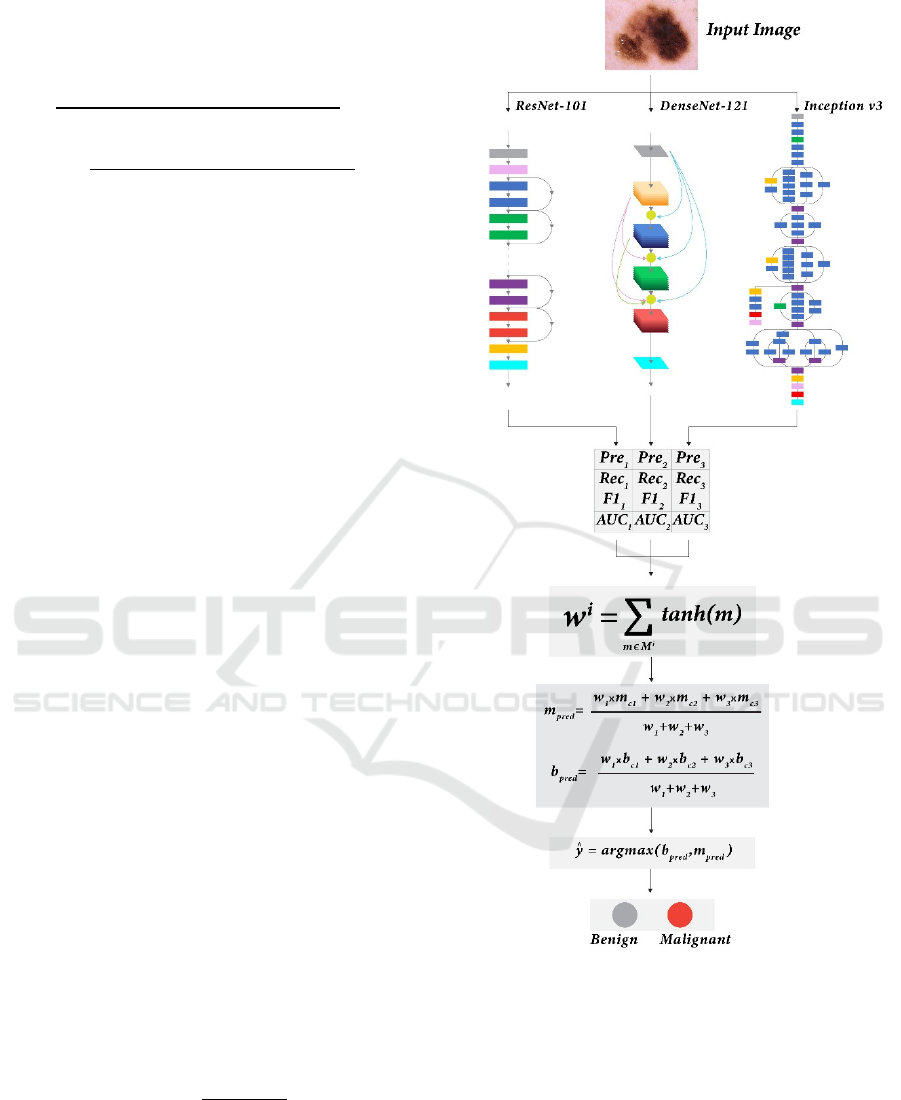
For the i
th
model of the proposed ensemble
framework (Figure 7), predictions were generated and
compared with the true labels of the test set and the
performance measures were calculated, such as
precision (pre
i
), recall (rec
i
), f1-score (f1
i
), and ROC-
AUC score (auc
i
). The weight of the i
th
base learner
(w
i
) was computed using the Hyperbolic Tangent
function (11). The range of the hyperbolic tangent
function is (0-0.762), while m represents an
evaluation metric, of which the values are in the range
0-1. It monotonically increases in this range; hence, if
the value of a metric m is high, the function
acknowledges it by rewarding the weight, granting
greater significance to the corresponding model;
otherwise, penalizing it.
𝑀
=𝑝𝑟𝑒
,𝑟𝑒𝑐
,
𝑓
1
,𝑎𝑢𝑐
𝑤
= tanh (𝑚)
∈
(11)
=
𝑒
−𝑒
𝑒
+𝑒
∈
The evaluation metrics mentioned in Table 4 were
used to evaluate and compare the final ensemble
framework.
Figure 7: Proposed Ensemble learning framework.
4.4.5 Using SHAP for Explanation
To explore and highlight the features of the skin
lesion images that contributed to the outcomes of our
prediction models, we used SHapley Additive
exPlanations (SHAP) analysis (Lundberg & Lee,
2017; Shakeri et al., 2021) which is a model-
dependent technique. In computer vision, the SHAP
values determine how much each image feature (i.e.,
regions, edges) contributes to the target prediction in
both positive and negative directions. While most of
HEALTHINF 2024 - 17th International Conference on Health Informatics
268
the existing feature analysis techniques calculate the
global importance of the features, the SHAP approach
calculates the importance of local features for each
dataset image and assigns each feature an importance
value for a specific prediction. This approach can
address the inconsistency problems in existing feature
importance techniques and mitigate the effect of
misinterpretations associated with these
inconsistencies (Ian et al., 2020).
In our study, SHAP values were computed using
the gradient explainer for the ensemble framework's
output feature map of each base learner. We used the
gradients of the base model's output feature map
concerning its input features to approximate SHAP
values, which provided a fair distribution of the
contribution of each feature towards the prediction for
a specific instance image. Then, the SHAP values
were visualized on summary plots for analysis.
5 RESULTS AND DISCUSSION
In this section, we present the results in three sections:
performance of the base classification models,
performance of ensemble learning, and elaboration on
the efficacy of SHAP analysis in explaining the
prediction results.
5.1 Results of Base Learners
Table 5 displays the average values of the evaluation
metrics gained by training various candidate base
neural networks using a 4-fold cross-validation
procedure. The networks with the highest accuracy
and ROC-AUC values, Resnet-101, DenseNet-121,
and Inception v3, were selected as the base models for
constructing our ensemble framework.
Table 5: Performance of the candidate base models for
ensemble learning.
Model ACC
(%)
PRE
(%)
REC
(%)
F1-
score
(%)
ROC-
AUC
score
Vgg-19 73.47 77.68 66.70 71.77 0.82
ResNet-50 77.35 68.87 94.54 79.69 0.82
ResNet-
101
80.91 82.53 78.11 80.26 0.90
DenseNet-
121
83.90 81.09 87.92 84.37 0.91
Inception
v3
81.40 81.63 80.49 81.06 0.89
The best-performing ResNet-101 model for the test
dataset achieved a ROC-AUC score of 0.90,
indicating a good separability between the two classes
(Table 5). The best-performing DenseNet-121 model
for the test dataset obtained the highest accuracy
(83.90%) and the highest ROC-AUC score (0.91),
indicating the best separability between the two
classes. The best-performing Inception v3 model for
the same test dataset obtained an accuracy of 81.40%,
which is less than DenseNet-121 but better than
ResNet-101, yet the lowest ROC-AUC score of 0.89
indicating the weakest separability between the two
classes compared to the other two learners.
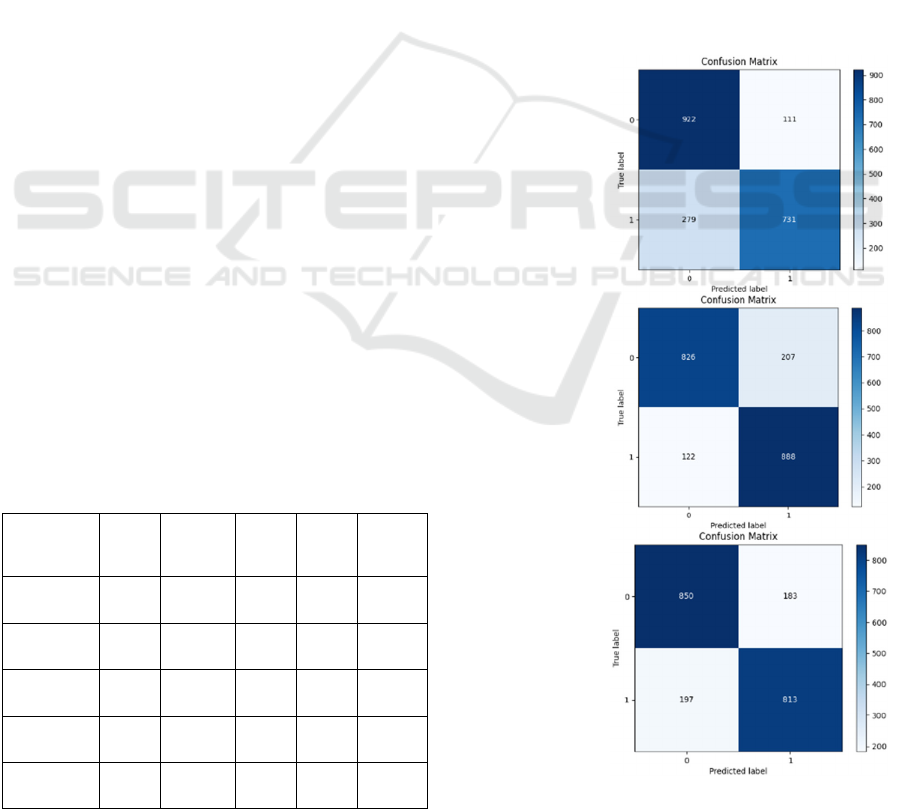
The confusion matrices (Figure 8) show that the
ResNet-101 model demonstrated the lowest FP count,
and the DenseNet-121 model resulted in the
minimum FN count comparatively during the testing
process. However, the Inception-v3 model
maintained fewer amounts for both FP and FN counts
(Figure 8).
ResNet-101
DenseNet-121
Inception v3
Figure 8: Confusion Matrices of the best performing
models.
Melanoma Classification Through Deep Ensemble Learning and Explainable AI
269
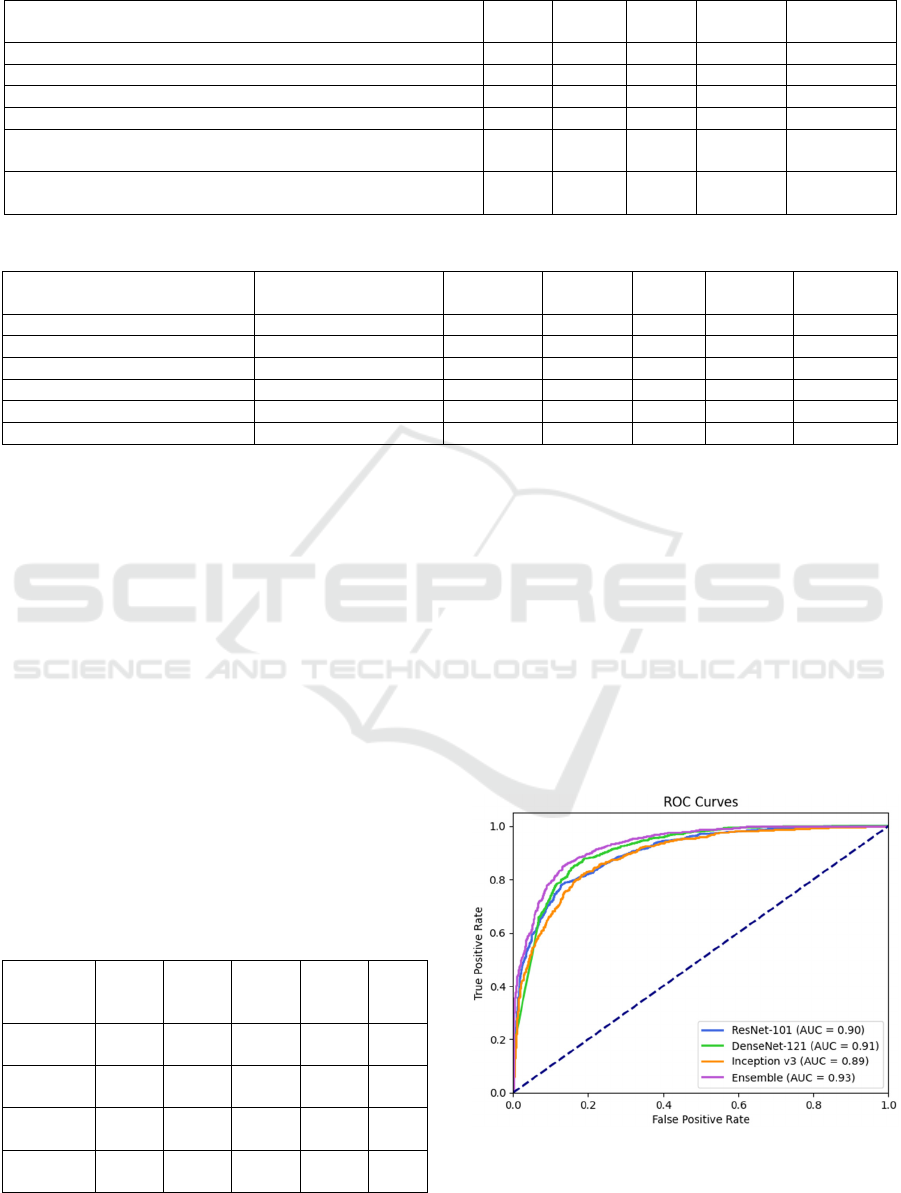
Table 6: Performance of different ensemble fusion methods.
Ensemble Method ACC
(%)
PRE
(%)
REC
(%)
F1-score
(%)
ROC-AUC
score
Hard majority voting 84.09 85.49 81.68 83.54 0.91
Soft majority voting/ Probability averaging 85.61 87.06 83.27 85.12 0.91
Max rule 85.02 86.67 82.38 84.47 0.91
Wei
g
hted avera
g
e with ACC as wei
g
hts 85.46 86.94 83.07 84.96 0.92
Weighted average with weights computed with tanh using
ACC, PRE, REC, F1 and ROC-AUC scores
85.46 86.94 83.07 84.96 0.92
Weighted average with weights computed with tanh using only
PRE, REC, F1 and ROC-AUC scores
85.80 86.58 84.36 85.46 0.93
Table 8: Comparison with previous work.
Authors Dataset ACC (%) PRE (%) REC
(%)
F1-score
(%)
ROC-AUC
score
(Gessert et al., 2020) ISIC 2019 n/a n/a 59.40 n/a 0.928
(Setiawan, 2020) ISIC 2019 84.76 n/a n/a n/a n/a
(
Zhan
g
, 2021
)
ISIC 2020 n/a n/a n/a n/a 0.917
(
Kaur et al., 2020
)
ISIC 2016, 2017, 2020 82.95 n/a 82.99 n/a n/a
(
Moazen & Jamzad, 2020
)
ISIC 2019 84.86 n/a 84.85 46.82 n/a
Proposed method ISIC 2019, 2020 85.80 86.58 84.36 85.46 0.93
5.2 Results of the Ensemble Learning
Framework
Table 6 shows the evaluation of the ensemble
learning with the five different experimental fusion
mechanisms. The fusion method that performed best
was the weighted averaging with the weights obtained
from the hyperbolic tangent function using only
precisions, recalls, f1-scores, and ROC-AUC scores
of the base models, which gained the highest accuracy
(85.80%) and highest ROC-AUC score (0.93). Thus,
weighted averaging was chosen for the proposed
ensemble framework.
The proposed ensemble learning method
improved (Table 7) the overall accuracy by 1.9% and
ROC-AUC score by 2% compared to the best-
performing individual base learner (DenseNet-121),
Table 7: Performance of the base models and the proposed
ensemble framework.
Model ACC
(%)
PRE
(%)
REC
(%)
F1-
score
(%)
ROC-
AUC
score
ResNet-
101
80.91 82.53 78.11 80.26 0.90
DenseNet-
121
83.90 81.09 87.92 84.37 0.91
Inception
v3
81.40 81.63 80.49 81.06 0.89
Proposed
metho
d
85.80 86.58 84.36 85.46 0.93
in classifying melanoma images into malignant and
benign cases in ISIC 2020 and ISCI 2019 datasets.
Figure 9 illustrates the ROC curves of the base
learners and the proposed ensemble framework based
on the predictions for malignant melanoma. The
proposed ensemble framework performs better than
the individual networks in distinguishing malignant
melanoma from benign/non-melanoma cases. The
ensemble model demonstrates robustness through the
smooth ROC curve (Figure 9) and its comparatively
high AUC score value. It underscores the proposed
model’s ability to maintain predictive accuracy
consistently regardless of the chosen threshold.
Figure 9: ROC curves of the base learners and ensemble
learner.
HEALTHINF 2024 - 17th International Conference on Health Informatics
270
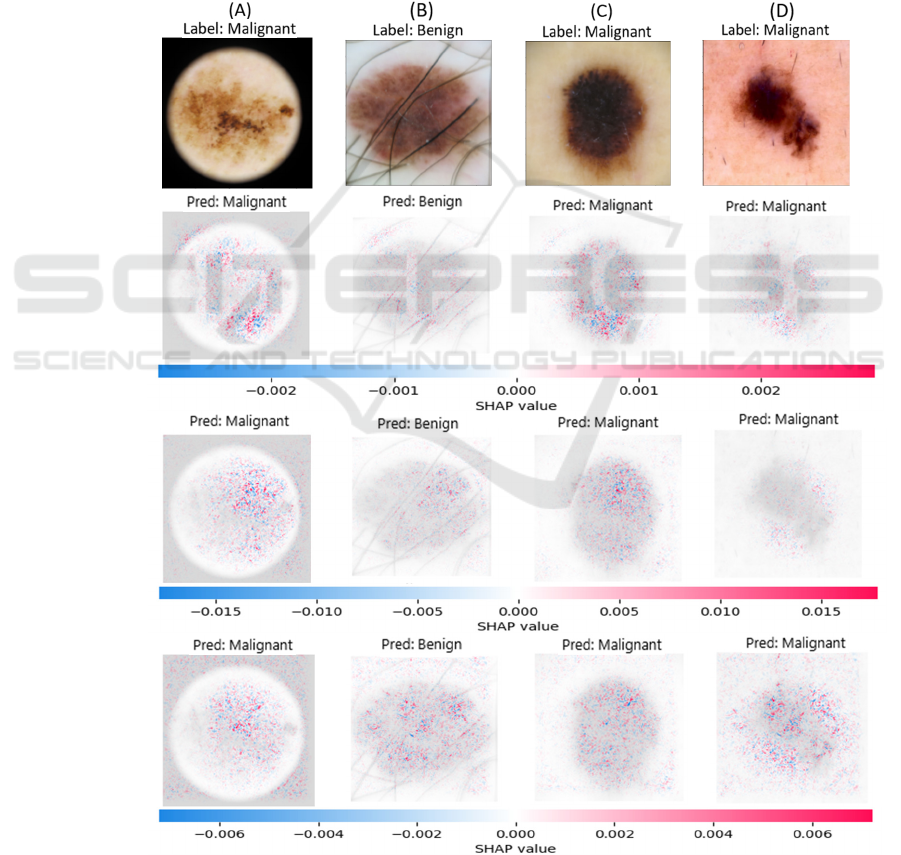
Table 8 shows comparisons with some previous
work which are outperformed by the proposed
ensemble framework in classifying melanoma images.
5.3 Results of SHAP Analysis
In the visual representations of the SHAP analysis,
pixels that correspond to the features with higher
SHAP values that have a higher impact on the model's
output were coloured in red, while those of the
features with lower SHAP values that have a lower
impact were coloured in blue. The visual
representations of the SHAP analysis results for the
predictions made by three base models for four
sample images (A, B, C, D) are shown in Figure 10.
For all the models (Figure 10), the correct regions
of interest in the sample images that can differentiate
the skin lesions from the surrounding healthy skin are
highlighted in red, and it shows that the relevant
regions significantly contributed to the predictions of
the models. This helps to increase the trustworthiness
of the model. Notably, different regions of the skin
lesions have impacted the outputs of the three
different base models, which is evident in the results
of sample C. In the resulting visual representations of
the SHAP values for sample C, ResNet-101 model
has given more attention to the features and edges in
the bottom part of the skin lesion, while DenseNet-
Figure 10: SHAP explanations for predictions of three base learners for samples (A), (B), (C) and (D).
Original image
ResNet-101
DenseNet-121
Inception v3
Melanoma Classification Through Deep Ensemble Learning and Explainable AI
271

121 model has considered the characteristics at the
right top region of the skin lesion. For sample C,
Inception v3 model has considered features from all
over the skin lesion without demonstrating a specific
pattern. This behaviour of Inception v3 model can be
observed for all the samples A, B, C, and D.
The visual representations of the SHAP results for
the DenseNet-121 model exhibit a reduced dispersion
of coloured pixels and a distinctly sharper emphasis
on relevant features compared to other models
(Figure 10). Moreover, the highest SHAP value
(0.015) of the features that contribute positively
towards the DenseNet-121 model's outcome is higher
than that of the other models (Figure 10). This
provides an explanation for the Densent-121 model’s
high prediction accuracy compared to the other
models.
When considering the results for sample A
(Figure 10), for all three models, pixels around the
edge of the circular microscopic effect are coloured
in a mix of red and blue. Thus, it is evident that the
microscopic effect in the image has both positively
and negatively impacted the outcome of all the
models. In the top left region of the SHAP results for
sample B (Figure 10), the pixels around a hair that
circularly curves around the lesion are coloured
redder, indicating that the feature has impacted the
prediction of the models. Similarly, in sample C
(Figure 10) results, a pattern of red-coloured pixels
can be seen forming a circular effect around the skin
lesion. The models might have misinterpreted the
vignetting effect in sample C as a microscopic effect
around the skin lesion. Thus, it is evident that
unrelated features like microscopic effects have
influenced the final predictions of the models.
Moreover, as seen in the results for sample B
(Figure 10), the hair atop the surface of the skin lesion
is highlighted in red with higher SHAP values, thus
hair has increased the probability of the class
predicted for sample B. However, the hair located
outside the skin lesion is not highlighted for any of
the models; thus, it can be concluded that occlusion
that overlaps with the region of interest had more
potential to contribute to the model predictions than
occlusion outside the region of interest in this study.
In the results for all the samples, red and blue pixels
can be seen scattered all over the surrounding healthy
skin and it is apparent that the features of the
surrounding healthy skin play a vital role in
influencing the model output. Hence, image pre-
processing that can remove significant features or
occlusion in the surroundings and the region of
interest can improve the performance and, most
importantly, the reliability of the model.
6 CONCLUSIONS
Melanoma is the most lethal skin cancer type, and
distinguishing between melanocytic skin lesions and
melanoma in the early stages is challenging. This
study provides a deep ensemble learning framework
to diagnose and classify melanoma dermoscopy
images with explainability. The framework's
performance has been extensively evaluated using the
well-recognized and publicly available datasets: ISIC
2029 and ISIC 2020. While imbalanced data and lack
of labelled data are significant challenges in skin
lesion classification, we have proved that with a small
dataset, melanoma classification can be accomplished
with competitive results by transfer learning pre-
trained models. Using the weighted averaging
ensemble method boosted the performances of the
individual learners. SHAP explanations of the
model's outcomes confirm the trustworthiness of the
models by highlighting the correct regions of interest.
The explanations demonstrated that the different
models focus on different regions of the skin lesion to
make the decision of classification, unveiling an
additional advantage of using an ensemble method.
Moreover, the explanations of the models prove that
occlusions such as skin hair and unrelated image
features such as circular microscopic effects impact
the models' outcomes, indicating misinterpretation of
the features of images.
Future work will focus on further improvement of
the framework's performance, especially concerning
the sensitivity (recall) enrichment. Sensitivity, which
signifies the true positive rate, strongly influences the
count of false negative cases (type II error).
Therefore, enhancing sensitivity holds a significant
importance within this study, given its direct
relevance to medical decision-making. Additionally,
occlusion removal and applying additional image pre-
processing, such as lesion segmentation and colour
calibration, to improve the image quality can improve
the base learners' performance. The forthcoming
research will also centre around validating the
explanations of the model's output against the clinical
features of dermoscopy images used by
dermatologists to diagnose melanoma.
REFERENCES
American Cancer Society. (2022). Cancer Facts and
Figures 2023. https://www.cancer.org/research/cancer-
facts-statistics/all-cancer-facts-figures/2023-cancer-
facts-figures.html.
HEALTHINF 2024 - 17th International Conference on Health Informatics
272

Lakhtakia, R., Mehta, A., & Nema, S. (2009). Melanoma :
A frequently missed diagnosis. Medical Journal Armed
Forces India, 65(3), 292–294. https://doi.org/10.1016/
s0377-1237(09)80036-1.
Ichim, L., Mitrică, R. I., & Popescu, D. (2023). Detection
of melanomas using ensembles of deep convolutional
Neural Networks. 2023 13th International Symposium
on Advanced Topics in Electrical Engineering (ATEE).
https://doi.org/10.1109/atee58038.2023.10108394.
Li, Y., & Shen, L. (2018). Skin lesion analysis towards
melanoma detection using Deep Learning Network.
Sensors, 18(2), 556. https://doi.org/10.3390/s18020556
Harangi, B., Baran, A., & Hajdu, A. (2018). Classification
of skin lesions using an ensemble of Deep Neural
Networks. 2018 40th Annual International Conference
of the IEEE Engineering in Medicine and Biology
Society (EMBC). https://doi.org/10.1109/embc.20
18.85 12800.
Bisla, D., Choromanska, A., Berman, R. S., Stein, J. A., &
Polsky, D. (2019). Towards automated melanoma
detection with Deep Learning: Data Purification and
augmentation. 2019 IEEE/CVF Conference on
Computer Vision and Pattern Recognition Workshops
(CVPRW). https://doi.org/10.1109/cvprw.2019.00330.
Ali, R., Hardie, R. C., Narayanan Narayanan, B., & De
Silva, S. (2019). Deep learning ensemble methods for
skin lesion analysis towards melanoma detection. 2019
IEEE National Aerospace and Electronics Conference
(NAECON).
https://doi.org/10.1109/naecon46414.2019.9058245.
Adegun, A. A., & Viriri, S. (2020). Deep learning-based
system for automatic melanoma detection. IEEE
Access, 8, 7160–7172. https://doi.org/10.1109/
access.2019.2962812.
Wei, L., Ding, K., & Hu, H. (2020). Automatic skin cancer
detection in dermoscopy images based on Ensemble
Lightweight Deep Learning Network. IEEE Access, 8,
99633–99647. https://doi.org/10.1109/access.2020.299
7710.
Xie, P., Li, T., Li, F., Zuo, K., Zhou, J., & Liu, J. (2021).
Multi-scale convolutional neural network for
melanoma histopathology image classification. 2021
IEEE 3rd International Conference on Frontiers
Technology of Information and Computer (ICFTIC).
https://doi.org/10.1109/icftic54370.2021.9647390.
Sharma, P., Gautam, A., Nayak, R., & Balabantaray, B. K.
(2022). Melanoma detection using advanced deep
neural network. 2022 4th International Conference on
Energy, Power and Environment (ICEPE).
https://doi.org/10.1109/icepe55035.2022.9798123.
Nandhini, V., Sam Christopher, S., Shivashnee, B., &
Kumar, C. R. (2023). Early detection of melanoma
using convolutional neural network and Random Forest
algorithm. 2023 9th International Conference on
Advanced Computing and Communication Systems
(ICACCS). https://doi.org/10.1109/icaccs57279.20
23.10112814.
Simonyan, K. & Zisserman, A. (2015) Very Deep
Convolutional Networks for Large-Scale Image
Recognition. The 3rd International Conference on
Learning Representations (ICLR2015). https://arxiv.
org/abs/1409.1556.
He, K., Zhang, X., Ren, S., & Sun, J. (2016). Deep residual
learning for image recognition. 2016 IEEE Conference
on Computer Vision and Pattern Recognition (CVPR).
https://doi.org/10.1109/cvpr.2016.90.
Huang, G., Liu, Z., Van Der Maaten, L., & Weinberger, K.
Q. (2017). Densely connected Convolutional Networks.
2017 IEEE Conference on Computer Vision and
Pattern Recognition (CVPR). https://doi.org/
10.1109/cvpr.2017.243.
Szegedy, C., Vanhoucke, V., Ioffe, S., Shlens, J., & Wojna,
Z. (2016). Rethinking the inception architecture for
computer vision. 2016 IEEE Conference on Computer
Vision and Pattern Recognition (CVPR).
https://doi.org/10.1109/cvpr.2016.308.
Mienye, I. D., & Sun, Y. (2022). A survey of Ensemble
Learning: Concepts, algorithms, applications, and
prospects. IEEE Access, 10, 99129–99149.
https://doi.org/10.1109/access.2022.3207287.
Kaleem, M. A., Cai, J., Amirsoleimani, A., & Genov, R.
(2023). A survey of ensemble methods for mitigating
Memristive Neural Network Non-idealities. 2023 IEEE
International Symposium on Circuits and Systems
(ISCAS). https://doi.org/10.1109/iscas46773.2023.101
81553.
Mabrouk, A., Díaz Redondo, R. P., Dahou, A., Abd Elaziz,
M., & Kayed, M. (2022). Pneumonia detection on chest
X-ray images using ensemble of deep convolutional
Neural Networks. Applied Sciences, 12(13), 6448.
https://doi.org/10.3390/app12136448.
Lundberg Scott M. and Lee Su-In. (2017). A unified
approach to interpreting model predictions. In
Proceedings of the 31st International Conference on
Neural Information Processing Systems (NIPS'17).
Curran Associates Inc., Red Hook, NY, USA, 4768–
4777.
Shakeri, E., Mohammed, E. A., Shakeri H.A., Z., & Far, B.
(2021). Exploring features contributing to the early
prediction of sepsis using machine learning. 2021 43rd
Annual International Conference of the IEEE
Engineering in Medicine & Biology Society (EMBC).
https://doi.org/10.1109/embc46164.2021.9630317.
Ian C. Covert, Scott Lundberg, and Su-In Lee. (2020).
Understanding global feature contributions with
additive importance measures. In Proceedings of the
34th International Conference on Neural Information
Processing Systems (NIPS'20). Curran Associates Inc.,
Red Hook, NY, USA, Article 1444, 17212–17223.
Gessert, N., Nielsen, M., Shaikh, M., Werner, R., &
Schlaefer, A. (2020). Skin lesion classification using
ensembles of multi-resolution efficientnets with Meta
Data. MethodsX, 7, 100864. https://doi.org/10.1016/
j.mex.2020.100864.
Setiawan, A. W. (2020). Effect of color enhancement on
early detection of skin cancer using convolutional
neural network. 2020 IEEE International Conference on
Informatics, IoT, and Enabling Technologies (ICIoT).
https://doi.org/10.1109/iciot48696.2020.9089631.
Melanoma Classification Through Deep Ensemble Learning and Explainable AI
273

Zhang, R. (2021). Melanoma detection using Convolutional
Neural Network. 2021 IEEE International Conference
on Consumer Electronics and Computer Engineering
(ICCECE). https://doi.org/10.1109/iccece51280.20
21.9342142.
Kaur, R., GholamHosseini, H., & Sinha, R. (2020). Deep
Convolutional Neural Network for melanoma detection
using Dermoscopy Images. 2020 42nd Annual
International Conference of the IEEE Engineering in
Medicine & Biology Society (EMBC).
https://doi.org/10.1109/embc44109.2020.9175391.
Moazen, H., & Jamzad, M. (2020). Automatic skin cancer
(melanoma) detection by processing dermatoscopic
images. 2020 International Conference on Machine
Vision and Image Processing (MVIP).
https://doi.org/10.1109/mvip49855.2020.9116918.
HEALTHINF 2024 - 17th International Conference on Health Informatics
274
