
Surface EMG Signal Segmentation and Classification for Parkinson’s
Disease Based on HMM Modelling
Hichem Bengacemi
1,3 a
, Abdenour Hacine Gharbi
2
, Philippe Ravier
3 b
, Karim Abed-Meraim
3
and
Olivier Buttelli
3
1
Signal Processing Lab, École Militaire Polytechnique, Algiers, Algeria
2
LMSE laboratory, University Mohamed El Bachir El Ibrahimi of Bordj Bou Arreridj, El-Anasser, Bordj Bou Arréridj,
34030, Algeria
3
PRISME Lab, Université d’Orléans, INSA-CVL, 12 Rue de Blois, 45067, Orléans, France
Keywords:
Parkinson’s Disease Diagnostic, sEMG Signal Classification, sEMG Signal Segmentation,
Wavelet Cepstral Coefficient (WCC), HMM Models.
Abstract:
To increase the diagnostic accuracy, the techniques of artificial intelligence can be used as a medical support.
The Electromyography (EMG) signals are used in the neuromuscular dysfunction evaluation. This paper pro-
poses a new frame work for segmenting and classifying the surface EMG (sEMG)signals by segmenting the
EMG signal in regions of muscle activity (ACN) and non activity (NAN) for control group (healthy) and the
muscle activity (ACP) and non activity (NAP) for Parkinsonian group. This paper proposes an automatic sys-
tem of the neuromuscular dysfunction identification for Parkinson disease diagnosis based on HMM modeling
by using on sEMG signals. Discrete Wavelet Transform (DWT), LP coefficients and FLP coefficients have
been used for feature extraction. The results have been evaluated on ECOTECH project database using the
signal classification rate (CRS) and the Accuracy (Acc) criterion. The obtained results show highest perfor-
mance by using HMM models of 2 states associated with GMM of 6 Gaussians, combined with Log Wavelet
decomposition based Energy(LWE) descriptor based on Coiflet wavelet mother with decomposition level of
4. The proposed methodology leads to a classification accuracy of leads to an Acc of 99.37 % and a CRS of
100 %.
1 INTRODUCTION
Parkinson’s disease (PD) is a neurodegenerative dis-
ease caused by dopaminergic degeneration. This dis-
ease is defined clinically by movement disturbances,
motor disturbances, and loss of postural control. It
is characterized by several symptoms: freezing, pos-
tural instability and gait disturbance, resting tremor,
rigidity, Akinesia and Bradykinesia.
The diagnosis of PD is not always easy to make.
The latter is generally based on the symptoms de-
scribed by the patient and neurological examination
made by the doctor. Several research works are car-
ried out for the analysis, evaluation and identification
of PD using several approaches such as: Hand writing
(Rosenblum et al., 2013), analysis and gait evaluation
by recording stride intervals (Wendling, 2008; Bhoi,
a
https://orcid.org/0000-0002-4141-5275
b
https://orcid.org/0000-0002-0925-6905
2017; Abdulhay et al., 2018; Kugler et al., 2013) ,
voice analysis (Manwatkar et al., ), medical imaging
(Xu and Zhang, 2019; Porter et al., 2020), the analysis
of electrovestibulography (EVestG) signals which are
in fact the vestibular response modulated by cortical
cerebral signals (Dastgheib et al., 2012) and finally
the analysis of gait using surface EMG signals which
are the subject of this work (Elamvazuthi et al., 2015;
Raut and Gurjar, 2015; Nazmi et al., 2016).
The problem of classification and diagnosis of
neurodegenerative diseases including PD, is strongly
lied to the techniques of features extraction and those
of classification (Sugavaneswaran et al., 2012; Car-
letti et al., 2006; Henmi et al., 2009; Hausdorff et al.,
1998; Okamoto et al., 2009; Surangsrirat et al., 2016;
Bhoi, 2017). In (Hausdorff et al., 1997), the au-
thors presented that the fluctuations of stride inter-
val are increased in PD and correlate with the dis-
ease severity degree. In (Miller et al., 1996), the au-
thors showed that the variability of the EMG signal
930
Bengacemi, H., Gharbi, A., Ravier, P., Abed-Meraim, K. and Buttelli, O.
Surface EMG Signal Segmentation and Classification for Parkinson’s Disease Based on HMM Modelling.
DOI: 10.5220/0012572900003654
Paper published under CC license (CC BY-NC-ND 4.0)
In Proceedings of the 13th International Conference on Pattern Recognition Applications and Methods (ICPRAM 2024), pages 930-938
ISBN: 978-989-758-684-2; ISSN: 2184-4313
Proceedings Copyright © 2024 by SCITEPRESS – Science and Technology Publications, Lda.

recorded from the astrocnemius muscle is higher in
Parkinson’s patients. In (Oung et al., 2018), the au-
thors proposed a multi-class classification, to indicate
the severity level of PD (mild, moderate, severe) us-
ing the empirical wavelet transformation (EWT) and
empirical packet-to-wavelet transformation (EWPT)
based on the motion signals and audio signals. In
(Putri et al., 2018), the authors proposed the clas-
sification of PD by combining voice recordings and
EMG signals using an Adaptive Neuro-Fuzzy Infer-
ence System (ANFIS) and artificial neural networks
(ANN). In (Yuvaraj et al., 2018), the authors used
the EEG signal by combining higher order spectra
(HOS) with some fuzzy k-nearest neighbor classifica-
tion techniques (fuzzy K-nearest neighbor: FKNN), k
more near neighbors (K-nearest neighbor: KNN) and
the naive bayes approach (NB). In (Elamvazuthi et al.,
2015), ANN is combined with linear prediction co-
efficients (LPCs) to classify neuromuscular disorders
(myopathic and neuropathic).In (Bengacemi et al.,
2021a), the authors have proposed the modelling of
muscle activity (AC) and non activity (NA) using
HMM models combined with wavelet analysis for
sEMG signal segmentation in in regions of AC and
non NA applied in PD. In the present work, we pro-
pose to extend the previous work using four HMM
models with adding a decision step for simultaneously
sEMG segmentation and PD diagnosis.
The HMMs have been widely employed and in-
vestigated in the automatic speech recognition. Re-
cently, it has been successfully used for both medical
monitoring and diagnosis system applications such as
ECG classification (Patil et al., 2017), EEG classifi-
cation (Jiang et al., 2019), electrical appliances iden-
tification (Nait-Meziane et al., 2016). Especially, this
method is also used for the PD classification using
the raw gait data (Khorasani and Daliri, 2014). The
HMM has been also combined with support vector
machine (SVM) classifier for natural gesture recog-
nition using EMG signals for upper limb prostheses
control (Rossi et al., 2015). In (Kwon et al., 2007),
the authors have combined the multilayer perceptrons
(MLP’s) and the HMM for classifying six motions
based on EMG signals. A HMM based classifier is
used for speech recognition using myoelectric signals
from the muscles of vocal articulation (Chan et al.,
2002). In (Liu et al., 2015), the authors have used
the HMM on EMG signals to measure the EMG burst
presence probability (EBPP). The study was limited
to simulated signals and to one experimental signal
just for illustration purpose. In (Bengacemi et al.,
2021a), the authors have showed the effectiveness of
HMM for PD modelling where the authors have clas-
sified the EMG activity (AC) versus the no EMG ac-
tivity (NAC). In this paper, we use HMM to classify
EMG activity versus no EMG activity, in which we
have defined four classes ACN, NAN, ACP and NAP
(P: Parkinson and N: Normal). The proposed system
segments the signals on sequence of ACN and NAN
or on sequence of ACP and NAP, then makes a deci-
sion about the class of the EMG signal by verifying
the class type of the sequence P or N.
The proposed system uses the extracted features
from the EMGs signals recorded within the frame-
work of the ECOTECH project (Buttelli, 2012). The
extraction techniques used in this work are the linear
prediction (LP) coefficients, the fractional prediction
coefficients (FLP) and the Discrete Wavelet decompo-
sition based calculus Energy (DWE), Log Wavelet de-
composition based Energy (LWE) and Wavelet Cep-
stral Coefficients (WCC)(Bengacemi et al., 2021a).
The main task consists of looking for optimal param-
eters of HMM and wavelets descriptors to achieve the
best surface EMG signals segmentation and classifi-
cation. The proposed system is carried out in two
phases, namely: the learning phase and the evaluation
and test phase. The first phase is reserved to model
the different classes, while the test phase is used to
evaluate the performance of the diagnostic system.
The main contributions of our work are: firstly,
this work exploits the principal advantage of wavelet
decomposition that is better adapted for extracting
the impulsive information of the action potentials
(AP) of the motor units (MU), especially in PD case.
Secondly, this work adapts the HMM to automatic
sEMG signal segmentation and classification. Note
that HMM is one of the best tools to model signal
state transitions which is considered as the supervised
PD diagnostic task (Bengacemi et al., 2021a). Finally,
based on the real ECOTECH data base, we provide a
high performance analysis using two evaluation crite-
rion. This proposed approach is carried out in a learn-
ing and a test phases. The learning phase consists in
modeling the four classes ACN, NAN, ACP and NAP,
while the test phase aims to evaluate the performance
of the classification systems using the HMM. These
two phases require a step of extracting discriminating
parameters from the four classes.
The rest of the paper is organized as follows: sec-
tion 2 describes the problem formulation and the pro-
posed methodology. Section 3 is dedicated to the per-
formance analysis and discussions while section 4 is
reserved for the concluding remarks.
Surface EMG Signal Segmentation and Classification for Parkinson’s Disease Based on HMM Modelling
931

2 MATERIAL AND METHOD
In this section, we present in details the methodology
of our proposed work. More precisely, after defin-
ing thoroughly the problem formulation, we introduce
gradually the proposed method starting by the perfor-
mance evaluation Tools. Then, the description of the
used database of sEMG signal has been presented.
Then, we present the used features extraction tech-
niques for EMG signal modeling.
2.1 Problem Formulation
In this paper, we present the PD diagnostic system
based on the HMM models. These have already been
used and tested as an sEMG signal segmentation tech-
nique, in (Bengacemi et al., 2021a). However, in this
work, we use this method for a task of diagnosing and
classifying PD. In this system, we used the HMMs for
the both segmentation and classification of the sEMG
signal for the PD diagnostic task. The proposed ap-
proach involves transcribing the sEMG signal of a
control and parkinsonian subjects into a sequence of
activity zone followed by a non-activity zone. Four
classes are considered in this work such as ACP and
NAP for Parkinsonian subject and ACN and NAN for
a control subject.
(1) ACN: EMG activity class for a control subject;
(2) NAN: non-activity class (noise region) for a con-
trol subject;
(3) ACP: EMG activity class for a Parkinson’s pa-
tient;
(4) NAP: non-activity class (noise region) for a
Parkinson’s patient.
We consider K observations (samples)
{
x[n]
}
n=1:K
of sEMG signal. Given a chosen analysis frame
length, these measurements are divided into overlap-
ping
1
frames. For each signal’s frame, we are inter-
ested in determining whether it contains a signal s[n]
embedded in a random background noise w[n] (EMG
activity) or, on the contrary, it is just the confusing
manifestation of the noise (no EMG activity). Hence,
we have a decision problem expressed as:
Γ :
H
0
: no EMG activity for control subject
H
1
: EMG activity for control subject
H
3
: no EMG activity for Parkinsonian subject
H
4
: EMG activity for Parkinsonian subject
(1)
This task is known as sEMG signal segmentation
and classification based on the HMM approach which
1
In this work, we used 50% overlapping windows.
allows us to classify a signal either in class P (parkin-
sonian) or in class N (control) according to the type of
the sequence of the areas ACP, NAP or ACN, NAN.
Thus, this system makes it possible to segment the
signal into activity zones and non-activity zones, and
also to perform the task of diagnosing Parkinson’s dis-
ease. In the following, we will present the methodol-
ogy of diagnosis and classification of PD adopted in
this present system.
Figure 1: Segmentation and classification of EMG signal
based on HMM models.
In the learning phase, each class (ACN, NAN or
ACP, NAP) of region is modeled by an HMM model
of N
states
states, each state being represented by a
GMM model of N
GMM
Gaussian with a diagonal co-
variance matrix. The parameters of the HMM and
GMM models are estimated using the HEREST com-
mand of the HTK tool, applied to the sequence of fea-
ture vectors extracted from the EMG signals from the
database of the ECOTECH project (Buttelli, 2012). In
addition, this estimation requires the transcription of
the reference text which contains the class sequence
of each signal. The feature vector sequences are ex-
tracted using the LPC, FLP, DWE, LWE and WCC
descriptors, applied to each surface EMG signal.
In the segmentation and classification phase, the
HVITE command of the HTK tool uses the trained
HMM models and the constraint model (language
model) to transcribe each input sequence of features
vectors into a sequence of classes (ACN, NAN) or a
sequence of classes (ACP,NAP) and detect the bound-
aries of their segments (Young et al., 2006; Chibelushi
et al., 2002). The constraint problem is to accept only
the sequence of classes in which each ACN tag (class)
is followed by the NAN tag for the control subject’s
surface EMG signal and each ACP tag (class) is fol-
lowed by the NAP tag for the surface EMG signal for
the Parkinson’s patient. Then, a decision is made for
SEMG signal classification by verifying the class of
obtained sequence, either P (Parkinsonian subjects) or
N (Control subjects).
ICPRAM 2024 - 13th International Conference on Pattern Recognition Applications and Methods
932

2.2 Performance Evaluation Tools
The performance evaluation can be performed using
the HRESULTS command of the HTK tool which
compares each test transcript of an EMG signal to
its corresponding reference transcript (Young et al.,
2006). The result of identifying and classifying seg-
ments is evaluated using the precision Acc defined in
the equation (2).
The precision Acc is used to evaluate the number
of bursts of EMG activity correctly detected, taking
into account the constraints already described previ-
ously.
Acc =
N − D − S−I
N
(2)
N represents the total number of segment labels in
the reference transcriptions of EMG signals, D is the
number of removed labels, S is the number of substi-
tuted labels and I is the number of the inserted labels.
The classification system is composed of the follow-
ing three steps.
For the performance test and evaluation stage, we
adopt the following performance indicators: the clas-
sification precision (Acc) and the signal classification
rate (C RS), defined in the equation (2) and the equa-
tion (3) respectively.
The precision allows us to have an overall mea-
surement calculated from the classification of all the
zones of the test base (ACN-NAN or ACP-NAP) inde-
pendently of the signals. However, the diagnostic task
consists in classifying the signals, this diagnostic task
uses the segmentation results which makes it possible
to classify the signal in Parkinson’s class (P) or in con-
trol class (N) according to the type of the sequence of
zones (ACN-NAN or ACP-NAP). The classification
rate is calculated using the equation 3 which allows
us to get the perfomance analysis of the proposed di-
agnostic system.
CRS = NsC/NsT (3)
where CRS is signal classification rate, NsC is the
classified signals correctly and NsT is the total num-
ber of signals.
2.3 Surface EMG Signal Database
For this study, nine healthy subjects and eight Parkin-
sonian patients were recruited in the frame of the
French national research project ECOTECH (But-
telli, 2012). This work was approved by the local
ethics committee and subjects provided written con-
sent prior to commencement.
A specific lower limb muscles of gait activity have
been measured. Patients were prepared for electrodes
placement by shaving the skin and cleaning it with al-
cohol wipes. EMG sensors were placed on the muscle
belly parallel to the main direction of muscle fibres in
accordance with study on the innervation zone (Bar-
bero et al., 2012). Data were collected using an on
board system of wearable sensors (20-450 Hz band-
width, 16 bits per sample, 1926 Hz sampling rate).
Data collection provides several burst activities from
each right soleus muscle corresponding to several gait
cycles. The data base description is reported in tables
1 and 2.
Table 1: Description of sEMG signals for healthy subjects.
Subjects Number of EMG bursts Signal duration (second)
Data base for training phase
Control
1
22 26.0685
Control
2
10 11.2128
Control
3
11 14.3998
Control
4
11 14.7441
Data base for testing phase
Control
5
11 11.1635
Control
6
6 7.7121
Control
7
6 6.5298
Control
8
12 14.3458
Control
9
26 28.5702
Table 2: Description of sEMG signals for Parkinsonian sub-
jects.
Subjects Number of EMG bursts Signal duration (second)
Data base for training phase
Park
1
10 28.5702
Park
2
10 9.1317
Park
3
5 4.8657
Park
4
37 39.6152
Data base for testing phase
Park
5
10 11.2876
Park
6
9 8.9152
Park
7
5 4.4742
Park
8
5 4.6487
2.4 Features Extraction and EMG
Signal Modeling
The feature extraction plays a critical role to get a ro-
bust diagnosis system. This process transforms the
raw sEMG signal into a feature vector. Generally, the
used features in EMG signals analysis can be divided
into three categories: time domain, frequency do-
main and time-frequency domain features (Hogan and
Mann, 1980; Tsai et al., 2014; Englehart et al., 1999).
As a particular class within the time-frequency meth-
ods, the time-scale methods have gained high interest
because the scale parameter provides a natural analy-
sis of biological phenomena, that is to say a high time
precision for rapid events (low scales) and conversely
a poor time precision with high frequency precision
for slow events (high scales). Moreover, they show a
high tuning flexibility in their design useful for per-
formance seeking. In our work, we are interested in
the use of Discrete Wavelet transform, particularly the
Wavelet Cepstral Coefficient (WCC) coefficients. In
this study, we have also analysed the Discrete Wavelet
Energy (DWE) normalized on total energy of win-
Surface EMG Signal Segmentation and Classification for Parkinson’s Disease Based on HMM Modelling
933
dow analysis, the logarithm of wavelet energy (LWE)
and the Wavelet Cepstral Coefficient (WCC) com-
puted from the discrete cosine transform (DCT) of
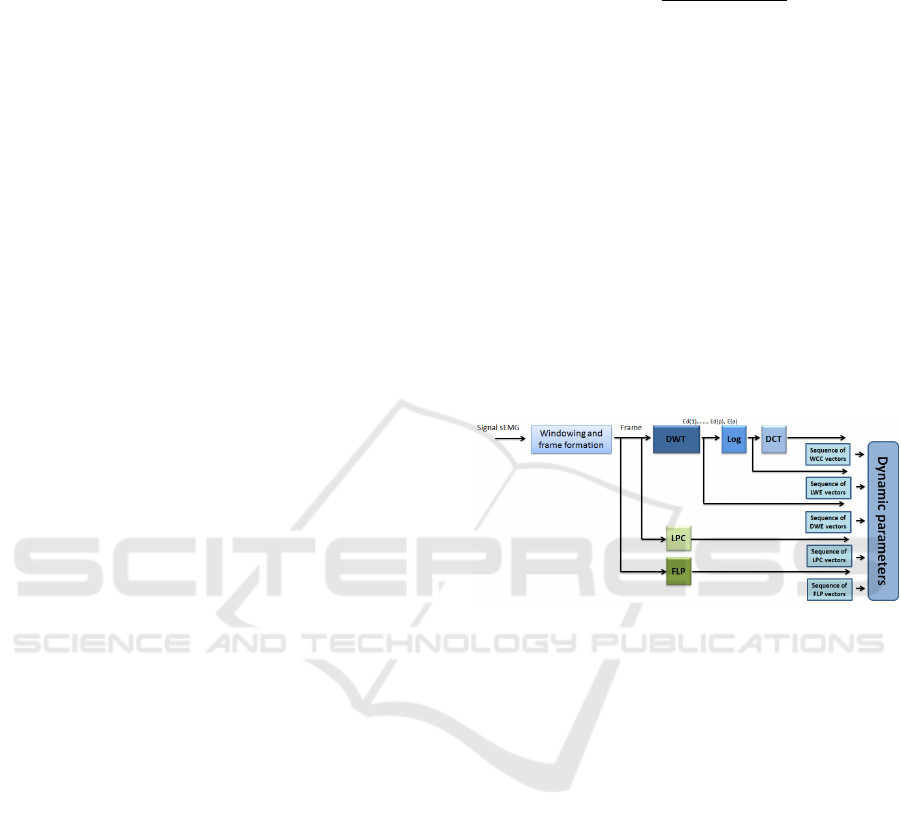
LWE (Hacine-Gharbi and Ravier, 2018) (see Fig.2).
All the features were calculated using the discrete
wavelet transform (DWT) which mother wavelet is
characterized by two digital low-pass and high-pass
filters. The DWT provides coefficients by an iter-
ative down sampling-filtering procedure achieved at
successive scales beginning on the N-length original
signal x[n] up to a desired decomposition level L
decomp
(that should be lower than the maximum decomposi-
tion level L
max
= log
2
[n] provided N is a power of 2
or rounded to its nearest high value). The iterative
procedure extracts the set of wavelet coefficients d
i
[n]
at each scale i from 1 up to L
decomp
value plus the
a
L
decomp
[n] at the last scale. Then the DWE features
E(d
i
) and E(a
L
decomp
) are composed of the energy val-
ues calculated as the squared absolute magnitude sum
of the wavelet coefficients at each scale i. The LWE
are the log of the DWE coefficients previously nor-
malized by the number of samples per scale. Finally,
the WCC coefficients are obtained by applying the
inverse DCT on the previous LWE coefficients for
decorrelation. In this work, we investigated the im-
pact of these descriptors on the performance results of
PD classification. Hence different experiences have
been carried out to search for the optimal configura-
tion. These features are widely used in: speech recog-
nition (Lei and Kun, 2016; Adam et al., 2013), Elec-
trical Appliances Identification (Hacine-Gharbi and
Ravier, 2018; Bengacemi et al., 2021a; Bengacemi
et al., 2021b) and Recognition of Heart Sound (Xiong
et al., 2019).
In this work, we have also integrated the dynamic
features which are the first order differential coeffi-
cients (also called delta ∆) and second order (called
delta-delta ∆∆), resulting from the initially calcu-
lated coefficients DWE, LWE and WCC, considered
as static features. The static’s features contain only
information on a given frame. In order to improve the
representation of the frame’s information, it is often
proposed to introduce new features in the vector of
features. (Furui, 1981; Furui, 1986) proposed the use
of dynamic features which present the spectral transi-
tion information in the signal. The dynamic features
are calculed using HCopy command of the HTK tools
library (Hidden Markov Model Toolkit).
Let C
k
(t) is the extracted feature k of frame t,
then the corresponding differential coefficient ∆C
k
is
calculated on 2η
∆
analysis frames by estimating the
slope of the linear regression of the coefficient C
k
at
time t (Young et al., 2006):
∆C
k
(t) =
i=+η
∆
∑
i=−η
∆
i.C
k
(t + i)
2.
i=+η
∆
∑
i=−η
∆
i
2
(4)
The second order differential coefficients ∆∆ (delta-
delta or acceleration) are calculated in the same way
from the first order coefficients.
The proposed system can be seen as pattern recog-
nition system which requires a training and recogni-
tion phases. The first one is used for modelling the
temporal pattern classes and the second one is used
for Parkinson’s diseases classification. Hence, both
phases require feature extraction step to convert each
signal in sequence of features vectors obtained by di-
viding the signal into overlapping windows and com-
puting from each window a set of features that consti-
tutes the feature vector (see Fig.2). This sequence of
vectors can be considered as input sequence of obser-
vations in modelling or classification steps.
Figure 2: Features extraction steps (Bengacemi et al.,
2021b).
3 RESULTS AND DISCUSSION
In this paragraph, we evaluate the performance of the
proposed HMM approach with the different feature
extraction techniques. Like any classification system,
we have two phases, the first is the learning phase and
the second is the testing phase. The first phase is per-
formed with a set of nine real EMG signals, made up
of four signals from Parkinson’s subjects and five sig-
nals from control subjects. In the second phase, we
take four signals from Parkinson’s subjects and four
signals from control subjects, as shown in the tables 1
and 2.
Several experiments are carried out to find the op-
timal configuration which gives the best performance
by studying: (i) The parameters of the HMM mod-
els (number of states and the number of Gaussians),
(ii) The study of different types of descriptors for fea-
ture extraction (iii) The optimal combination of the
mother wavelet with the level of decomposition. The
three experiments are processed in this order:
ICPRAM 2024 - 13th International Conference on Pattern Recognition Applications and Methods
934

Table 4: Comparison of performances in Acc % and CRS % for the LWE descriptor using ’Coi f 5’ for different analysis
frame’s duration.
The analysis frame duration (ms) 16.61 20 30 33.22 40 50 60 66.45 70 80 90 100 110 120 130 132.91 140 150
Acc % 61,01 53,46 51,57 67,92 72,96 79,25 69,18 44,03 68,55 99,37 68,55 83,02 72,33 84,91 46,54 47,80 69,18 32,08
CRS % 75.00 62.50 75.00 75.00 75.00 87.50 75.00 62.50 75.00 100 75.00 87.50 75.00 87.50 62.50 62.50 75.00 50.00
(1) Comparison of the performance of the LPC, FLP,
DWE, DWE and WCC descriptors;
(2) Finds the optimal duration of the analysis frame;
(3) Finding the best combination between the mother
wavelet and the level of decomposition.
(4) Analyse the performance of the obtained results.
For the first experiment, we have varied the num-
ber of states HMM N
states
, the number of Gaussians
N
GMM
and the level of wavelet decomposition L
decomp
for wavelet analysis
2
, The order P for the LPC de-
scriptor and the order L for the FLP descriptor. The
best descriptor with the optimal parameters found are
used for the second experiment to study the duration
of the analysis frame. Next, we look for the optimal
configuration for the mother wavelet.
3.1 Performances Comparison of
Different Descriptors
This part presents the performance evaluation results
of five descriptors namely LPC, FLP, DWE, LWE and
WCC for the diagnosis of PD. In this experiment, we
are looking for the optimal configuration that gives
the best performance in terms of Acc and CRS. For
each descriptor, we vary the number of states for
each experiment N
states
= (2,3,4, 5,6, 7,8, 9,10), the
number of components of Gaussians in GMM mod-
eling N
GMM
= (1,2,3,6, 12,24, 48), the order P =
(2,3,4, 5,6, 7,8, 9,10) of the LPC descriptor and the
order L of the FLP descriptor.
The obtained results are presented in the table 3
which show the optimal configurations in terms of
number of Gaussians N
GMM
and number of states
N
states
for each wavelet analysis descriptor DWE,
LWE and WCC with the optimal order P for the de-
scriptor LPC and the optimal order L for the FLP de-
scriptor. These results demonstrate the gain in perfor-
mance of the wavelet analysis descriptors which show
an Acc greater than 88 % and a CRS greater than 87
% compared to the LPC and FLP descriptors. In par-
ticular, the descriptor LW E with Acc = 98.11% and
CRS = 100% for N
GMM
= 6 and N
states
= 2.
2
The mother wavelet ’Coi f 5’ was chosen with an anal-
ysis frame duration equal to 66.45 ms and a wavelet de-
composition level L
decomp
= 4, found as optimal parameters
in the segmentation by HMM modelling (Bengacemi et al.,
2021a).
Table 3: Comparison of performance in Acc % and CRS %
for DWE, LPC, LWE and WCC descriptors using ’Coi f 5’
and L
decomp
= 4 with a the analysis frame equal to 66.45
ms.
Descriptors LPC FLP DWE LW E WCC
Optimal parameters N
GMM
= 24 N
GMM
= 6 N
GMM
= 3 N
GMM
= 6 N
GMM
= 12
N
states
= 3 and P = 3 N
states
= 3 and L = 5 N
states
= 3 N
states
= 2 N
states
= 3
Acc % 66.97 83.65 88.05 98.11 91.82
CRS % 75 75 87.5 100 87.5
3.2 Influence of the Duration of the
Analysis Window
After having chosen the descriptor LW E, we study in
this paragraph the duration of the appropriate analy-
sis frame taking into account the advantages of the
wavelet analysis, which is appropriate for the non-
stationarity of EMG signals. We vary the analysis
frame duration for the mother wavelet ’C oi f 5’, the
number of GMMs N
GMM
= 6, the number of states
N
states
= 2 and the level of decomposition equal to
L
decomp
= 4 for the descriptor LWE. The table 4
shows the values of Acc for each value of the duration
of the analysis frame. The best performance is ob-
tained for an analysis frame duration equal to 80 ms,
which corresponds to the values of Acc equal to 99.37
% and CRS equal to 100 %. This analysis frame du-
ration is used in the performance analysis for the op-
timal choice of the mother wavelet.
3.3 Choice of the Mother Wavelet and
Decomposition Level
Several studies on surface EMG analysis have con-
cluded that the Daubechies wavelet family (Db) is the
most suitable wavelet for the analysis of the EMGs
signal (Hussain et al., 2009; Mahaphonchaikul et al.,
2010; Phinyomark et al., 2009). In (Too et al., 2018),
the authors concluded that the ’Sym4’ is the most suit-
able for EMG pattern recognition. In (Bengacemi
et al., 2021b), we found that Coi f 5 is the most suit-
able for the segmentation of the surface EMG signal.
This part of the study aims to select the optimal order
of the mother wavelets within its family for a dura-
tion of the analysis frame equal to 80 ms, a number of
GMM N
GMM
= 6 , a number of states N
states
= 2 with
a decomposition level varying between 1 to log2(N)
(N is the number of samples in the analysis window
(max level = 7)). In this study, we consider the fol-
lowing wavelet families:
Surface EMG Signal Segmentation and Classification for Parkinson’s Disease Based on HMM Modelling
935

• The Daubechies family with orders 1 to 8: Db1,
Db2, ... , Db10;
• The Symlets family with orders 1 to 8: Sym1,
Sym2, ..., Sym8;
• The Coiflets family with orders 1 to 5: Coif1,
Coif2,..., Coif5.
The obtained results of Acc and L
decomp
are reported
in the tables 5, 6 and 7 for each of the three wavelet
family, respectively from which we can note that the
best results:
- For the wavelet family Daubechies (see the table
5), we notice that the average of the classification
precision Acc is greater than 87 % and the average
of the classification rate CRS is greater than 87%.
We also notice that for Db7, Db8 and Db9 with
L
decomp
= 4, we have a Acc = 99.37 and a CRS =
100%.
- For the wavelet family Symlets (see the table 6),
we notice that the average of the classification
rates Acc is greater than 87 % and the average
of the classification rate CRS is greater than 89%.
We also notice that for Sym4 and L
decomp
= 2 we
have a Acc = 97.48 and a CRS = 100%.
- For the wavelet family Coiflets (see the table 7),
we notice that the average of the classification
rates Acc is greater than 96 % and the average
of the classification rate CRS is greater than 97%.
We also notice that for Coi f 5 and L
decomp
= 4
leads to an Acc = 99.37 and a CRS = 100%.
The obtained results demonstrate the robustness of the
performance of the proposed approach in terms of the
value of Acc and of CRS where we notice that all the
mean values of Acc and CRS are greater than 87 % . In
particular, we notice that the wavelet family ’Coiflets’
gives an average Acc greater than 96 % and an aver-
age CRS 97 %. The mother wavelets Db7, Db8, Db9
and Coi f 5 with Ldecomp = 4 give the same values of
Acc = 99.37 and of CRS = 100%. This improvement
of the results is obtained through the various exper-
iments described previously without any exhaustive
empirical calculation.
Table 5: The performance in terms of Acc %, CRS % and
L
decomp
optimal for LWE using the Daubechies wavelet
family.
Daubechies Db1 Db2 Db3 Db4 Db5 Db6 Db7 Db8 Db9 Db10 moyenne
80 ms
L
decomp
2 5 3 2 5 2 4 4 4 2 //
Acc % 80.50 86.16 82.39 74.21 79.87 91.82 99.37 99.37 99.37 83.02 87.60
CRS % 87.5 75 87.5 75 75 87.5 100 100 100 87.5 87.5
Table 6: The performance in terms of Acc %, CRS % and
L
decomp
optimal for LWE using the Symlets wavelet family.
Symlets Sym1 Sym2 Sym3 Sym4 Sym5 Sym6 Sym7 Sym8 moyenne
80 ms
L
decomp
2 5 3 2 4 4 4 2 //
Acc % 80.50 86.16 82.39 97.48 86.16 83.65 83.65 96.23 87.02
CRS % 87.5 75 87.5 100 87.5 87.5 87.5 100 89.06
Table 7: The performance in terms of Acc %, CRS % and
L
decomp
optimal for LWE using the Coiflets wavelet family.
Coiflets Coi f 1 Coi f 2 Coi f 3 Coi f 4 Coi f 5 moyenne
80 ms
L
decomp
1 4 2 2 4 //
Acc % 91.19 97.48 97.48 97.48 99.37 96.60
CRS % 87.5 100 100 100 100 97.50
4 CONCLUSION
The classification and diagnosis of diseases has im-
portant clinical application. This paper describes the
new diagnostic systems for dealing with the classifi-
cation problem of Parkinson’s disease. The proposed
system is based on HMM modeling and wavelet anal-
ysis which is most suitable for non-stationary signals,
especially surface EMG signals. The results show
the HMM system achieved good classification accu-
racy of ACN,NAN,ACP,NAP (segmentation) and sig-
nal classification rate (diagnostic) suitable for clini-
cal applications. The evaluation of diagnostic per-
formance is performed by performing various experi-
ments on surface EMG signals. The proposed system
gives better results which lead to an Acc of 99.37 %
and a CRS of 100 %. Consequently, this proposed
approach represents an appropriate solution for the
analysis of EMGs signals and its use for both EMG
signal segmentation and diagnostic purposes, in par-
ticular Parkinson’s disease. We have also seen the ef-
fectiveness of the HMM method for PD.
ACKNOWLEDGMENTS
The present paper used collected data from the French
national project ECOTECH supported by the French
National Agency for research under the contract No.
ANR-12-TECS-0020.
REFERENCES
Abdulhay, E., Arunkumar, N., Narasimhan, K., Vellaiap-
pan, E., and Venkatraman, V. (2018). Gait and tremor
investigation using machine learning techniques for
the diagnosis of parkinson disease. Future Genera-
tion Computer Systems, 83:366–373.
Adam, T., Salam, M., and Gunawan, T. S. (2013). Wavelet
based cepstral coefficients for neural network speech
recognition. In 2013 IEEE International Conference
on Signal and Image Processing Applications, pages
447–451. IEEE.
Barbero, M., Merletti, R., and Rainoldi, A. (2012). Atlas
of muscle innervation zones: understanding surface
ICPRAM 2024 - 13th International Conference on Pattern Recognition Applications and Methods
936

electromyography and its applications. Springer Sci-
ence & Business Media.
Bengacemi, H., Gharbi, A. H., Ravier, P., Abed-Meraim,
K., and Buttelli, O. (2021a). Surface emg signal seg-
mentation based on hmm modelling: Application on
parkinson’s disease. ENP Engineering Science Jour-
nal, 1(1):63–74.
Bengacemi, H., Hacine-Gharbi, A., Ravier, P., Abed-
Meraim, K., and Buttelli, O. (2021b). Surface emg
signal classification for parkinson’s disease using wcc
descriptor and ann classifier. In ICPRAM, pages 287–
294.
Bhoi, A. K. (2017). Classification and clustering of parkin-
son’s and healthy control gait dynamics using LDA
and K-means. International Journal Bioautomation,
21(1).
Buttelli, O. (2012). Agence nationale de la recherche.
http://www.agence-nationale-recherche.fr/Projet-
ANR-12-TECS-0020.
Carletti, T., Fanelli, D., and Guarino, A. (2006). A new
route to non invasive diagnosis in neurodegenerative
diseases? Neuroscience letters, 394(3):252–255.
Chan, A. D., Englehart, K., Hudgins, B., and Lovely, D. F.
(2002). Hidden markov model classification of my-
oelectric signals in speech. IEEE Engineering in
Medicine and Biology Magazine, 21(5):143–146.
Chibelushi, C. C., Deravi, F., and Mason, J. S. (2002). A
review of speech-based bimodal recognition. IEEE
transactions on multimedia, 4(1):23–37.
Dastgheib, Z. A., Lithgow, B., and Moussavi, Z. (2012).
Diagnosis of parkinson’s disease using electrovestibu-
lography. Medical & biological engineering & com-
puting, 50(5):483–491.
Elamvazuthi, I., Duy, N., Ali, Z., Su, S., Khan, M. A., and
Parasuraman, S. (2015). Electromyography (EMG)
based classification of neuromuscular disorders using
multi-layer perceptron. Procedia Computer Science,
76:223–228.
Englehart, K., Hudgins, B., Parker, P. A., and Stevenson,
M. (1999). Classification of the myoelectric signal
using time-frequency based representations. Medical
Engineering and Physics, 21(6):431–438.
Furui, S. (1981). Cepstral analysis technique for automatic
speaker verification. IEEE Transactions on Acoustics,
Speech, and Signal Processing, 29(2):254–272.
Furui, S. (1986). Speaker-independent isolated word recog-
nition using dynamic features of speech spectrum.
IEEE Transactions on Acoustics, Speech, and Signal
Processing, 34(1):52–59.
Hacine-Gharbi, A. and Ravier, P. (2018). Wavelet cepstral
coefficients for electrical appliances identification us-
ing hidden markov models. In ICPRAM, pages 541–
549.
Hausdorff, J. M., Cudkowicz, M. E., Firtion, R., Wei, J. Y.,
and Goldberger, A. L. (1998). Gait variability and
basal ganglia disorders: Stride-to-stride variations of
gait cycle timing in parkinson’s disease and hunting-
ton’s disease. Movement disorders, 13(3):428–437.
Hausdorff, J. M., Mitchell, S. L., Firtion, R., Peng, C.-
K., Cudkowicz, M. E., Wei, J. Y., and Goldberger,
A. L. (1997). Altered fractal dynamics of gait: re-
duced stride-interval correlations with aging and hunt-
ington’s disease. Journal of applied physiology,
82(1):262–269.
Henmi, O., Shiba, Y., Saito, T., Tsuruta, H., Takeuchi, A.,
Shirataka, M., Obuchi, S., Kojima, M., and Ikeda, N.
(2009). Spectral analysis of gait variability of stride
interval time series: comparison of young, elderly
and parkinson’s disease patients. Journal of Physical
Therapy Science, 21(2):105–111.
Hogan, N. and Mann, R. W. (1980). Myoelectric
signal processing: Optimal estimation applied to
electromyography-part ii: Experimental demonstra-
tion of optimal myoprocessor performance. IEEE
Transactions on Biomedical Engineering, (7):396–
410.
Hussain, M., Reaz, M. B. I., Mohd-Yasin, F., and Ibrahimy,
M. I. (2009). Electromyography signal analysis using
wavelet transform and higher order statistics to deter-
mine muscle contraction. Expert Systems, 26(1):35–
48.
Jiang, D., Lu, Y.-n., Yu, M., and Yuanyuan, W. (2019). Ro-
bust sleep stage classification with single-channel eeg
signals using multimodal decomposition and hmm-
based refinement. Expert Systems with Applications,
121:188–203.
Khorasani, A. and Daliri, M. R. (2014). Hmm for classi-
fication of parkinson’s disease based on the raw gait
data. Journal of medical systems, 38(12):147.
Kugler, P., Jaremenko, C., Schlachetzki, J., Winkler, J.,
Klucken, J., and Eskofier, B. (2013). Automatic
recognition of parkinson’s disease using surface elec-
tromyography during standardized gait tests. In 2013
35th Annual International Conference of the IEEE En-
gineering in Medicine and Biology Society (EMBC),
pages 5781–5784. IEEE.
Kwon, J.-W., Kim, J.-H., and Choi, H.-H. (2007). Classifi-
cation of the emg signal using cascaded classifier. In
World Congress on Medical Physics and Biomedical
Engineering 2006, pages 1222–1225. Springer.
Lei, L. and Kun, S. (2016). Speaker recognition using
wavelet cepstral coefficient, i-vector, and cosine dis-
tance scoring and its application for forensics. Journal
of Electrical and Computer Engineering, 2016.
Liu, J., Ying, D., and Rymer, W. Z. (2015). EMG burst pres-
ence probability: A joint time–frequency representa-
tion of muscle activity and its application to onset de-
tection. Journal of Biomechanics, 48(6):1193–1197.
Mahaphonchaikul, K., Sueaseenak, D., Pintavirooj, C.,
Sangworasil, M., and Tungjitkusolmun, S. (2010).
EMG signal feature extraction based on wavelet trans-
form. In ECTI-CON2010: The 2010 ECTI Interna-
tional Confernce on Electrical Engineering/Electron-
ics, Computer, Telecommunications and Information
Technology, pages 327–331. IEEE.
Manwatkar, A. P., Salwe, S., Bagade, A., and Raut, R. A
review on detection of parkinson’s disease.
Miller, R. A., Thaut, M. H., McIntosh, G. C., and Rice,
R. R. (1996). Components of EMG symmetry and
variability in parkinsonian and healthy elderly gait.
Surface EMG Signal Segmentation and Classification for Parkinson’s Disease Based on HMM Modelling
937

Electroencephalography and Clinical Neurophysiolo-
gy/Electromyography and Motor Control, 101(1):1–7.
Nait-Meziane, M., Hacine-Gharbi, A., Ravier, P., Lamar-
que, G., Le Bunetel, J.-C., and Raingeaud, Y. (2016).
Hmm-based transient and steady-state current sig-
nals modeling for electrical appliances identification.
In Proceedings of the 5th International Conference
on Pattern Recognition Applications and Methods,
pages 670–677. SCITEPRESS-Science and Technol-
ogy Publications, Lda.
Nazmi, N., Abdul Rahman, M. A., Yamamoto, S.-I., Ah-
mad, S. A., Zamzuri, H., and Mazlan, S. A. (2016).
A review of classification techniques of EMG signals
during isotonic and isometric contractions. Sensors,
16(8):1304.
Okamoto, M., Matsubara, Y., Shima, K., and Tsuji, T.
(2009). EMG pattern classification using hierarchi-
cal network based on boosting approach. Interna-
tional Journal of innovative computing, information
and control, 5(12):4935–4943.
Oung, Q. W., Muthusamy, H., Basah, S. N., Lee, H., and
Vijean, V. (2018). Empirical wavelet transform based
features for classification of parkinson’s disease sever-
ity. Journal of medical systems, 42(2):29.
Patil, D. D., Singh, R., Thakare, V. M., and Gulve, A. K.
(2017). Automatic classification of ecg arrhythmia us-
ing morphological parameters with hmm and svm. In-
ternational Journal of Applied Engineering Research,
12(20):10376–10384.
Phinyomark, A., Limsakul, C., and Phukpattaranont, P.
(2009). An optimal wavelet function based on wavelet
denoising for multifunction myoelectric control. In
2009 6th International Conference on Electrical Engi-
neering/Electronics, Computer, Telecommunications
and Information Technology, volume 2, pages 1098–
1101. IEEE.
Porter, E., Roussakis, A.-A., Lao-Kaim, N. P., and Pic-
cini, P. (2020). Multimodal dopamine transporter
(dat) imaging and magnetic resonance imaging (mri)
to characterise early parkinson’s disease. Parkinson-
ism & Related Disorders.
Putri, F. T., Ariyanto, M., Caesarendra, W., Ismail, R., Pam-
budi, K. A., and Pasmanasari, E. D. (2018). Low cost
parkinson’s disease early detection and classification
based on voice and electromyography signal. In Com-
putational Intelligence for Pattern Recognition, pages
397–426. Springer.
Raut, R. K. and Gurjar, A. A. (2015). Bio-medical (EMG)
signal feature extraction using wavelet transform for
design of prosthetic leg. International Journal of Elec-
tronics, Communication and Soft Computing Science
& Engineering (IJECSCSE), 4:81.
Rosenblum, S., Samuel, M., Zlotnik, S., Erikh, I., and
Schlesinger, I. (2013). Handwriting as an objective
tool for parkinson’s disease diagnosis. Journal of neu-
rology, 260(9):2357–2361.
Rossi, M., Benatti, S., Farella, E., and Benini, L. (2015).
Hybrid emg classifier based on hmm and svm for hand
gesture recognition in prosthetics. In 2015 IEEE Inter-
national Conference on Industrial Technology (ICIT),
pages 1700–1705. IEEE.
Sugavaneswaran, L., Umapathy, K., and Krishnan, S.
(2012). Ambiguity domain-based identification of al-
tered gait pattern in ALS disorder. Journal of neural
engineering, 9(4):046004.
Surangsrirat, D., Thanawattano, C., Pongthornseri, R.,
Dumnin, S., Anan, C., and Bhidayasiri, R. (2016).
Support vector machine classification of parkinson’s
disease and essential tremor subjects based on tempo-
ral fluctuation. In Engineering in Medicine and Biol-
ogy Society (EMBC), 2016 IEEE 38th Annual Inter-
national Conference of the, pages 6389–6392. IEEE.
Too, J., Abdullah, A., Saad, N. M., Ali, N. M., and Musa,
H. (2018). A detail study of wavelet families for EMG
pattern recognition. International Journal of Electri-
cal and Computer Engineering (IJECE), 8(6):4221–
4229.
Tsai, A.-C., Hsieh, T.-H., Luh, J.-J., and Lin, T.-T. (2014).
A comparison of upper-limb motion pattern recogni-
tion using EMG signals during dynamic and isometric
muscle contractions. Biomedical Signal Processing
and Control, 11:17–26.
Wendling, B. (2008). Gait analysis of left and right stride
intervals in neurodegenerative diseases.
Xiong, L., Zhao, Z., Pan, J., Yang, H., and Wang, W. (2019).
Recognition of heart sound based on wavelet cepstrum
coefficient and probabilistic neural network.
Xu, J. and Zhang, M. (2019). Use of magnetic resonance
imaging and artificial intelligence in studies of diag-
nosis of parkinson’s disease. ACS chemical neuro-
science, 10(6):2658–2667.
Young, S., Evermann, G., Gales, M., Hain, T., Kershaw, D.,
Moore, G., Odell, J., Ollason, D., Povey, D., Valtchev,
V., et al. (2006). The htk book (for htk version. 3.3),
cambridge university engineering department, 2005.
URL http://htk. eng. cam. ac. uk/docs/docs. shtml.
Yuvaraj, R., Acharya, U. R., and Hagiwara, Y. (2018).
A novel parkinson’s disease diagnosis index using
higher-order spectra features in eeg signals. Neural
Computing and Applications, 30(4):1225–1235.
ICPRAM 2024 - 13th International Conference on Pattern Recognition Applications and Methods
938
