
Emotional and Meditative States in Interactive Media Access with a
Positive Computing Perspective
Carla Bernardino
1
, Sílvia Martins
1
, Hugo Ferreira
2a
and Teresa Chambel
1b
1
LASIGE, Faculdade de Ciências da Universidade de Lisboa, Portugal
2
IBEB, Faculdade de Ciências da Universidade de Lisboa, Portugal
Keywords: Affective and Positive Computing, Meditation, Mindfulness, Emotions, Wellbeing, Health, Awareness,
Serendipity, Media4WellBeing, Interactive Media Access, Video, Music, Images, Visualization,
Physiological Sensors, User Experience.
Abstract: Media influences human behavior, emotions, states-of-mind, health and sense of wellbeing, with great
potential for a positive impact in our lives, and it is becoming pervasive. Advances and discoveries in the field
of neurosciences and informatics have the potential to help people in emotional and wellbeing awareness and
regulation, in a positive computing perspective. Our project aims to explore this potential around the design
and development of an interactive application that allows the access, exploration and visualization of different
media, based on their impact on emotional and meditative states. This paper presents scientific background,
design choices, functionalities and a user study of this application. Results were very encouraging in terms of
perceived efficacy, usefulness, usability and user experience and will inform future directions.
1 INTRODUCTION
Media like music, video and images have an
important role and are becoming pervasive in our
lives. They have great impact on emotions and states-
of-mind (Chambel et al., 2011b; Zillmann and
Vorderer, 2008), influencing behaviours, wellbeing
and even health. Meditation is another practice with
such an impact. It has been developed and used for
millennia in several cultures, to promote personal
transformation (Aubrey, 2010), and is becoming
more prevalent especially in approaches like
mindfulness and emotional intelligence, in personal
and organizational interventions (Calvo and Peters,
2014; Kabat-Zinn, 2023). Media can help induce and
support meditative states, and impact our emotions,
but there is not much support in accessing media
based on this impact. Our aim is to contribute in this
direction. Current challenges include the effective
modeling and detection of media-related emotions,
and an effective and useful way to access media based
on its impact.
In this paper, we present the background, main
features and a user evaluation of Media4WellBeing,
a
https://orcid.org/0000-0002-4323-3942
b
https://orcid.org/0000-0002-0306-3352
an interactive web application being designed and
developed to access, explore and visualize media
based on its impact on emotional and meditative
states, using physiological sensors, in a multi-
disciplinary cooperation of Computer Science and
Biomedicine. It aims to support awareness and
regulation of these states to contribute to users sense
of wellbeing, while providing a rich and flexible way
to access media like video, images and audio;
aligning with the perspective of Positive Computing,
an approach focused in the design and development
of digital technologies that promote and support
psychological wellbeing and human potential, with
roots in Positive Psychology (Calvo and Peters,2014).
2 BACKGROUND
This section briefly presents key concepts,
technologies and applications being researched, as a
background for our own work and contributions.
Positive Psychology and Positive Computing.
Positive Psychology relates to the study of what
makes life most worth living (Seligman and
Bernardino, C., Martins, S., Ferreira, H. and Chambel, T.
Emotional and Meditative States in Interactive Media Access with a Positive Computing Perspective.
DOI: 10.5220/0012571700003660
Paper published under CC license (CC BY-NC-ND 4.0)
In Proceedings of the 19th International Joint Conference on Computer Vision, Imaging and Computer Graphics Theory and Applications (VISIGRAPP 2024) - Volume 1: GRAPP, HUCAPP
and IVAPP, pages 369-379
ISBN: 978-989-758-679-8; ISSN: 2184-4321
Proceedings Copyright © 2024 by SCITEPRESS – Science and Technology Publications, Lda.
369

Csikszentmihalyi, 2000), including the biological,
personal, relational, institutional, cultural and global
dimensions of life. The physiology of healthy minds
and the role of empathy, mindfulness and meditation
have been studied by neuroscientists, supporting a
growing attention to emotional intelligence and
positive psychology in order to improve wellbeing.
Positive Computing is an approach focused in the
design and development of technologies which
support and promote psychological wellbeing and
human potential, with roots in positive psychology.
Digital technology has become ubiquitous, having an
unprecedented major impact in how we live, with the
capacity to increase stress and suffering, but also the
potential to improve the wellbeing of individuals,
society, and the planet. The end goal of Positive
Computing is that, in the future, digital technology
contributes positively to the personal growth of the
user and inspires the community (Calvo and Peters,
2014).
Models of Emotions. Main types of models are:
dimensional and categorical. Dimensional models are
based on orthogonal dimensions, like VA: valence
(polarity) and arousal (intensity), that can be
represented in a circumplex (Russel, 1980).
Categorical models, on the other hand, make a
correspondence between emotions and discrete states.
Anger, disgust, fear, joy, sadness and surprise were
recognized by Ekman (1992) as basic categorical
emotions based on facial expressions displayed and
recognized across different cultures. Categorical
emotions can also be represented in Russell’s
circumplex model; where, for example, anger and
sadness have negative valence with high and low
arousal; and in the positive valence (often associated
with positive psychology and wellbeing) happiness
and calmness have high and low valence,
respectively. The 3D model (both dimensional and
categorical) created by Plutchik takes into account
polarity, similarity and intensity dimensions
(Plutchik, 1980). Eight primary emotions are used
here, the six from Ekman, plus anticipation/interest
and trust/admiration. They are represented in
different colors around the center, the intensity
varying in the vertical dimension, in three levels.
The wellbeing factors include positive emotions,
and sometimes also engagement and meaning (e.g. in
positive psychology, those are the three dimensions
considered, later extended with relationships and
achievement (Seligman and Csikszentmihalyi,
2000)); and self-awareness, mindfulness, empathy
and compassion may as well be considered among
such factors (Calvo and Peters, 2014).
Physiological Signals and Sensors. The
physiological signals to obtain objective measures of
emotions are related to the central and peripheral
nervous systems, being possible to assess emotions
for which the user may or may not be consciously
aware of (Ferreira et al., 2019). We refer to the ones
we are using. Electroencephalographic (EEG) signals
translate brain’s electrical activity, and their
frequency components (delta, theta, alpha, beta and
gamma) have been used to assess arousal, valence and
dominance (Reuderink et al., 2013), as well as
sleepiness, attentiveness and meditative states (Ahani
et al., 2014; Hirshkowitz and Sharafkhaneh, 2005;
Marrufo et al., 2001). Electrocardiography (ECG)
measures the electrical activity of the heart, being
used to assess arousal via heart rate (HR) and its
variability (HRV). The electrodermal activity (EDA),
or galvanic skin response (GSR), is widely used to
assess arousal. When in stress, the skin sweats more
and its conductance increases. These signals can also
be used combined to improve accuracy in emotion
detection (Kim et al., 2004).
Applications. There are several applications,
commercial or in research, that focus on emotions and
explore the emotional states of the user with the
intention of improving user’s experience and
performance. Some of these applications are based on
mindfulness and other types of meditation (Ahani et
al., 2014; Amores et al., 2016), like Headspace
(.com), Calm (.com) and the Mindfulness App
(themindfulnessapp.com). These three applications
teach how to meditate with guided sessions (helping
people with stress, focus and sleep problems) and
how to have a healthier state-of-mind with a mindful
lifestyle, but cannot measure the user's emotional and
meditative states in real time with accuracy. Sites like
Netflix, YouTube, Vimeo and Ted (.com) are widely
used to access video, others like Pinterest (.com)
allow collecting and managing images and other
media. But do not support an emotional dimension.
Relevant backgroung (Chambel et al., 2011b;
2013; and Oliveira et al., 2013) includes: models and
representations of emotions; the emotional
classification of movie content (through content
analysis, and also estimating wellbeing (Mazeika et
al., 2022)), and their impact on viewers (through
physiological measures, e.g. (Joaquim et al., 2020));
video access and visualization; and eliciting and
visualizing emotions. Here we highlight a few
approaches and applications: In iFelt (Oliveira et al.,
2013), videos were classified and accessed based on
the emotions felt by the user while watching them, by
making use of three biosensors (respiration, heart
rate, and EDA/GSR) to detect five of Ekman’s basic
HUCAPP 2024 - 8th International Conference on Human Computer Interaction Theory and Applications
370
emotions (all but surprise), and representing them
with Plutchik’s color model in the movie spaces and
timelines in the interface. MovieClouds (Chambel et
al., 2013) further adopted a tagcloud paradigm to
access and watch movies based on its content, mainly
audio and subtitles, with a focus on emotions
expressed in subtitles, detected as the mood of the
music, and felt by the users; later enriched with user
annotation (Gomes et al., 2013; Nunes et al., 2022).
But the initial emotional model used was quite poor
(Ekman’s has one positive emotion) when we aim to
support wellbeing, where positive emotions are richer
and more prevalent.
In other approaches like (Chec, 2015), ECG
signals were used to modulate a video gaming
experience: the more anxious the user, the more
challenging the game becomes. Others use virtual
reality and sensors to influence the experience, often
in games (Reuderink et al., 2013; Chec et al., 2015;
Kim et al., 2004; Halbrook, 2019). But these do not
discriminate emotions or meditative states, nor focus
on media access as we aim to. The group of Picard on
Affective Computing has extensively used sensors
and cameras to help deal with factors such as stress,
sleep, attention, associated with wellbeing, e.g.
(McDuff el al., 2013; Sano, 2015), and more recently
presented a robotic coach integrating technologies to
deliver interactive positive psychology interventions
and build rapport with college students (Jeong et al.,
2023). But usually not with media. Exceptions
include facial expression analysis to detect users’
reactions (liking) to video ads (McDuff et al.,
2013). In another approach, Chu et al. (2020)
proposed recommending movies that are meaningful
to users (based on their highly specific everyday life
experiences), for the therapeutic potential to possibly
affect their sense of overall wellbeing. But do not
provide the means to assess their emotional or
meditative states, nor to support the media access
with this increased awareness.
In (Chambel et al., 2013) work related with
accessing music based on consumer’s mood was
presented. Rothera explored the perspective of the
creator, through Flutter (Stinson, 2015), an
experimental app that uses music to help those
experiencing the loss of a loved one, by expressing
themselves in a safe and positive environment; and
Nave, et al. (2016) explore emotions through
painting, photography and writing. The focus being
on expression, like in a journal, not in detection, and
was explored further in (Nave et al., 2023) to inform
the design of affective self-reporting.
3 Media4WellBeing APPLICATION
This section sumarizes main options and features of
Media4WellBeing, with a strong focus on video, for
its richness. Information obtained from the sensors to
assess emotional and meditative states, while users
access media, is presented in visualizations and
catalogs media for future access. Users are provided
with different perspectives of media impact on these
states, while accessing and possibly collecting them
in personal journals.
3.1 Physiological Signals and Sensors
Media4WellBeing uses the Muse headset for EEG
with dry electrodes (Muse-1, Muse-2). Besides raw
EEG data, it provides absolute and relative values for
the five frequency bands and for concentration and
meditation/mellow (up when relaxing, but still alert
to our senses). Valence was computed as the frontal
left-right hemispherical asymmetry derived from the
relative power of alpha waves. For computing
arousal, ECG and EDA signals were measured using
the BITalino board (Batista et al., 2019, BITalino-1
and 2), and using two wet electrodes in the wrists for
ECG, and two on left-hand fingers for EDA, using
prior 15 min in low-stimuli environment to get neutral
baseline responses. Muse and BITalino allow real-
time readings.
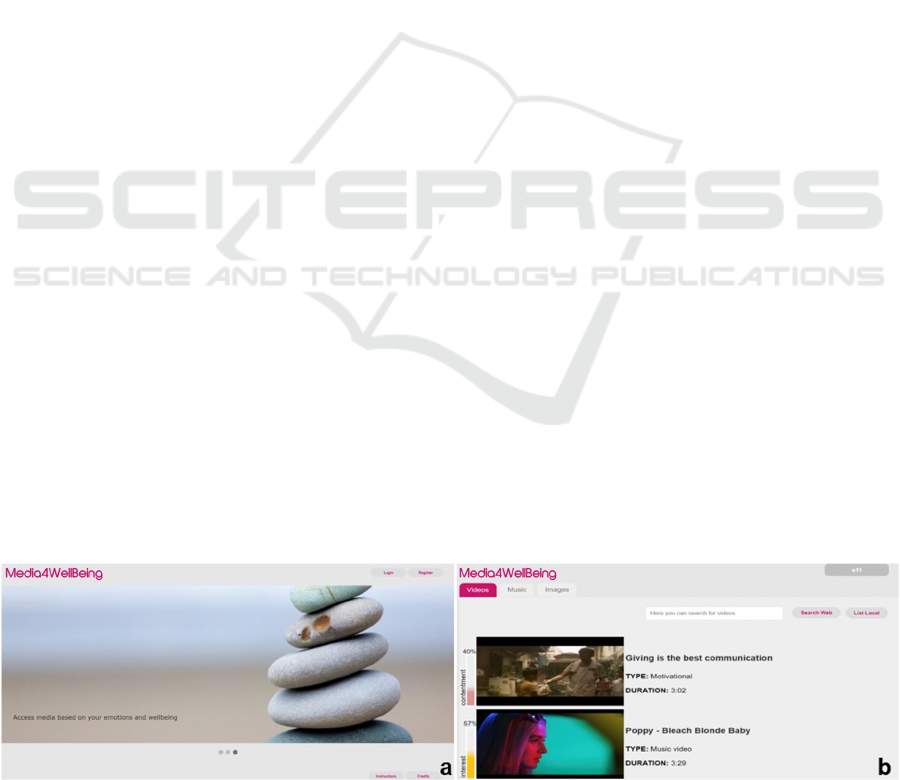
Figure 1: Media4WellBeing: a) Homepage; b) List of videos with color bars and dominant emotion %.
Emotional and Meditative States in Interactive Media Access with a Positive Computing Perspective
371
3.2 Homepage and List of Searched
Videos
The homepage (Fig.1a) sets the mood for wellbeing
in contextual images, and offers the opportunity for
registration and login, and to access media organized
as: videos, music, and images. In the videos tab
(Fig.1b), videos can be searched. The list of results
highlights the dominant emotion felt for each video in
a colored bar reflecting the % of dominance, on the
left. Each video may be selected, explored and
watched in different views, highlighting its impact on
emotional and meditative states, as described next.
3.3 Emotional States
This sub-section presents the emotional model and
colors defined and adopted, followed by emotion
identification, and the interactive visualizations.
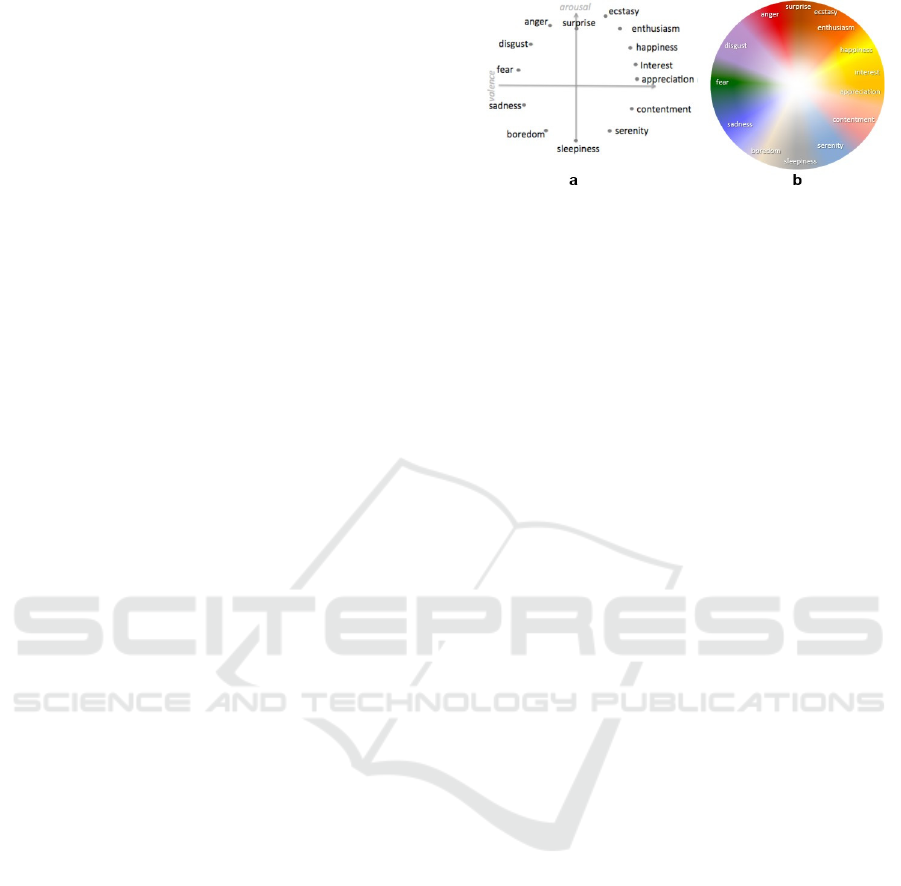
Emotional Model. Our model (Fig.2a) has 14
categorical emotions, distributed along Russell’s 2D
circumplex, using arousal and valence as its
dimensions (Russel, 1980). It includes the six basic
emotions of Ekman, enriched with emotions from
Plutchick’s like appreciation, interest, ecstasy,
contentment, serenity and boredom; enthusiasm
(based on users’ choices in (Chambel et al., 2011b)),
and sleepiness. These emotions were chosen to have
at least 2 emotions in each quadrant, to align with
most used models, to be richer than Ekman’s (that
only has one positive emotion), to capture emotions
often associated with media and films (Chambel et
al., 2011b), and to simplify the process of identifying
categorical emotions through arousal and valence.
More details in (Bernardino et al., 2016).
Colors of Emotions. For familiarity, colors were
chosen based on Plutchik’s, extended and adapted for
Russell’s circumplex (Fig.2b). E.g. high arousal and
valence have more vibrant, warm colors. This circle
is the underlying reference color used in the
visualizations.
Identifying and Representing Emotions.
Emotions were detected with the aid of EEG, ECG
and EDA sensors and by computing the values of
valence and arousal (VA) (Sec. 2 and 3.1). Computed
values are parsed for valence (x-axis) and arousal (y-
axis) mapped into the coordinates in the emotional
circumplex or graph (Fig.3a). Emotions are then
presented in different ways, depending on the
selected view:
Figure 2: Media4WellBeing Emotional Model: a)
categorical emotions placed in Russel’s bidimensional
circumplex, graph, or wheel of emotions; b) colors used for
the emotions underlying the wheel in Fig.3a).
For each coordinate, there is a corresponding
underlying color (Fig.2a-b, Fig.3a). The correspon-
dence to categorical emotions (e.g. for the tagcloud),
in our approach, is then computed based on the
Euclidian proximity to the emotions depicted around
the graph (Fig.3a).
EmoPaint. Emotions are painted as colored dots
in the emotional circumplex, based on valence and
arousal. The categorical emotions are labeled all
around to help users identify the closest emotions.
Colors are painted like scratches (Scratch Art
metaphor) allowing to show the underneath colormap
(Fig.3a) based on VA position. In all EmoVisua-
lizations, emotions are represented on the side, in
synchrony with the video being watched, and can be
hidden, accessed later, and played back as animations
(as explained below).
Users can change configurations - through the
switches below the visualization (Fig.3a) – e.g. to
have the drawing as continuous lines or as points; in
a uniform frequency (1/ sec), or according to users’
heart beat rate. This option is based on the sense of
comfort and intimacy it may provide (Janssen et al.,
2020) and as an additional factor for wellbeing.
EmoClouds. Emotions are displayed on a colored
tag cloud, reflecting their frequency (Fig.3b). A tag
grows each time its emotion is detected. This
visualization reflects the power, flexibility,
engagement and fun usually associated with tag
clouds (Chambel et al., 2013).
EmoChart. A bar chart is used in this view
(Fig.3c). Every time an emotion is detected, its bar
increases in size. Hovering a bar, shows the emotion
and its frequency.
HUCAPP 2024 - 8th International Conference on Human Computer Interaction Theory and Applications
372
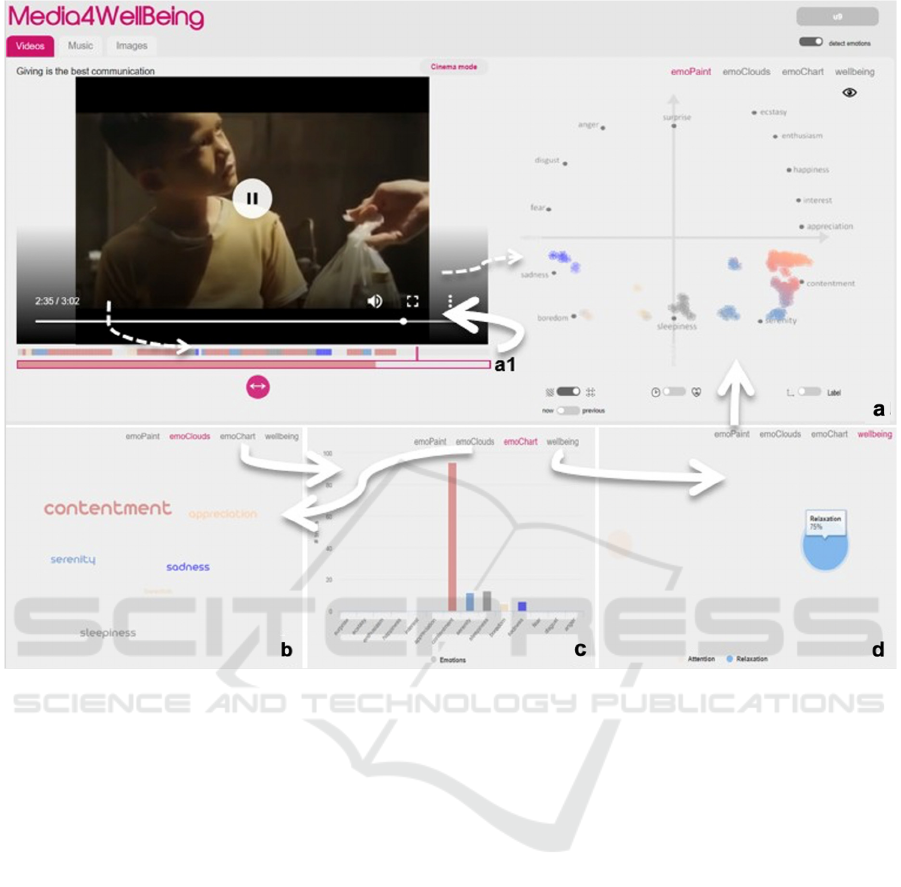
Figure 3: Emotional Views while watching video: a) emoPaint; a1) emotional timelines (top: full video; bottom: detail of
current emotion); b) emoClouds; c) emoChart; d) wellbeing. Arrows: navigation; dashed arrows: synch with video.
Independent of EmoView, these functionalities can
enrich the experience as a whole:
Emotional Timelines. In dynamic content (music
and videos), there are two timeline bars displaying the
evolution of users’ emotions along time. The top bar
represents the whole video length, whereas the
bottom bar represents a zoom-in of the current
emotion in time. The frame of this bar is of the same
color of the thin frame representing current time in
the top bar. These timelines are synchronized with the
media being played, updating current time and
emotion; and are interactive, allowing to index any
chosen time in the media to watch/access it directly
(Fig.3a1).
Increased Immersion and Flexibility. Full-
screen and cinema modes allow users to watch videos
in a more immersed way, clear of intrusive or
extraneous information and avoiding split attention.
Animation allows the flexibility to replay dynamic
emotional representations:
• Full-Screen. When entering this mode, the
emotional visualization is displayed in the
bottom right corner, in a smaller size, so that
feedback is given in a less intrusive way;
• Cinema Mode. Where the theme of the current
page changes, becoming darker, to help
increased concentration on the content;
• Animation of recorded emotional data. Users can
review their emotions felt for that content on
different days and times through the “Previous”
option below each visualization. The replay is
animated; and can be synchronized with the
content.
Statistics. Presents usage statistics based on user
sessions: how many videos have been watched, % of
detected emotions, and lists of most/recently accessed
contents.
3.4 Meditative States and Personal
Journal
The meditative states views and the personal journal
features are summarized next.
Emotional and Meditative States in Interactive Media Access with a Positive Computing Perspective
373
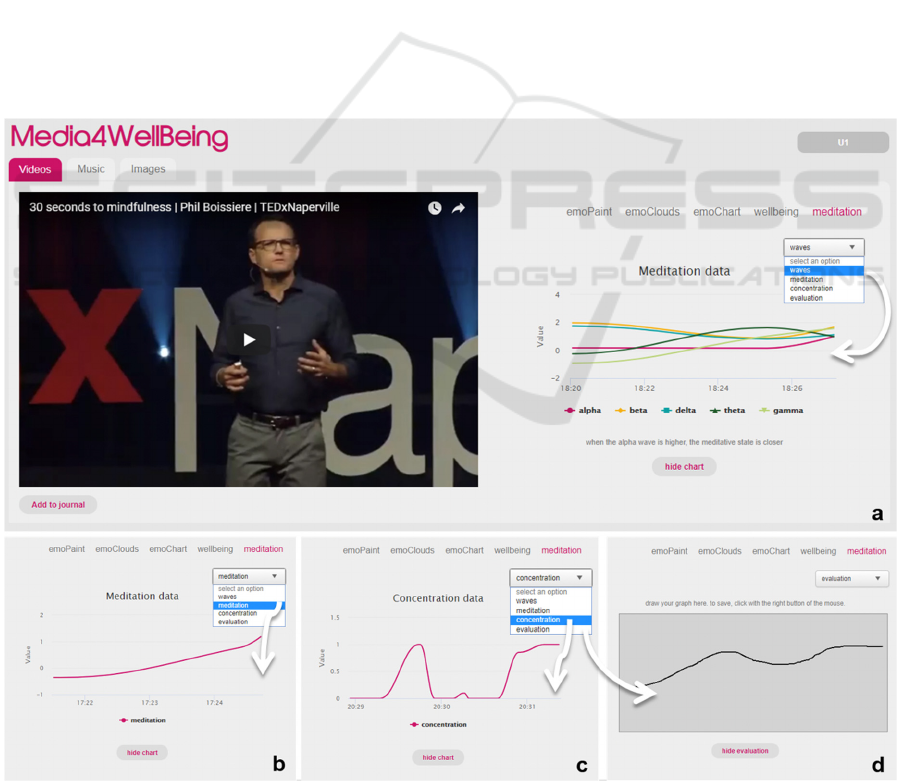
Waves Graph. Shows Alpha, Beta, Delta, Theta
and Gamma EEG frequency components (Fig.4a).
Alpha waves (8-12 Hz) are dominant during quietly
flowing thoughts, when the user is relaxed and awake,
but with the eyes closed and in some meditative states
(Aubrey, 2010; Brainworks). Beta waves dominate
our normal waking state of consciousness when
attention is directed towards cognitive tasks and the
outside world. These waves are further divided into
three bands: Low-Beta (12-15 Hz) can be thought of
as a 'fast idle', or musing. Beta (15-22 Hz) is high
engagement or actively figuring something out. Hi-
Beta (22-30 Hz) is highly complex thought,
integrating new experiences, high anxiety, or
excitement. Delta are generated in deepest meditation
and dreamless sleep, are the brain waves with greater
amplitude and lower frequency, and are common
during sleep and in awake children. Theta is our
gateway to learning, memory, and intuition and is
common in newborns and adults during sleep. Theta
rhythms increase in awake adults while performing
tasks that require attention and memory, during sleep
deprivation and during loads of emotional stress (Fox,
2011). Lastly, Gamma waves have the highest
frequency and relate to simultaneous processing of
information from different brain areas. These five
brain waves are represented with a difference
between left and right sides of brain and goes from
minus 2 to 2; and users can select brainwaves, by
clicking the ones they are interested to follow.
Meditation and Concentration Graph. The
Meditation Data (Fig.4b) is based on Theta; and the
Concentration Data (Fig.4c) is based on Gamma
waves (Muse-2).
Personal Journal. Journals are often used for
collecting experiences and capturing unexpected
moments (by serendipity) (Chambel, 2011a). In our
application, users can add videos and graphs from
their own perspectives of concentration and
meditation lines (Fig.4d) to their personal journal, for
later access. Tags can be added and suggested for
organization and search purposes.
Figure 4: Meditative Views: a) Waves Graph; b) Meditation Graph; c) Concentration Graph; d) User Perspective:
users draw their graph of meditation or concentration, and save it in the Personal Journal.
HUCAPP 2024 - 8th International Conference on Human Computer Interaction Theory and Applications
374

4 USER EVALUATION
The objectives, methodology, participants and results
of the user evaluation conducted to assess
Media4WellBeing’s functionalities, usability and
user experience, are summarized next.
4.1 Objectives
The main objectives include assessing perceived: 1)
(U)sefulness; 2) (S)atisfaction; and 3) (E)ase-of-use,
based on the USE dimensions (Lund, 2001); and in
addition: 4) Efficacy of the Visualizations (EV); and
5) Efficacy of Identification (EI) of emotional and
meditative states, based on the sensors. It is a usability
evaluation to find out how Media4WellBeing might
be perceived, as a proof of concept and to get users’
feedback for future developments.
4.2 Methodology
This evaluation was based on semi-structured
interviews and user observation while performing
pre-defined tasks. After briefing the subjects about
Media4WellBeing and the evaluation, demographic
questions were asked to characterize the users and to
get them more in tune with their own motivations and
attitudes in this context, before using the app. We
followed ethical and legal practices accounting for
confidentiallity, as approved by the Ethics
Commission of our institution. As a first task, sensors
were calibrated to obtain baseline (15 sec for Muse
and 15 min for BITalino). After each task, focusing
on a feature, users provided ratings (on a 1-lowest to
5 scale) for the 5 dimensions above (U, S, E, EV and
EI) and commented. In the end, highlighted what they
liked the most, gave suggestions, and characterized
the application selecting among 46 quality terms
(Hassenzahl et al., 2000).
4.3 Participants, Background and
Preferences with Media
Ten users (6 male and 4 female), 18-29 years old
(22.5 mean) participated. Nielsen defends that 5-8 is
a good number of participants in usability tests, we
rounded up to 10, for diversity, testing all the features,
with gender balance, and experienced with
PC/internet (but new to our app). Age was not an
issue at this stage, but we chose diverse backgrounds:
3 had college degrees, 2 in Computer Science and 1
in Psychotherapy, who might also provide more
expert reviews about this app for wellbeing.
Awareness, Motivations and Attitudes about
Emotional Impact in Media Access. Users strongly
agreed (Mean in 1-5 scale) that accessing media can
affect emotions (4.9 music, 4.8 videos and 4.5
images). They often feel the need to turn to media to
achieve specific emotional states (4.6 music, 4.2
videos, 3.6 images). Main reasons: “to be informed”
(4.6); “feel more relaxed” (4.5), or “feel good” (4.4).
Applications and Physiological Sensors.
YouTube (4.6) and Spotify (3.5) were the most used
apps to access media to achieve wellbeing. Six users
had previous experience using physiological sensors;
eight said they would use sensors to be aware of and
regulate emotional states and wellbeing. Regarding
applications, two mentioned using Muse app occa-
sionally, and one using “Sleep as Android” to find
optimal moments to wake up (sleep.urbandroid.org).
4.4 Results
Main results are presented for the evaluation of
Media4WellBeing to support emotional and
meditative states, performed in random order by all
the participants.
Emotional States. The calibration phase (T1) was
considered useful and easy, though not very pleasant
(S:2.9) (Table.1). To test emoPaint (T2.1-5) users
accessed an image and a couple of videos, in different
modes regarding the visualization of the emotional
states detected. Most users said the emotions they felt
were reasonably correct (EI) and agreed that the
detected emotions were perceivable in the
visualization (EV). All prefered keeping the
visualizations hidden while watching (accessing
afterwards), to be more focused. Three users noted
the difference when heart beat rate was used, but did
not make them feel calmer (we’ll test heart beat in the
future). Users preferred the points vs. line view. In
emoClouds (T3) and emoChart (T4), all users easily
identified the most/less frequent emotions, found
them easy and satisfying; though emoChart more
useful, and more familiar to present frequencies. Most
users understood and appreciated the timelines (T5).
Most users preferred the full-screen mode (T6). The
cinema mode would be used at night and when tired.
Users appreciated the lateral bar with dominant
emotion in video lists (T7.1) and the possibility to
access emotional states previously felt. In T8, all
users understood the “statistical” information about
content accessed and felt emotions in the session, but
a bit less useful or satisfactory than most previous
features, they found more novel.
Emotional and Meditative States in Interactive Media Access with a Positive Computing Perspective
375

Table 1: USE and Efficacy of Visualizations and Identification for Emotional and Medidative States (Scale: 1-5; U:
Usefulness; S: Satisfaction; E: Ease-of-Use; EV: Efficacy-of-Visualization; EI – Efficacy-of-Identification; M: Mean; SD:
Standard deviation).
Tas
k
T#
Emotional States
Feature
M
U
SD
M
S
SD
M
E
SD
EV
M SD
M
EI
SD
T1 Calibration of sensors 4.7
0.7 2.9
1.0 4.3
0.8 - - - -
emoPaint: (mean) 4.5
0.
6
4.5
0.5 4.
7
0.5 3.9 0.9 3.
6
1.
0
T2.1 emoPaint with image (lines) 4.6
0.7 4.3
0.5 4.8
0.4 3.5 1.5 3.7 1.3
T2.2 emoPaint compassion video 4.5
0.7 4.6
0.5 4.7
0.7 3.9 0.7 3.8 0.9
T2.3 emoPaint nature relaxing video 4.6
0.5 4.6
0.5 4.9
0.3 4.3 0.6 3.9 0.9
T2.4 emoPaint same video (points) 4.8
0.4 4.7
0.5 4.8
0.4 -- - -
T2.5 emoPaint like T2.3 (heart rate) 4.2
0.8 4.3
0.7 4.5
0.7 - - 3.1 0.8
T3 emoClouds 4.5
0.7 4.8
0.4 4.9
0.3 3.6 1.3 - -
T4 emoChart 4.7
0.5 4.8
0.4 4.9
0.3 4.1 0.9 - -
T5 Timelines in a video 4.1
1.0 4.4
0.7 4.9
0.3 - - - -
T6 Full-screen and cinema modes 4.8
0.4 4.7
0.7 4.8
0.3 - - - -
Emotional states history: (mean) 4.
6
0.
6
4.5
0.
6
4.8
0.4 - - 3.9 1.2
T7.1 Dominant emotion bars 4.6
0.7 4.5
0.7 4.9
0.3 - - 3.9 1.2
T7.2 View previous emotional states 4.6
0.5 4.5
0.5 4.7
0.5 - - - -
T8 Statistics 4.5
1.0 4.5
0.7 4.8
0.4 - - - -
Total (mean) - Emotional States 4.6
0.6 4.4
0.6 4.8
0.4 4.0 0.9 3.9 0.9
Tas
k
T#
Meditative States
Feature
M
U
SD
M
S
SD
M
E
SD
M
EV
SD
M
EI
SD
T1 Meditation Graph 4.4
1.0 4.7 0.5 4.8
0.4 4.2 0.4 3.
7
1.2
T2 Draw of Meditation Graph 4.6
0.7 4.5 0.5 4.7
0.5 - - 3.1 1.3
T3 Concentration Graph 5.0
0.0 4.8 0.4 5.0
0.0 4.6 0.7 4.
4
1.0
T4 Draw of Concentration Graph 5.0
0.0 4.7 0.5 4.9
0.3 -- 3.
4
1.8
T5 Waves Graph 4.7
0.7 4.7 0.5 4.8
0.4 4.2 0.4 3.
4
1.2
T6 Journal 5.0
0.0 4.7 0.7 5.0
0.0 -- - -
Total
(
mean
)
- Meditative States 4.8
0.4 4.7 0.5 4.9
0.3 4.3 0.5 3.
6
0.9
Meditative States. These features were also
appreciated, found very useful, easy to use and quite
satisfactory. Some users did not understand the
Meditation Graph at first (T1 with music video), not
being familiar with meditation, but recognized its
usefulness and found it quite interesting in the end.
The Concentration Graph (T3 with a TED Talk video)
was more readily understood and appreciated. The
information presented was believed to be correct and
found useful in the cases they thought were more
concentrated than it was detected. Only one user had
difficulty drawing and saving graphs from his
perspective (T2, T4), although a couple mentioned
not being easy to draw with a mouse; and most
reported some differences or having been influenced
by detected graphs seen before, but appreciated
registering their own perspectives. Most users
preferred watching videos in full-screen, and seeing
the graph of the app after their own. Waves Graph (T5
with video on compassion) was found interesting and
informative by nine users, and a couple suggested to
add labels explaining meaning of each brainwaves. In
T6, users added a video to the journal with tag
‘inspiring’ and explored the tabs. None felt difficulty,
finding the journal very useful in the long-term. There
were suggestions to have the color of graphs in blue
or green (that they associate with wellbeing), to make
brainwaves colors more distinct, and to have search
and organization of videos by tag, and graphs by days,
weeks or sessions, not only by type.
Global Evaluation. At the end, the order of
preference in emotional states was: emoPaint,
emoChart, and emoClouds. Cinema mode, the
timelines and statistics page were also mentioned as
favorite functionalities. The most appreciated aspects
in meditative states were: “the idea”, “to watch
lectures and see my concentration state”, “to learn
how to meditate and see the results”, and “to collect
memories on a virtual journal, like I do in real life”.
After 30 minutes with Muse, users were feeling
discomfort.
Most chosen quality terms for both States (Table
2) refer to the appeal and hedonic category, and
almost all are positive (the table had 23 positive and
23 negative/opposite terms). The exception being six
users selecting Unpredictable for Emotional states,
HUCAPP 2024 - 8th International Conference on Human Computer Interaction Theory and Applications
376
Table 2: Number of users choosing each Quality term (Hassenzahl et al., 2000) to describe Emotional States (E) and
Medidative States (M) in the Media4WellBeing app, from (E: Ergonomic; H: Hedonic; and A: Appeal) terms.
E M Terms E M Terms
E MTerms
10 10 E Supporting 10 10 A Desirable 9 10 A Inviting
10 10 H Interesting 10 9
E
Comprehensible 9 9 E Trustworthy
10 10 H Impressive 10 9
E
Clea
r
9 7 H Costly
10 10 A Pleasant 10 9
H
Exciting 7 8 E Simple
10 10 A Goo
d
109
H
Exclusive
6
7 E Un|Predictable
10 10 A Aesthetic 10 9
H
Original 6 7 E Familia
r
10 10 A Attractive 10 9
H
Innovative 5 7 E Controllable
10 10 A Sympathetic 10 9
A
Motivating
yet balancing with 7 Predictable; aligning with having
some uncommon representations, and this being the
first contact with the application; and being found
Original and Innovative by all the participants (with
an underlying unpredictability).
5 CONCLUSIONS AND
PERSPECTIVES
We discussed the computational and physiological
sensor technology symbiosis to support the access of
media based on emotional impact and meditative
states. Media4WellBeing is being designed and
developed as an interactive web application to
provide this support, and its components were
described and tested in a preliminary usability
evaluation. Most users learned fast and stayed
engaged with the application, having found it very
useful, satisfactory and easy to use. These high scores
reflect their enthusiasm about the application. They
liked the concept and found it very appealing and
novel. Good but not so high the scores about efficacy
of visualization at first (while unfamiliar with them)
and the efficacy of identification. Not surprising
though, since users are not used to being aware of
their emotions and the detection is a research topic,
still appearing fairly effective in our approach.
In sum, we got relevant and encouraging feedback
for future improvements, and a preliminary
recognition of our core contributions: 1) a rich model
that extends standard ones with emotions relevant in
media and wellbeing (Chambel et al., 2011b;
Bernardino et al., 2016), that users can recognize; 2)
an approach to capture richer emotions, using
physiological sensors to measure: arousal & valence,
interpreted with our model to identify and output rich
emotions; and brainwaves to identify meditation and
concentration levels; and 3) rich and flexible
interactive mechanisms to increase awareness about
users’ emotions and meditative states, when
accessing and navigating media based on these
dimensions.
Future work includes: tuning further the precision
of emotion detection; adopting more unintrusive and
ubiquitous sensors; revising and exploring further
new ways of providing emotional awareness and
regulation with media; helping to reach higher
meditative states, exploring non-visual feedback
(besides current support for increased immersion) to
enrich users support while focusing on the content;
and enriching the personal journal with information
that supports self development in the longer run.
These directions in the support of welbeing in
media access align with coping strategies (Wolfers
and Schneider, 2021) found relevant in different
perspectives, including emotion regulation; and align
with longer term interventions envisaged to support
positive functioning and wellbeing, that has been
linked with better physical health and greater
longevity (Kubzansky et al., 2023), reinforcing a path
to follow.
ACKNOWLEDGEMENTS
This work was partially supported by FCT through
the AWESOME project, ref. PTDC/CCIINF/29234/
2017, and the LASIGE Research Unit, ref.
UIDB/00408/2020 (https://doi.org/10.54499/UIDB/
00408/2020) and ref. UIDP/00408/2020 (https://
doi.org/10.54499/UIDP/00408/2020); as well as FCT
UIDB/00645/2020 (https://doi.org/10.54499/UIDB/
00645/2020) and UIDP/00645/2020 (https://doi.org/
10.54499/UIDP/00645/2020) for IBEB.
REFERENCES
Ahani, A., Wahbeh, H, Nezamfar, H, Miller, M, Erdogmus,
D., and Oken, B (2014) Quantitative change of EEG
and respiration signals during mindfulness meditation.
Emotional and Meditative States in Interactive Media Access with a Positive Computing Perspective
377

Journal of Neuroengineering and Rehabilitation, vol
11, no 87, pp. 1-1.
Amores, J, Benavides, X, and Maes, P (2016) PsychicVR:
Increasing mindfulness by using Virtual Reality and
Brain Computer Interfaces. In 2016 CHI Extended
Abstracts, pp. 2-2.
Aubrey, B (2010) Managing Your Aspirations: Developing
Personal Enterprise in the Global Workplace.
McGraw-Hill.
Batista, D., Plácido da Silva, H., Fred, A., Moreira, C., Reis,
M., and Ferreira, H. A. (2019). Benchmarking of the
BITalino biomedical toolkit against an established gold
standard. Healthcare Technology Letters, 6(2), 32-36.
Bernardino, C., Ferreira, H., and Chambel, T. (2016)
Towards Media for Wellbeing. In Proc. of ACM TVX
2016: International Conference on Interactive
Experiences for TV and Online Video, pp 171-177.
BITalino-1: open-source biosignals platform
https://www.pluxbiosignals.com/collections/bitalino
BITalino-2: Mini User Manual. https://bitalino.com/
storage/uploads/media/bitalino-mini-user-manual.pdf
Brainworks, What are Brainwaves? https://brainworks
neurotherapy.com/about/faq/what-are-brainwaves/
Calm App. https://www.calm.com
Calvo, R and Peters, D (2014) Positive Computing:
Technology for Wellbeing and Human Potential, MIT
Press.
Chambel, T. (2011a) Towards Serendipity and Insights in
Movies and Multimedia. In Proc. of International
Workshop on Encouraging Serendipity in Interactive
Systems. Interact'2011: "13th IFIP TC13 International
Conference on Human-Computer Interaction", pp. 12-
16, Lisbon, Portugal.
Chambel, T., Langlois, T., Martins, P., Gil, N., Silva, N.,
and Duarte, E. (2013) Content-Based Search
Overviews and Exploratory Browsing of Movies with
MovieClouds. Int. Journal of Advanced Media and
Communication, InderScience, 5(1), pp. 58-79.
Chambel, T., Oliveira, E., and Martins, P. (2011b). Being
Happy, Healthy and Whole Watching Movies that
Affect our Emotions. In Proc. of ACII 2011, 4th Int.
Conf. on Affective Computing and Intelligent
Interaction, pp. 35-45.
Chec, A, Olczak, D, Fernandes, T and Ferreira, H A (2015)
Physiological computing gaming: Use of
electrocardiogram as an input for video gaming. In
Proc. of the Int. Conf. on Physiological Computing
Systems (PhyCS), pp. 157-163.
Chu, S.L., Brown, S., Park, H. and Spornhauer, B. (2020),
Towards personalized movie selection for wellness:
investigating event-inspired movies. Int. Journal of
Human Computer Interaction, 36(16), pp. 1514–1526.
Ekman, P. (1992) Are there basic emotions? Psychological
Review, 99(3), pp. 550-553.
Ferreira, H., Saraiva, M., and Ayanoğlu, H. (2019).
Subjective and Objective Measures. In: Hande
Ayanoğlu, and Emília Duarte (Eds). Emotional Design
in Human Robot Interaction: Theory, Methods and
Application. Springer Nature, pp. 143-159.
Fox, S. I. (2011). Human Physiology. New York, NY:
McGraw-‐Hill.
Gomes, J.M.A., Chambel, T., and T. Langlois (2013)
Engaging Users in Audio Labelling as a Movie
Browsing Game With a Purpose. In Proc. of ACE' 2013,
10th International Conference on Advances in
Computer Entertainment Technology, Univ. of Twente,
NL, Nov 12-15, LNCS, vol 8253, pp.296-307.
Halbrook, Y. J., O’Donnell, A. T., and Msetfi, R. M.
(2019). When and how video games can be good: A
review of the positive effects of video games on well-
being. Perspectives on Psychological Science, 14(6),
1096-1104.
Hassenzahl, M, Platz, A, Burmester, M and Lehner, K
(2000) Hedonic and ergonomic quality aspects
determine a software’s appeal. Proc. of CHI Conf. on
Human Factors in Computing Systems, vol 2, pp. 201-
208.
Headspace App https://www.headspace.com
Hirshkowitz M and Sharafkhaneh A (2005) The physiology
of sleep. In Guilleminault C (Ed) Handbook of Clinical
Neurophysiology, 1(1), pp. 3-20.
Janssen, J, Bailenson, J, IJsselsteijn, W, Westerink, J (2010)
Intimate heartbeats: Opportunities for affective
communication technology, IEEE Trans. on Affective
Computing, 1(2), pp. 72-80.
Jeong, S., Aymerich-Franch, L., Arias, K. et al. (2023)
Deploying a robotic positive psychology coach to
improve college students’ psychological well-
being. User Model User-Adap Inter 33, 571–615.
Jeong, S., Aymerich-Franch, L., Arias, K., Alghowinem, S.,
Lapedriza, A., Picard, R., ... and Breazeal, C. (2023).
Deploying a robotic positive psychology coach to
improve college students’ psychological well-
being. User Modeling and User-Adapted
Interaction, 33(2), 571-615.
Joaquim, M. S., Maçorano, R., Canais, F., Ramos, R., Fred,
A. L., Torrado, M., and Ferreira, H. A. (2020). Learning
data representation and emotion assessment from
physiological data. In IEEE International Conference
on Acoustics, Speech and Signal Processing (ICASSP),
pp. 3452-3456.
Kabat-Zinn, J. (2023). Wherever you go, there you are:
Mindfulness meditation in everyday life. 30th edition,
Hachette UK.
Kim, J, Bee, N, Wagner, J and André, E (2004) Emote to
win: Affective interactions with a computer game
agent. GI Jahrestagung, vol 1, pp. 159-164.
Kubzansky, L. D., Kim, E. S., Boehm, J. K., Davidson, R.
J., Huffman, J. C., Loucks, E. B., ... and Moskowitz, J.
T. (2023). Interventions to Modify Psychological Well-
Being: Progress, Promises, and an Agenda for Future
Research. Affective Science, 4(1), 174–184.
Lund, A M (2001) Measuring Usability with the USE
Questionnaire. In Usability and User Experience,
Chapter 8, vol 2.
Marrufo, M V, Vaquero, E, Cardoso, M J and Gomez, C M
(2001) Temporal evolution of α and β bands during
visual spatial attention. Cognitive Brain Research, 12
(2), pp. 315-320.
HUCAPP 2024 - 8th International Conference on Human Computer Interaction Theory and Applications
378

Mazeika, M., Tang, E., Zou, A., Basart, S., Chan, J. S.,
Song, D., ... and Hendrycks, D. (2022). How Would
The Viewer Feel? Estimating Wellbeing From Video
Scenarios. Advances in Neural Information Processing
Systems, 35: 18571-18585.
McDuff, D., Kaliouby, R., Demirdjian, D., and Picard R.W.
(2013). Predicting Online Media Effectiveness Based
on Smile Responses Gathered Over the Internet. The
10th IEEE Int. Conf. on Automatic Face and Gesture
Recognition, Shanghai, China.
Mindfulness App http://themindfulnessapp.com
Muse-1: Muse - At-home biofeedback training.
http://www.choosemuse.com
Muse-2: Muse Software Development Kit.
http://developer.choosemuse.com/tools/available-data
Nave, C, Correia, N and Romão, T. (2016). Exploring
Emotions through Painting, Photography and
Expressive Writing: and Early Experimental User
Study. In Proc. of the 13th Int. Conf. on Advances in
Computer Entertainment Technology (ACE’16). ACM,
NY, USA, pp. 1-8.
Nave, C., Nunes, F., Romão, T., Correia, N. (2023).
Exploring Emotions: Study of Five Design Workshops
for Generating Ideas for Emotional Self-report
Interfaces. In: Abdelnour Nocera, J., Kristín
Lárusdóttir, M., Petrie, H., Piccinno, A., Winckler, M.
(eds) Human-Computer Interaction – INTERACT 2023.
LNCS, vol 14142. Springer, Cham.
Nunes, L., Ribeiro, C., and Chambel, T. (2022). Emotional
and Engaging Movie Annotation with Gamification.
In Proceedings of the 17th Int. Joint Conference on
Computer Vision, Imaging and Computer Graphics
Theory and Applications: VISIGRAPP /HUCAPP
Human Computer Interaction Theory and Applications,
SciTePress, pp. 262-272.
Oliveira, E., Martins, P,. and Chambel, T. (2013).
Accessing Movies Based on Emotional Impact.
ACM/Springer Multimedia Systems Journal, 19(16),
pp. 559-576.
Plutchik, R (1980) Emotion: A psychoevolutionary
synthesis. Harper & Row New York pp 3-41.
Reuderink, B, Mühl, C and Poel, M (2013) Valence, arousal
and dominance in the EEG during game play. Int.
journal of Autonomous and Adaptive Communications
Systems, 6(1), pp. 45-62.
Russell, J. A. (1980). A circumflex model of affect. Journal
of Personality and Social Psychology, 39(6), 1161-
1178.
Sano, A (2015) Measuring College Students’ Sleep, Stress,
Mental Health and Wellbeing with Wearable Sensors
and Mobile Phones. MIT PhD Thesis.
Seligman, M and Csikszentmihalyi, M (2000) Positive
Psychology: An Introduction. American Psychologist,
55(1), pp. 5-14.
Sleep as Android | https://sleep.urbandroid.org
Stinson, E. (2015). A Music-Making APP Designed to Help
Teens Deal with Death, WIRED, Design 1(15).
Wolfers, L.N., and Schneider, F.M. (2021) Using media for
coping: a scoping review. Communication Research,
48(8), pp. 1210–1234.
Zillmann, D and Vorderer, P (2008) Media Entertainment:
The Psychology of its Appeal. Lawrence Erlbaum
Associates Publishers.
Emotional and Meditative States in Interactive Media Access with a Positive Computing Perspective
379
