
Enhancing Railway Safety: An Unsupervised Approach for Detecting
Missing Bolts with Deep Learning and 3D Imaging
Udith Krishnan Vadakkum Vadukkal, Angelo Cardellicchio, Nicola Mosca, Maria di Summa,
Massimiliano Nitti, Ettore Stella and Vito Ren
`
o
Institute of Intelligent Industrial Technologies and Systems for Advanced Manufacturing,
National Research Council of Italy (CNR STIIMA), via Amendola 122 D/O, 70126 Bari, Italy
Keywords:
Anomaly Detection, Deep Learning, Computer Vision.
Abstract:
This paper delves into the realm of quality control within railway infrastructure, specifically addressing the
critical issue of missing bolts. Leveraging 3D imaging and deep learning, the study compares two approaches:
a binary classification method and an anomaly detection task. The results underscore the efficacy of the
anomaly detection approach, showcasing its ability to identify missing bolts robustly. Utilizing a dataset of
3D images acquired from a diagnostic train, treated as depth maps, the paper formulates the problem as an
unsupervised learning task, training and evaluating autoencoders for anomaly detection. This research con-
tributes to advancing quality control processes by applying deep learning in critical infrastructure monitoring.
1 INTRODUCTION
Recent advances in computer vision and artificial in-
telligence (AI) in the last years, with particular atten-
tion to quality control tasks, suggest an in-depth study
of the issues connected to the study, design, and de-
velopment of new AI models based on deep learning.
In recent years, these techniques have been applied in
numerous application contexts to solve classification
and regression problems or, more generally, supervi-
sion and predictions for quality control. On the one
hand, the research for increasingly high-performance
and specific models for Industry 4.0 application con-
texts is being pursued through the design and devel-
opment of innovative deep learning models (such as
auto-encoders or convolutional neural networks); on
the other hand there is the increasing need for the
characterization and evaluation of such models aimed
to anomaly detection, with particular attention to un-
balanced data sets, in multiple contexts (Cardellicchio
et al., 2023; Jiang et al., 2019; Wan et al., 2017; Liso
et al., 2023).
Anomalies detection is a process that requires a
machine to build a model to detect data - for example,
images - that deviate significantly from most of the
information provided in input for training. In prac-
tice, the anomalies cannot be easily predicted in all
their cases. Therefore, building suitable datasets cov-
ering the observed phenomenon’s variability becomes
difficult. Furthermore, anomalies depend on many
unknown variables and can be generated by sudden
and unknown phenomena until verified (Pang et al.,
2021).
Machine and deep learning techniques (or clas-
sification in general), used in a classical (or canoni-
cal) way, require a model to be retrained whenever a
new case study is considered. This procedure is not
straightforward to apply in real practice for many rea-
sons: the data sets that can be created are generally
very unbalanced because they contain few examples
of anomalies compared to the so-called good cases;
an anomaly can be so different from the others that
likely represent a subclass in itself; finally, detecting
complex anomalies must be as robust as possible to
noise and high data variability, considering the prob-
lems presented. Therefore, there is an increasing need
for a process capable of making quality control more
effective and robust with deep learning techniques.
Among many other contexts where deep learning
techniques can empower suitable classifiers for de-
tecting quality control or defect issues, monitoring in-
frastructures such as railways requires safety-critical
approaches. As discussed in (Di Summa et al., 2023),
different components, such as the rail surface, rail fas-
teners, pantograph, catenary, etc., can be damaged
due to wearing and tearing.
This paper is concerned with the problem of de-
tecting missing bolts, which are also used in the rail-
924
Vadakkum Vadukkal, U., Cardellicchio, A., Mosca, N., di Summa, M., Nitti, M., Stella, E. and Renò, V.
Enhancing Railway Safety: An Unsupervised Approach for Detecting Missing Bolts with Deep Learning and 3D Imaging.
DOI: 10.5220/0012570300003654
Paper published under CC license (CC BY-NC-ND 4.0)
In Proceedings of the 13th International Conference on Pattern Recognition Applications and Methods (ICPRAM 2024), pages 924-929
ISBN: 978-989-758-684-2; ISSN: 2184-4313
Proceedings Copyright © 2024 by SCITEPRESS – Science and Technology Publications, Lda.
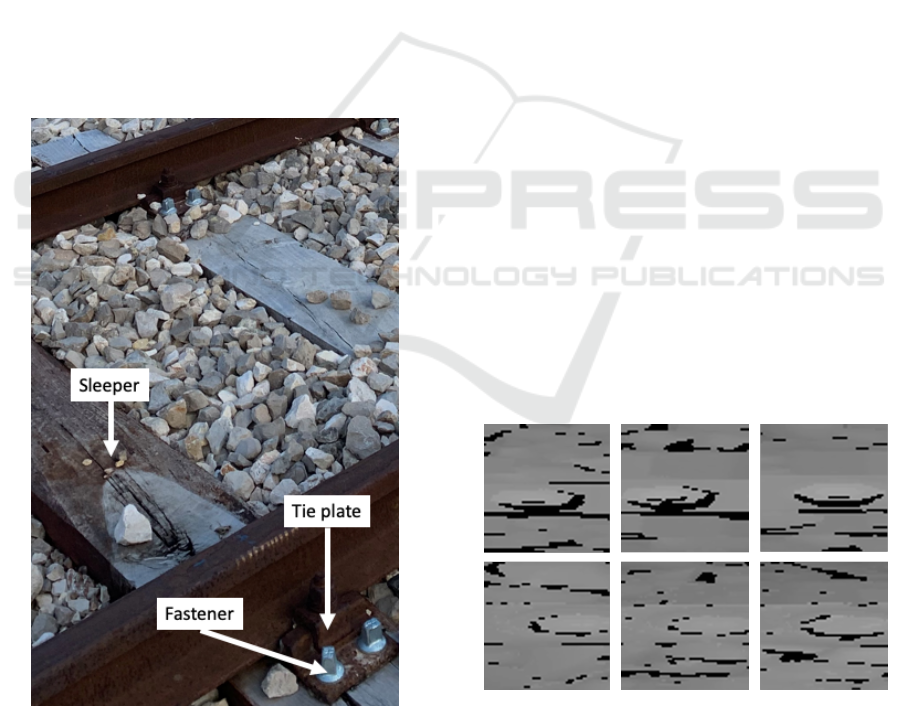
way context as fasteners for connecting the railway tie
plate with the sleeper, as shown in Figure 1. In par-
ticular, a comparative evaluation of anomaly detectors
aimed at recognizing missing bolts in the railway con-
text using a data set made of 3D images directly ac-
quired from a diagnostic train is presented. Data are
represented as depth maps handled as grayscale im-
ages for processing. It is worth pointing out that the
particular use case related to a safety-critical system
emphasizes the detection of possibly all defects, even
if this is at the expense of a few good cases that are
wrongly classified as defects.
The task is formulated as an unsupervised learn-
ing problem as it relies on training different auto-
encoders and testing their discriminating power on
the classification performance of anomalous vs. safe
images using the latent feature space of such auto-
encoders. The rest of the paper is structured as fol-
lows: section 2 recaps the materials and methods,
with particular attention to the dataset, the compari-
son metrics, and the models used; section 3 describes
the experiments and results and section 4 concludes
the paper.
Figure 1: Fasteners are used to fix tie plates, and hence the
rail itself, to sleepers.
2 MATERIALS AND METHODS
2.1 Dataset Description
The analysis was performed on a dataset acquired di-
rectly from a testing railway route in Apulia, Italy.
The testing train (MERMEC Group, ) was equipped
with a depth camera located on the bottom part of the
carriage, directly acquiring data concerning the two
sides of the railway. From that, a depth image was
gathered and then processed to extract 634 patches
representing the structural elements of interest, that
is, the elements located at the intersection between
the railroad tie and the railway.
Thus, the dataset was made of 634 patches repre-
senting structural elements at the side of the sleeper,
with each patch containing either a bolt (safe image)
or not (unsafe image). A few examples are shown in
Figure 2.
The patches were extracted from the original im-
ages using template-matching algorithms. Specifi-
cally, the extraction process started from the consid-
eration that the railroad tie introduced a discontinuity
in terms of depth between the substrate (mainly com-
posed of gravel) and the tie itself. As such, the first
derivative of the signal associated with the depth of a
line parallel to the railway was considered to extract
the points of interest.
After the extraction, each patch was manually la-
beled. The labeling process showed the strong data
unbalancing of the dataset. Specifically, 580 images
were labeled as safe, while only 54 as unsafe. More-
over, exclusively when framing the problem as a bi-
nary classification task described in Section 2.3.1, the
dataset was divided into training and validation data,
following a standard strategy of 70/30 split.
Figure 2: Some examples of images where bolts are present
on the tie plate in the first row and other images in the sec-
ond row with bolts missing. Please note that these images
are created from 3D data using the depth information of
each pixel as its color.
Enhancing Railway Safety: An Unsupervised Approach for Detecting Missing Bolts with Deep Learning and 3D Imaging
925

2.2 Results Evaluation
The algorithms have been compared in terms of accu-
racy, precision, and recall. These metrics are based
on the classification of examples in four groups:
• True Positives (TP), that is, the number of unsafe
samples which are correctly identified.
• True Negatives (TN), that is, the number of safe
samples which are correctly identified.
• False Positives (FP), that is, the number of safe
samples which are misclassified as unsafe.
• False Negatives (FN), that is, the number of un-
safe samples which are misclassified as safe.
It is worth pointing out that the positive class
refers to unsafe samples because the problem focuses
on anomaly detection. Leveraging this clustering, the
metrics for precision and recall are defined respec-
tively as:
P =
T P
T P +FP
(1)
R =
T P
T P +FN
(2)
The accuracy is instead defined as:
A =
T P +TN
T P + FP + T N + FN
(3)
In the specific case, the main focus was on the re-
call, as it was found that minimizing the number of
FN (that is, the situations where the anomaly is not
detected) is critical for the specific purpose of the ap-
plication.
2.3 Experimental Settings
2.3.1 Framing the Problem as a Binary
Classification Task
The initial hypothesis was to exploit supervised learn-
ing models based on Convolutional Neural Networks
(CNN). The problem can be framed as a binary clas-
sification, given the presence of two different classes,
that is, safe and unsafe images. However, it is im-
portant to underline that, as the dataset is strongly
imbalanced, the direct application of a binary classi-
fier could not provide the most effective results based
on the abovementioned metrics. As such, more ad-
vanced techniques, designed mainly to consider both
the scarcity and the imbalance of data, were consid-
ered.
First, the use of self-supervised learning, specif-
ically SimCLR (Chen et al., 2020), was considered.
The approach consists of three different steps. In the
first step, data are augmented via standard data aug-
mentation techniques, specifically random crop and
color manipulation techniques. In the second step, the
classification problem is reframed considering posi-
tive pairs and negative pairs. On the one hand, posi-
tive pairs are pairs of images in the form (I
o
,I
a
) where
I
o
is the original version of the image I, while I
a
is
one of the results provided by the augmentation step.
Conversely, negative pairs are in the form (I
o
,J
a
),
where J
a
is one of the results provided by the aug-
mentation step for another original image J
o
. In other
words, positive pairs are composed of the original im-
age I and an augmented version of I, while negative
pairs are composed of I and the augmented version of
another image J. This type of reframing aims to cre-
ate a new classification problem where the final goal
is to discern whether a pair is positive or negative;
in doing so, a CNN is trained as a feature extractor
and can be used on the original dataset to extract the
embeddings from the original images. The third and
latest step is using the embeddings extracted from the
previous step as the input for a classifier.
2.3.2 Framing the Problem as an Anomaly
Detection Task
The latest step was framing the problem as an
anomaly detection problem. To this end, an autoen-
coder was selected. An autoencoder is an architecture
able to extract a compact, nonlinear representation of
the original data in a latent space, from which the au-
toencoder reconstructs the original image. Based on
the assumption that the autoencoder minimizes the re-
construction error between the input image and its re-
constructed version, the training loss function can be
expressed in the following form:
L(x) = f ( ˆx − x) (4)
Where ˆx is the reconstructed output, x is the original
input, and f (·) is a function representing the error,
such as the mean squared error (MSE).
The rationale behind using an autoencoder is that
it will likely provide a low reconstruction error when
the provided image is generated by the same data gen-
eration mechanism it has been trained on. Conse-
quently, the reconstruction error of safe images will
be significantly lower than that the one of unsafe im-
ages.
3 EXPERIMENTAL RESULTS
The experiments were performed using the Scikit-
Learn framework (Pedregosa et al., 2011) on a ma-
chine equipped with an Intel Core i9-13900HK, 32
ICPRAM 2024 - 13th International Conference on Pattern Recognition Applications and Methods
926

GB of RAM, and an NVIDIA 4090 RTX. The follow-
ing subsections describe the results achieved by the
various framing of the problem.
3.1 Results of the Binary Classification
When framed as a binary classification problem, three
methods were selected for comparison: transfer learn-
ing an existing network trained on a general-purpose
dataset (i.e., ImageNet), training a small neural net-
work from scratch, and using a bare pre-trained net-
work as a feature extractor. Among these approaches,
only the latest one provided meaningful results. More
specifically, the features extracted from the images by
a ResNet50V2 network (He et al., 2016) were then
provided to three different classifiers: a Support Vec-
tor Machine (SVM); a random forest (RF); a multi-
layer perceptron (MLP). The results achieved in terms
of P, R and A are summarized in Table 1.
Table 1: Results achieved framing the problem as a binary
classification using a ResNet50V2 as feature extractor and
three different algorithms for the embedding classification.
Classifier
P R A
SVM 0.45 0.50 0.48
RF 0.50 0.50 0.55
MLP 0.76 0.60 0.64
As Table 1 clearly shows, the achieved results are
not satisfactory for either of the proposed embedding
classifiers, even if the MLP scores slightly better than
the others.
The next step was to evaluate the results, which
were achievable using self-supervised learning via
SimCLR. Specifically, the same ResNet50V2 net-
work was used to train the feature extractor and gather
the embeddings for a k-nearest neighbors classifier.
Table 2: Results achieved framing the problem as a self-
supervised learning problem. ResNet50V2 is the backbone
for data extraction, while the k-nearest neighbors algorithm
is used to classify the data as safe or unsafe.
Class P R Support
Unsafe 0.62 0.33 15
Safe 0.93 0.98 144
Accuracy 0.70 159
As Table 2 shows, using self-supervised learning
improves the results achievable by the model. How-
ever, it must be underlined that the model provides
very different results for the two classes. This is
mainly due to the support value (the number of sam-
ples per class used during validation), which is highly
unbalanced towards the safe images.
Furthermore, the most valuable metrics in the spe-
cific use case scenario concern the unsafe images. As
pointed out beforehand, this context-specific assump-
tion is related to the fact that railway applications
need to be considered as safety-critical ones; in other
words, the model cannot afford to miss unsafe sam-
ples. As such, even if these values can be encouraging
from a barely numeric point of view, it is essential to
look for more robust and application-safe approaches
from a real-world perspective.
3.2 Results of the Anomaly Detection
The last case is represented by formulating the prob-
lem as an anomaly detection. In this case, an au-
toencoder was trained on all the 580 safe images to
develop a model that properly characterizes the data
generation mechanism underneath the depth images
that show a bolt on a sleeper.
Details about the architecture and the training of
the autoencoder used in this work are reported as fol-
lows:
• as for the encoder, it was composed of four subse-
quent convolutional layers with ReLU activations;
• the latent space was made of 128 neurons;
• as for the decoder, it was structured as the encoder
mirrored architecture;
• Adam optimization algorithm was used during the
training.
The loss used for training the autoencoder was the
MSE, defined as follows.
MSE =
p
ˆx
2
− x
2
(5)
Once the training was finished, the auto-encoder was
used to evaluate the reconstruction error on each one
of the images on which it had been trained. This al-
lowed to compute the statistics for the reconstruction
error over the whole dataset, which were then used to
define a context-based classification threshold above
which it could be safely assumed that the provided
image was generated from a different data generation
mechanism due to a high reconstruction error. The
formula for computing the threshold value was:
φ
D
= µ
D
+ σ
D
(6)
Where µ
D
is the average reconstruction error com-
puted over the dataset D, and σ
D
is its standard devi-
ation. On our dataset, µ
D
= 0.0041 and σ
D
= 0.0086,
therefore the selected threshold was φ = 0.0127.
Interestingly, since the reconstruction value on
safe images is near zero, the reconstructed images are
closely related to the original ones. Furthermore, the
low standard deviation suggests that the MSE values
Enhancing Railway Safety: An Unsupervised Approach for Detecting Missing Bolts with Deep Learning and 3D Imaging
927

are relatively consistent across the dataset D, indicat-
ing the stable performance of the autoencoder model.
When the analysis was extended to the whole
dataset, accounting for the 54 unsafe images, the re-
sults shown in Figure 3 were achieved.
Table 3: Precision, recall, and accuracy values when fram-
ing the problem as anomaly detection.
Metric Value
Accuracy 0.84
Precision 0.82
Recall 1
The confusion matrix highlights how the autoen-
coder is able to identify all the 54 unsafe samples cor-
rectly. However, as expected, 103 of the original 580
safe samples are incorrectly marked as unsafe due to
the statistical formulation of the threshold φ
D
. Con-
sequently, considering the unsafe class as the positive
class, the values for the metrics are summarized in
Table 3.
Figure 3: Results achieved using the trained autoencoder
to classify data over the whole dataset. From the confu-
sion matrix, the autoencoder is able to correctly identify 477
safe samples out of the original 580, therefore achieving a
precision of about 82%. As for the unsafe samples, all of
these are correctly identified, therefore achieving a recall of
100%. As such, the overall accuracy achieved by the model
is almost 84%.
However, the most important aspect is that, in this
case, the detector achieves high reliability in detect-
ing unsafe zones. In other words, using this approach
in a real application guarantees that a surveyor could
identify all the unsafe zones, even if a non-neglectable
number of false negatives are given as output, making
it acceptable in the specific safety-critical context.
4 CONCLUSION AND FUTURE
WORKS
This paper compared different deep-learning-based
state of the art approaches for detecting unsafe zones
within railways on real data. In particular, the first ap-
proach frames the problem as a binary classification
one, while the other frames it as an anomaly detec-
tion task. The experiments were performed on a new
dataset specifically designed to capture the presence
or absence of bolts on 3D depth images, even if it
is highly imbalanced due to the fact that it contains
real data directly sampled from the railway. Even if
the experimental results have shown that the first ap-
proaches are not able to guarantee satisfactory results
given the imbalanced nature of the dataset, it has been
proven that a simple yet effective strategy could be
represented by studying the problem as an anomaly
detection task and exploiting the capability of the au-
toencoders of building a compact non-linear data rep-
resentation.
Future directions of this work will be initially fo-
cused on expanding the experiments by acquiring a
more extensive dataset trying to capture other notable
examples of unsafe situations, even if the generally
good conditions of the rails and the specific context
suggest that the dataset will still be highly imbal-
anced. Then, more complex approaches and archi-
tectures will be investigated, for example, using the
autoencoder as a feature extractor. Other experiments
will be aimed at solving the problem related to the
requirement of a preliminary detection step: in that
regard, given the availability of an adequate dataset,
object detection algorithms, such as SSD and YOLO,
will be considered.
Finally, the selected method should be integrated
within a complete framework to assist a surveyor dur-
ing maintenance tasks, possibly improving the overall
user experience via highly interactive tools, such as
augmented and virtual reality devices.
ACKNOWLEDGEMENTS
This study was carried out within the MOST –
Sustainable Mobility National Research Center and
received funding from the European Union Next-
GenerationEU (PIANO NAZIONALE DI RIPRESA
E RESILIENZA (PNRR) – MISSIONE 4 COM-
PONENTE 2, INVESTIMENTO 1.4 – D.D. 1033
17/06/2022, CN00000023). This manuscript reflects
only the authors’ views and opinions, neither the Eu-
ropean Union nor the European Commission can be
considered responsible for them.
ICPRAM 2024 - 13th International Conference on Pattern Recognition Applications and Methods
928

The work is also framed within the research
project VRAIL, Prog. n. F/190009/02/X44 – CUP:
B81B19001410008 - COR: 1666959. Prot. nr: 73739
del 10/03/2020 – AOO IAI – AOO Incentivi Fondo
per la Crescita Sostenibile - Sportello “Fabbrica intel-
ligente” PON I&C 2014-2020 FESR, di cui al D.M. 5
marzo 2018. The authors would like to thank Michele
Attolico and Paola Romano, who were involved in the
projects, for technical support.
REFERENCES
Cardellicchio, A., Nitti, M., Patruno, C., Mosca, N.,
di Summa, M., Stella, E., and Ren
`
o, V. (2023). Auto-
matic quality control of aluminium parts welds based
on 3D data and artificial intelligence. Journal of Intel-
ligent Manufacturing.
Chen, T., Kornblith, S., Norouzi, M., and Hinton, G. (2020).
A Simple Framework for Contrastive Learning of Vi-
sual Representations. In Proceedings of the 37th In-
ternational Conference on Machine Learning, pages
1597–1607. PMLR. ISSN: 2640-3498.
Di Summa, M., Griseta, M. E., Mosca, N., Patruno, C.,
Nitti, M., Ren
`
o, V., and Stella, E. (2023). A Review
on Deep Learning Techniques for Railway Infrastruc-
ture Monitoring. IEEE Access, 11:114638–114661.
Conference Name: IEEE Access.
He, K., Zhang, X., Ren, S., and Sun, J. (2016). Deep Resid-
ual Learning for Image Recognition. pages 770–778.
Jiang, Y., Wang, W., and Zhao, C. (2019). A Machine
Vision-based Realtime Anomaly Detection Method
for Industrial Products Using Deep Learning. In 2019
Chinese Automation Congress (CAC), pages 4842–
4847. ISSN: 2688-0938.
Liso, A., Cardellicchio, A., Patruno, C., Nitti, M., Stella,
E., and Ren
`
o, V. (2023). AWANDT: assessing weld-
ing anomalies via non-destructive tests. In Multimodal
Sensing and Artificial Intelligence: Technologies and
Applications III, volume 12621, pages 66–74. SPIE.
MERMEC Group. Recording cars: Roger 400. https://ww
w.mermecgroup.com/measuring-trains-br-and-sys
tems/recording-cars/105/roger-400.php. Accessed:
2023-12-12.
Pang, G., Shen, C., Cao, L., and Hengel, A. V. D. (2021).
Deep Learning for Anomaly Detection: A Review.
ACM Computing Surveys, 54(2):38:1–38:38.
Pedregosa, F., Varoquaux, G., Gramfort, A., Michel, V.,
Thirion, B., Grisel, O., Blondel, M., Prettenhofer,
P., Weiss, R., Dubourg, V., Vanderplas, J., Passos,
A., Cournapeau, D., Brucher, M., Perrot, M., and
Duchesnay, E. (2011). Scikit-learn: Machine learning
in Python. Journal of Machine Learning Research,
12:2825–2830.
Wan, Z., Zhang, Y., and He, H. (2017). Variational autoen-
coder based synthetic data generation for imbalanced
learning. In 2017 IEEE Symposium Series on Compu-
tational Intelligence (SSCI), pages 1–7.
Enhancing Railway Safety: An Unsupervised Approach for Detecting Missing Bolts with Deep Learning and 3D Imaging
929
