
XPCA Gen: Extended PCA Based Tabular Data Generation Model
Sreekala Kallidil Padinjarekkara
1
, Jessica Alecci
2
and Mirela Popa
1
1
Maastricht University, Maastricht, 6229 EN, Netherlands
2
Irdeto B.V., Netherlands
mirela.popa@maastrichtuniversity.nl
Keywords:
Tabular Data Generation, XPCA Decomposition, ML Utility, Privacy Preservation.
Abstract:
The proposed method XPCA Gen, introduces a novel approach for synthetic tabular data generation by util-
ising relevant patterns present in the data. This is performed using principle components obtained through
XPCA (probabilistic interpretation of standard PCA) decomposition of original data. Since new data points
are obtained by synthesizing the principle components, the generated data is an accurate and noise redundant
representation of original data with a good diversity of data points. The experimental results obtained on
benchmark datasets (e.g. CMC, PID) demonstrate performance in ML utility metrics (accuracy, precision,
recall), showing its ability to capture inherent patterns in the dataset. Along with ML utility metrics, high
Hausdorff distance indicates diversity in generated data without compromising statistical properties. More-
over, this is not a data hungry method like other complex neural networks. Overall, XPCA Gen emerges as a
promising solution for data privacy preservation and robust model training with diverse samples.
1 INTRODUCTION
Synthetic data generation is a fundamental process in
machine learning and statistical data analysis, that in-
volves the generation of artificial datasets which re-
tains the intricate patterns, relationships, and com-
plexities observed in real-world data. This versa-
tile technique helps augmenting existing datasets or
generate entirely new ones based on various research
needs.
Data scarcity is a common issue faced in most
of the real world applications, where data collection
is expensive or restricted due to privacy and ethical
concerns. In such scenarios, synthetic data genera-
tion becomes vital in addressing this data scarcity is-
sue. By generating diverse data out of the existing
real world data, the training models achieve great ro-
bustness and flexibility by learning and adapting to a
wide range of patterns and variations present within
the data. This also helps to effectively avoid over fit-
ting issues as the model will have sufficient amount of
instances to learn during the training process. Due to
all these reasons, synthetic data generation is a valu-
able and important process in enhancing the gener-
alization capabilities of machine learning algorithms,
resulting in more reliable and accurate predictions
when applied to real-world scenarios. There are sev-
eral real world applications of synthetic data gener-
ation like healthcare industry (Jordon et al., 2021),
finance (Assefa et al., 2020), recommendation sys-
tems (Liu et al., 2022), etc. For example, the data
collected in the financial domain can include personal
transaction records and credit details, which contains
sensitive information about individuals and organisa-
tions. Due to the strict data privacy concerns of these
companies, there is a limited availability of public
datasets in this field. Likewise in case of the medical
field, where the availability of data is limited due to
privacy issues, Wasserstein GAN and statistical Gaus-
sian Multivariate model are used to generate medi-
cal data in the research work by (Yale et al., 2019).
There are several existing methods to perform tabular
data generation in several of these applications. For
example, Generative Adversarial Networks (GANs)
(Goodfellow et al., 2020) and variants such as CT-
GAN (Moon et al., 2020), TGAN (Xu and Veera-
machaneni, 2018), etc and other techniques like Au-
toencoders (Bank et al., 2020) and Variational Au-
toEncoders (Kingma and Welling, 2013) have been
shown to be useful in synthetic tabular data gener-
ation. One common limitation of all these models
is that the data is generated by using all patterns
and information present in the dataset, while some of
them are redundant or noisy. Redundant information
can introduce noise into the data generation process,
which can result in overfitting, where the generated
Padinjarekkara, S., Alecci, J. and Popa, M.
XPCA Gen: Extended PCA Based Tabular Data Generation Model.
DOI: 10.5220/0012568600003654
Paper published under CC license (CC BY-NC-ND 4.0)
In Proceedings of the 13th International Conference on Pattern Recognition Applications and Methods (ICPRAM 2024), pages 141-151
ISBN: 978-989-758-684-2; ISSN: 2184-4313
Proceedings Copyright © 2024 by SCITEPRESS – Science and Technology Publications, Lda.
141

data closely fits the training data but fails to generalize
well to new data. This phenomenon is documented in
the work by (Hastie et al., 2009). Not every model has
the inherent capability to select the relevant patterns
such as correlation between features, variations in the
data, etc. that represent the real data. Furthermore,
there are applications that focus on datasets without
noise or outliers (e.g. data quality testing, bench
marking, business intelligence, etc). Therefore, there
is a need for a data generation model that can gener-
ate the most important patterns and characteristics of
real data with reduced noise or outliers. To develop
such a model, Principle Component Analysis based
data generation was looked into. The recent variant
of PCA, called Extended PCA (Anderson-Bergman
et al., 2018) (XPCA), which is a probabilistic inter-
pretation of PCA, is suitable for all variable types,
including continuous, semi-continuous, discrete, etc
and their mixtures. Most of the real world datasets are
a mix of continuous and discrete variables. Therefore,
Principle Components obtained by XPCA decompo-
sition is used to generate synthetic tabular data. Since
data is generated using first few PCs that capture 90-
95% variance, the generated data is considered as an
accurate representation of real data. Our proposed
method for tabular data generation is called XPCA
Gen. The results of this technique are compared
against the existing benchmark models, by evaluating
utility and similarity metrics obtained on benchmark
datasets. The main contributions of this method con-
sist of reducing redundant induced noise, improving
generalization in Machine Learning tasks and enhanc-
ing the diversity of generated data without comprising
statistical properties, all performed in an efficient and
reliable manner.
2 RELATED WORKS
Data generation techniques can be broadly catego-
rized into deep learning and statistical approaches,
where both have their own advantages and limitations.
2.1 Deep Learning Models
Generative Adversarial Network (GAN) is the com-
monly used machine learning algorithm that utilises
the adversarial training process, as proposed by Ian
J. Goodfellow et al. (Goodfellow et al., 2020) in
2014. Since GANs overcome the limitations of pre-
viously existing generative models (like Restricted
Boltzmann Machines), the model has been widely
used for image generation, time series data generation
in (Brophy et al., 2019; Donahue et al., 2018; Fedus
et al., 2018; Esteban et al., 2017), etc. In (Fan et al.,
2020), a detailed experiment was conducted to ex-
plore the use of GAN for synthesizing relational data.
According to this study, GAN is capable of generating
synthetic data that exhibits high utility in tasks such as
classification, clustering, and approximate query pro-
cessing. As development progressed, the variants of
GAN like Conditional GANs (CGAN) have been uti-
lized for data augmentation in training medical ma-
chine learning classifiers, as evidenced by the stud-
ies conducted by Frid-Adar et al. in 2018 (Frid-Adar
et al., 2018) and Wu et al. in 2018 (Wu et al., 2018).
Tabular GAN is a technique specifically designed
for generating tabular data, proposed by Lei Xu and
Kalyan Veeramachaneni (Xu and Veeramachaneni,
2018). In the research work (Zhao et al., 2021),
Fed-TGAN was proposed to overcome specific chal-
lenges faced while handling the tabular data. The re-
sults showed that Fed-TGAN could generate synthetic
tabular data that preserves high resemblance to the
real data with a relatively faster convergence speeds.
In (Wen et al., 2021), a novel version of TGAN
called Causal-TGAN was proposed, which utilises the
causal relationships among variables to generate syn-
thetic tabular data. The research findings highlight
that Causal-TGAN outperforms existing models by
producing highly realistic synthetic data, particularly
when accurate causal relationships are present in the
dataset. To overcome some challenges like mode col-
lapse and stability related issues of GANs, Wasser-
stein GAN with Gradient Penalty (WGANGP) (Adler
and Lunz, 2018; Bhanot et al., 2021; Hernadez et al.,
2023) was used, that works efficiently on numerical,
binary and categorical datasets. The potential limita-
tion that can occur here would be high computational
cost.
The other widely used tabular or image data
generation and augmentation technique is AutoEn-
coder (Bank et al., 2020) and its extensions. In the
research work (Makhzani et al., 2015), Adversarial
AutoEncoder (AAE) was proposed, which takes ad-
vantage of the concept of GANs to achieve variational
inference. The goal of this technique is to match
the distribution of the latent code vector of the Au-
toEncoder with a specific prior distribution. This en-
sures that generating samples from any part of the
prior space produces meaningful and coherent out-
puts. Variational AutoEncoder (VAE) is an exten-
sion of vanilla AutoEncoder, proposed by Diederik
Kingma and Max Welling in (Kingma and Welling,
2013). In (Li et al., 2019), VAE was used as a gener-
ative model that can be given to the user to generate
their own version of synthetic data, closely mimick-
ing original data. In (Islam et al., 2021), VAE was
ICPRAM 2024 - 13th International Conference on Pattern Recognition Applications and Methods
142

used to generate crash and uncrash events from en-
coded latent space. Here, VAE produced excellent
results compared to other data augmentation models.
VAEs were also used in multiple fields like generat-
ing synthetic data for semi-supervised text classifica-
tion tasks (Xu et al., 2017), unbalanced image gener-
ation (Wan et al., 2017), etc.
2.2 Statistical Methods
Apart from complex machine learning models, sev-
eral statistical models also performed well in gen-
erating good quality synthetic data. The concept of
Copulas were introduced by Sklar (Sklar, 1973), stat-
ing that any complex data distribution (like a Gaus-
sian distribution) can be formed by combining sim-
ple marginal distributions using a mathematical func-
tion known as a copula. Several types of Copu-
las were used for the data generation process. One
such model is the vine copula model (Brechmann and
Schepsmeier, 2013), as explained in a study by Brech-
mann et al. The vine copula model chooses the ap-
propriate copula for synthesizing based on the rela-
tionships amongst the variables in the data and esti-
mates its parameters accordingly. Another statistical
model is Gaussian Mixture Model (GMM) that com-
putes the probability distribution function as the com-
bination of multiple weighted Gaussian components,
which represent different modes in the data distribu-
tion (Reynolds et al., 2009). In (Davari et al., 2018),
GMM was used to generate more data points to mit-
igate the lack of training data. Moreover, GMM is
one of the fastest existing technique that can generate
tabular data.
When considering PCA for data generation pro-
cess, there have been only a few research works (Ku-
rita, 2019). PCA offers certain advantages that make
it a strong solution in comparison to existing data
generation methods. This technique captures the un-
derlying structure and patterns in high-dimensional
data by identifying the principal components that con-
tribute the most to its variance, making it particu-
larly effective for generating synthetic data that pre-
serves the key characteristics of the original dataset.
In 2021, Meyer et. al has published a paper on Syn-
thia (Meyer and Nagler, 2021), an open-source multi-
dimensional synthetic data generator code in Python
for xarray’s labelled arrays and datasets with support
for parametric and vine copulas models and func-
tional principal component analysis (fPCA). In (Sano,
2020), Sano et.al proposed two methods for generat-
ing synthetic data using Principal Component Analy-
sis where one utilises orthogonal transformation (lin-
ear method) and the other one is a sandglass-type
neural network (nonlinear method). More than us-
ing PCA as a data generator, in many research works,
PCA was used as a metric to evaluate the real and
generated data. Apart from PCA and its applications,
there have been some recent reports on SVD based
applications, one such example is reported by Pubali
et.al in (De et al., 2020).
3 ALGORITHM
A technique that is quite often used to extract the
most important information in a dataset is PCA. This
method is widely used for dimensionality reduction,
predictive analysis, latent structure analysis (Jolliffe,
2002), etc. The Principle Components that were
obtained from real data after decomposition retain
the maximum patterns and relationships seen in the
dataset. But, the main draw back of standard PCA
lies in its inability to handle data mixtures, while most
of the real world datasets are a mixture of continuous
and discrete variables. Hence, a new variant of PCA
called XPCA (Anderson-Bergman et al., 2018), as
proposed by Anderson et. al., was considered for data
decomposition. This technique extends the capabili-
ties of standard PCA and COCA (Han and Liu, 2012)
(Categorical-Ordinal Component Analysis) to effec-
tively handle discrete variables and mixture of con-
tinuous and discrete variables. XPCA applies trans-
formations to the individual marginal distributions,
ensuring that their combination results in a Gaussian
distribution. Therefore the technique works irrespec-
tive of any distribution or data types.The PCs obtained
from XPCA form a space from which new data points
can be sampled. Since XPCA is used to create the
PC space, which is then used for data generation, this
novel technique is named as ’XPCA Gen’.
3.1 Mathematical Representation
XPCA assumes a Gaussian copula model where re-
lationships between variables are described using a
multivariate Gaussian distribution, described by the
below equation:
Z ∼ N (θ, σ
2
I) (1)
In Equation 1, Z is a random variable that follows
the multivariate normal distribution and θ represents
the mean (or expectation) of the distribution. The Z
values are mapped to observable data y
i j
and subse-
quently to the original data space x
i j
through inverse
conditional distribution functions (CDFs), which is a
key aspect of XPCA.
x
i j
= F
−1
j
(y
i j
) (2)
XPCA Gen: Extended PCA Based Tabular Data Generation Model
143

In Equation 2, x
i j
denotes the observed value for vari-
able j at data point i. It is obtained by applying the
inverse of the cumulative distribution function to y
i j
which is associated to a latent variable. This process
plays a crucial role in XPCA’s ability to model and
analyze both continuous and discrete variables in a
unified framework. The use of inverse CDFs is es-
sential in dealing with the non-continuous nature of
some variables, allowing XPCA to model and analyze
mixed data types effectively. The transformed data
is then decomposed into different factorisation ma-
trices. The statistical method Maximum Likelihood
Estimation (MLE) is used to estimate these matrices
U, V and σ. The optimisation is non-convex over
all parameters but becomes convex when considering
U, given V and σ and V, given U and σ (Anderson-
Bergman et al., 2018). The principle components ob-
tained from factorisation are then normalised using a
StandardScaler, asccording to the following formula:
x
scaled
=
x − mean(x)
std(x)
(3)
3.2 XPCA Technique
The working of the XPCA algorithm is elaborated be-
low as is explained in the research work (Anderson-
Bergman et al., 2018).
1. Input. The XPCA algorithm takes data matrix
X as an input which is of dimensions m × n. It
also requires information about the known entries
in each column such that this information can be
used to handle missing data effectively during the
factorization and optimization steps.
2. Marginal Distributions. The algorithm goes
through all values in each column in the data
matrix and computes the Empirical Distribution
Function (EDF) for each column. This represents
the marginal distribution of data in that column.
3. Epsilon. After estimating the EDFs, the algo-
rithm computes ε, which is a threshold that helps
to define a range of possible standardized val-
ues (z-scores) for the data. To calculate ε, the
algorithm looks at the differences between two
distinct quantiles ((ξ − ξ
0
)) for each column. It
takes half of the minimum difference among all
the columns.
4. Lower and Upper Bound. For each known entry
(i, j) in the data matrix, the algorithm computes
the lower bound and upper bound of a range of
possible standardized values, called the z-range.
The z-range represents the potential variation in
the standardized values (z-scores) of the data, tak-
ing into account the uncertainty caused by miss-
ing entries in the data matrix. The lower bound l
i j
is the lowest possible standardized value that an
instance (i, j) could take, while the upper bound
r
i j
is the highest possible standardized value. By
computing these bounds or limits, the algorithm
aims to capture the spread or variations of the data
points in a standardized form and also proposes a
way to handle missing values.
5. Optimization of U and V. The matrices U and V
are factor matrices that represent the data in a
reduced-dimensional space while preserving the
most important patterns. The values in U matrix
indicate how much each data point contributes to
each latent factor. It captures the relationships be-
tween the data points and the underlying latent
structure. The values in V matrix represent the
contributions of each feature (column) to the la-
tent factors. The XPCA algorithm finds the best
value of U and V by optimization and the singular
value σ that minimizes the loss function.
6. Inverse XPCA. The inverse of this algorithm is
computed from principal components, singular
matrix σ and cumulative distribution functions
(cdfs). This is achieved by creating a grid of z val-
ues within the principal component space, com-
puting mean approximations for these z values via
linear interpolation, and handling missing data.
The resulting reconstructed data provides an ap-
proximation of the original dataset.
3.3 XPCA Gen for Tabular Data
Generation
The proposed algorithm XPCA Gen is a synthetic tab-
ular data generation method that uses XPCA to pro-
duce principle components. The decomposed PCs ob-
tained by applying XPCA on any dataset form a PC
space. From this structure, synthetic PCs can be gen-
erated by sampling along the PC axes, which have
been normalised. These synthetic PCs are then used
to generate synthetic datasets. The block diagram of
this process is shown in the Figure 1 and is explained
below.
Figure 1: Novel Method XPCA Gen for synthetic tabular
data generation.
ICPRAM 2024 - 13th International Conference on Pattern Recognition Applications and Methods
144

1. Preprocess the original data by normalising the
values using a standard scaler. Scaling the data
is important when the variables have different
scales or units. Standardization (also known
as z-score normalization) transforms the original
dataset such that it will have a mean of 0 and a
standard deviation of 1. This process ensures that
all variables contribute equally to the analysis and
prevents features with larger scales from dominat-
ing the results or overfitting.
2. Once the data is preprocessed (e.g standardized),
apply the XPCA algorithm on it and obtain the
PCs. With the help of a scree plot, the explained
variance of each PC is visualised. The number of
PCs that capture 90-95% variance of the real data
can be chosen for the data synthesis process. The
threshold completely depends on the percentage
of information in the data that needs to be synthe-
sized.
3. After obtaining the desired number of PCs, the
selected PCs are normalised (using standardisa-
tion). This process enables the sampling of new
PCs from the normal distribution of zero mean
unit variance.
4. From the normalized XPCA space of selected
PCs, sample random instances along the axis of
each selected PC. These sampled new instances
form the synthetic PCs.
5. Perform inverse normalisation of newly sampled
PCs to bring them back to scale of real PCs.
6. A check on orthogonality of synthesized PCs is
performed. The synthesized PCs are expected to
be orthogonal to each other.
7. Perform inverse XPCA to bring the data back to
original range and inverse standardisation to re-
verse the initial preprocessing done on the data.
Then the detailed evaluation of real and generated
data are studied using statistical and ML utility
metrics.
4 DATA AND EVALUATION
METRICS
4.1 Data Used for Experiments
The real world machine learning benchmark datasets
Credit and Boston housing are used here for various
experiments to study the performance of XPCA Gen.
1. Credit. This is a widely used machine learning
dataset for building and training predictive mod-
els to assess credit risk. The application of this
dataset is commonly in the field of credit risk as-
sessment in order to develop algorithms that help
financial institutions and lenders make informed
decisions about extending credit to borrowers.
The target variable in this dataset is ’Risk’, which
is binary and takes the values ”Good Credit” and
”Bad Credit”. The size of this dataset is 1000 rows
and 10 columns, from which one column is the
target. The dataset is a mixture of continuous and
discrete variables.
2. Boston. Boston Housing is a well-known dataset
used in machine learning and statistics for par-
ticularly regression tasks. The features in this
dataset contain information about various fac-
tors affecting housing prices in different neigh-
borhoods in Boston, Massachusetts, USA. The
size of this dataset is 506 rows and 14 columns.
The target variable in the Boston Housing dataset
is ’MEDV’, which stands for Median Value of
Owner-Occupied Homes. MEDV represents the
median housing price (in thousands of dollars) for
each neighborhood in Boston. Similar to Credit,
this dataset is also a mixture of continuous and
discrete variables.
4.2 Data Used for Ablation Study
To perform an ablation study, CMC, PID and ILP
datasets are considered. Similar experiments per-
formed in the research work (Hernadez et al., 2023)
are repeated using CMC, PID and ILP datasets on
XPCA Gen and performance is evaluated against
other standard tabular data generation models.
1. The Contraceptive Method Choice (CMC) Data.
CMC dataset is a well-known and widely used
benchmark dataset in machine learning research.
It is used for classification tasks, to make predic-
tions about contraceptive method choices based
on various social and demographic factors of mar-
ried women in Indonesia. The size of the data is
1473 rows and 9 attributes. These attributes are of
continuous, categorical and binary types.
2. Pima Indians Diabetes (PID) Dataset. PID is an-
other benchmark data used for machine learning
tasks. It contains data related to the Pima Indian
women of Arizona, USA, and is used for binary
classification tasks. The size of the data is 769
rows and 9 attributes, which are of continuous,
categorical and binary types.
3. Indian Liver Patient (ILP) Dataset. ILP is a bench-
mark dataset in machine learning and data mining,
which is widely used to predict whether a patient
has a liver disease or not. The size of the data is
XPCA Gen: Extended PCA Based Tabular Data Generation Model
145

583 rows and 11 attributes, which are of mixed
types.
4.3 Evaluation Metrics - Experiments
The metrics used to evaluate the generated Credit and
Boston data are given below.
1. Wasserstein Distance (WD). This is also known
as Earth Mover’s Distance (EMD), a metric that
measures the minimum cost required to transform
the distribution of the real data into the distribu-
tion of the generated data. The mathematical for-
mula for this is given by :
W D(P, Q) = inf
c
∑
i
∑
j
c(i, j) · d(i, j) (4)
In Equation 4, P and Q are the distributions of
real and generated dataset; c(i, j) represents the
amount of mass to be transported from point i in
distribution P to point j in distribution Q; d(i, j)
is the distance between points i and j. In simple
words, the lower the distance, the lower the cost
of transformation.
2. Hausdorff Distance (HD). In tabular data genera-
tion context, the Hausdorff distance quantifies the
extent of separation between two subsets within a
metric space. It is defined as the largest among
all the distances from a point in one subset to its
nearest point in the other subset. Therefore, the
higher the HD, the higher the diversity of the gen-
erated data, aspect which can help in training ro-
bust models with varied samples, while preserv-
ing real data privacy (value higher than 1) (Her-
nadez et al., 2023). Mathematically, HD is given
as :
haus dist(S, R) = max
{
h(S, R), h(R, S)
}
(5)
In Equation 5, R and S represent Real and Syn-
thetic datasets respectively.
3. Utility Metrics. Accuracy is a fundamental eval-
uation metric used to assess the performance of
classification of any dataset. It provides a mea-
sure of the overall correctness of the model’s pre-
dictions by considering the ratio of correctly pre-
dicted instances to the total number of instances
in the dataset. By evaluating the accuracy score,
insights can be gained into the model’s ability to
provide correct predictions, which is essential for
assessing its practical utility and trustworthiness.
R2 score is another metrics that gives the measure
of how well the linear regression model fits the
given data. R2 score value ranges from 0 to 1.
Figure 2: Scree plot showing variance captured by each PC
obtained after decomposing Credit data by applying XPCA.
4.4 Evaluation Metrics - Ablation Study
The utility metrics used in the ablation study are ac-
curacy difference, precision difference, recall differ-
ence and F1-score difference. To obtain accuracy dif-
ference, the absolute difference between the accuracy
obtained for classification of synthetic data and real
data is estimated. Similar absolute differences are
taken for precision, recall and F1-score. The sim-
ilarity metrics considered are HD (as given in Sec-
tion 4.3) and Euclidean distance which is the square
root of the sum of square differences between the fea-
tures in the real and synthetic data (Hernadez et al.,
2023). In this case, the Euclidean distance is com-
puted for each pair of records. Then, the mean and
standard deviation of all distances are analysed.
5 RESULT AND EVALUATION
5.1 Data Generation
XPCA Gen is applied on Credit and Boston datasets
to generate synthetic data. After using XPCA to de-
compose the Credit data, first 6 PCs were considered
to generate the new data. Similarly for the Boston
data, first 7 PCs are used. The number of PCs se-
lected for each of these datasets is based on desired
amount of captured variance (85% to 90%). It can be
seen in Figure 2, that choosing first 6 PCs from Credit
data is sufficient to represent the variances in the real
data. Similarly the scree plot for Boston data, shown
in Figure 3, supports the same observation regarding
the number of PCs needed to capture the variance of
the real data.
After obtaining real PCs by XPCA decomposition
on real data, synthetic PCs are sampled from a nor-
mal distribution of zero mean and unit variance. This
is achieved by normalising the selected PCs and by
sampling random PCs from the normalised distribu-
ICPRAM 2024 - 13th International Conference on Pattern Recognition Applications and Methods
146
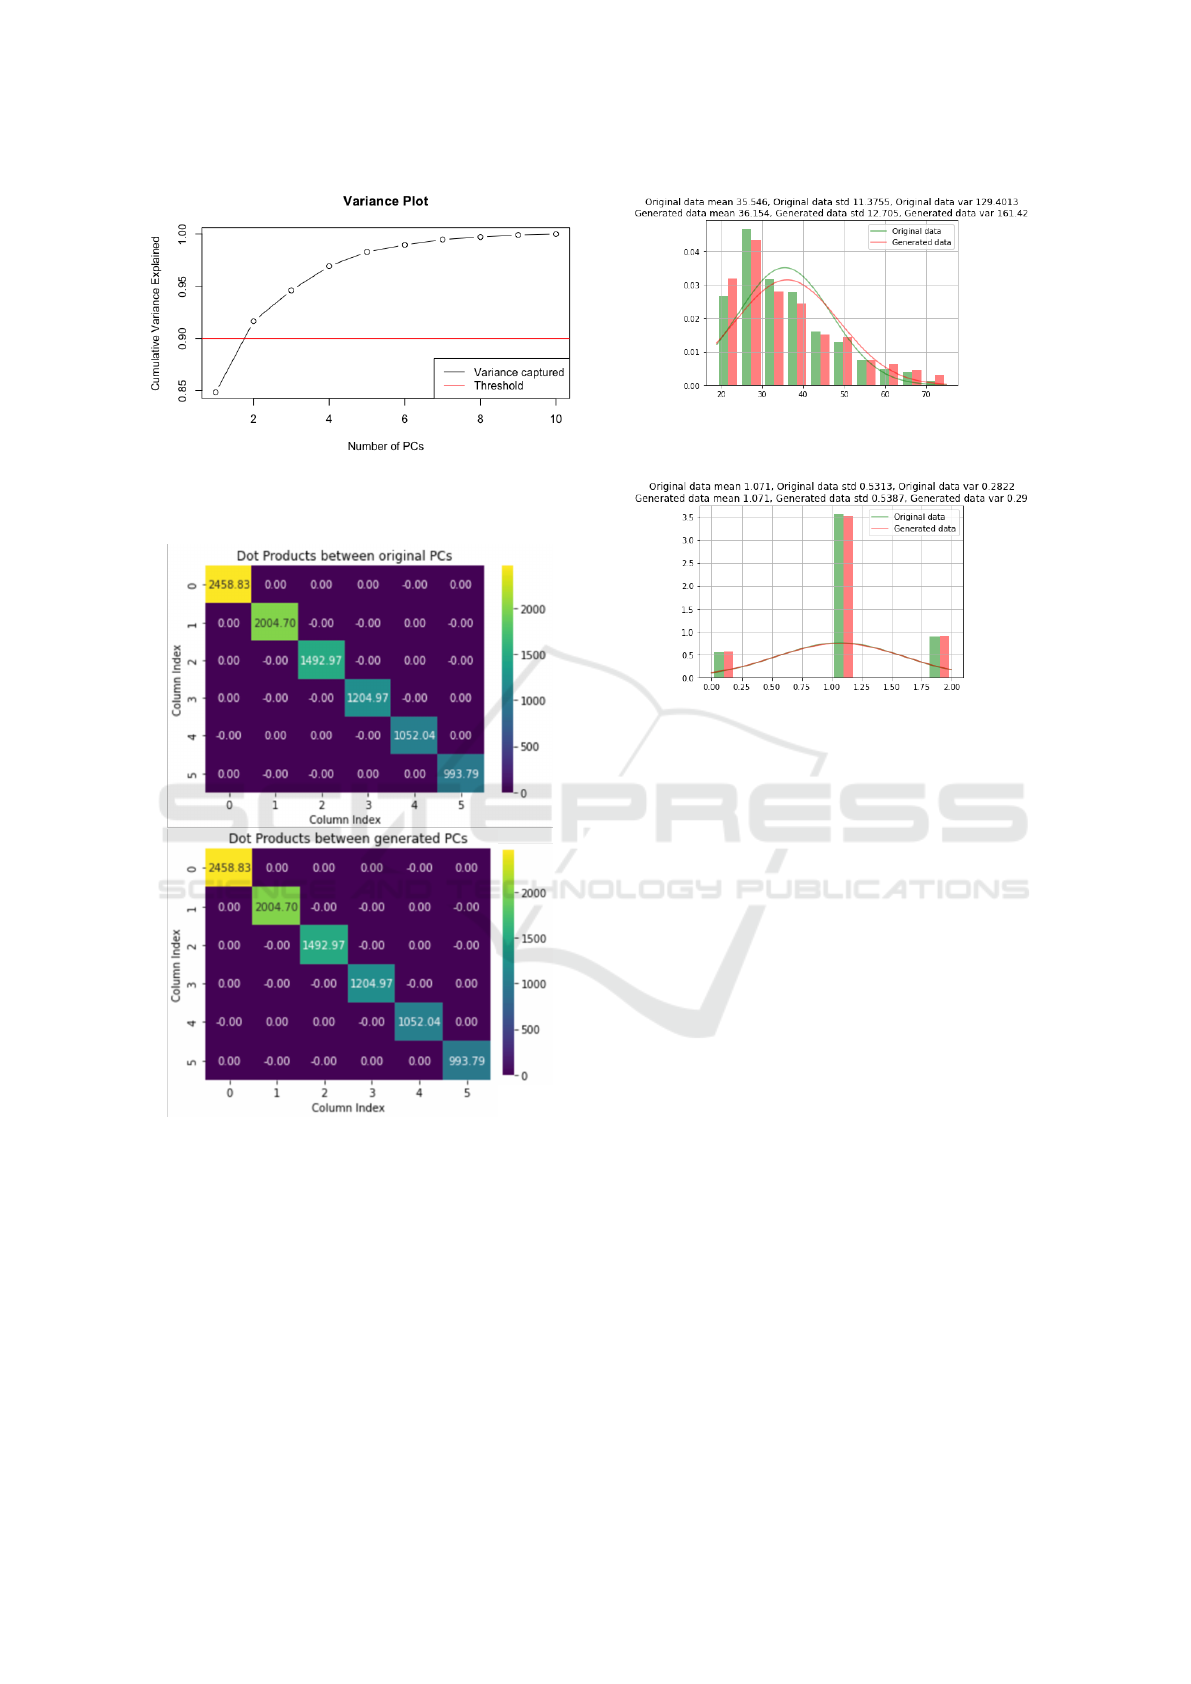
Figure 3: Scree plot showing variance captured by each PC
obtained after decomposing Boston housing data by apply-
ing XPCA.
Figure 4: Check on orthogonality of real PCs and generated
PCs in the latent space.
tion. This also ensures the main properties of Princi-
ple Components, i.e. orthogonality, without perform-
ing any complex transformations.
To check whether the orthogonality of generated
PCs are maintained, the dot products between PCs are
calculated for both both real and generated PCs sepa-
rately and are plotted in Figure 4 as a heat map. Here,
the diagonal values (eigen values) obtained from the
dot products for both real and generated PCs are the
same, indicating that synthetic PCs are indeed captur-
ing the same underlying patterns and relationships as
Figure 5: Comparison of continuous variable ’Age’ of
Credit data with real and generated variables.
Figure 6: Comparison of categorical variable ’Housing’ of
Credit data with real and generated variables.
the real PCs. Furthermore, this also shows that in-
formation is not lost while generating new PCs. This
gives a good indication that generated data is going to
represent in a reliable manner the important informa-
tion in the real data. It can also be observed that just
like original PCs, the dot product between any pair of
generated PCs is 0, which is the proof that orthogonal-
ity is maintained. The same proof is observed when
XPCA Gen is applied on Boston housing data. After
the synthetic PCs are chosen from the normal distribu-
tion, applying inverse XPCA and inverse standardisa-
tion provides the generated data, resembling statistics
of the real data.
It can be noticed in Figures 5 and 6 that the two
variables ’Age’ and ’Housing’ (from the generated
Credit dataset), which are of continuous and categori-
cal types respectively have captured quite well the ba-
sic statistics like mean and spread of the variables in
the real data. Similar preservation of basic statistical
parameters are observed also for the other variables.
5.1.1 Classification Results and Comparison
XPCA Gen is applied on the Credit dataset and eval-
uated against other benchmark data generation mod-
els. The technique worked well on the dataset, by
capturing the relationships and patterns in the original
data. Table 1 shows the tabulated results of the com-
parison of XPCA Gen with GMM, Gaussian Copula,
CTGAN, TGAN and VAE. The main metrics looked
XPCA Gen: Extended PCA Based Tabular Data Generation Model
147
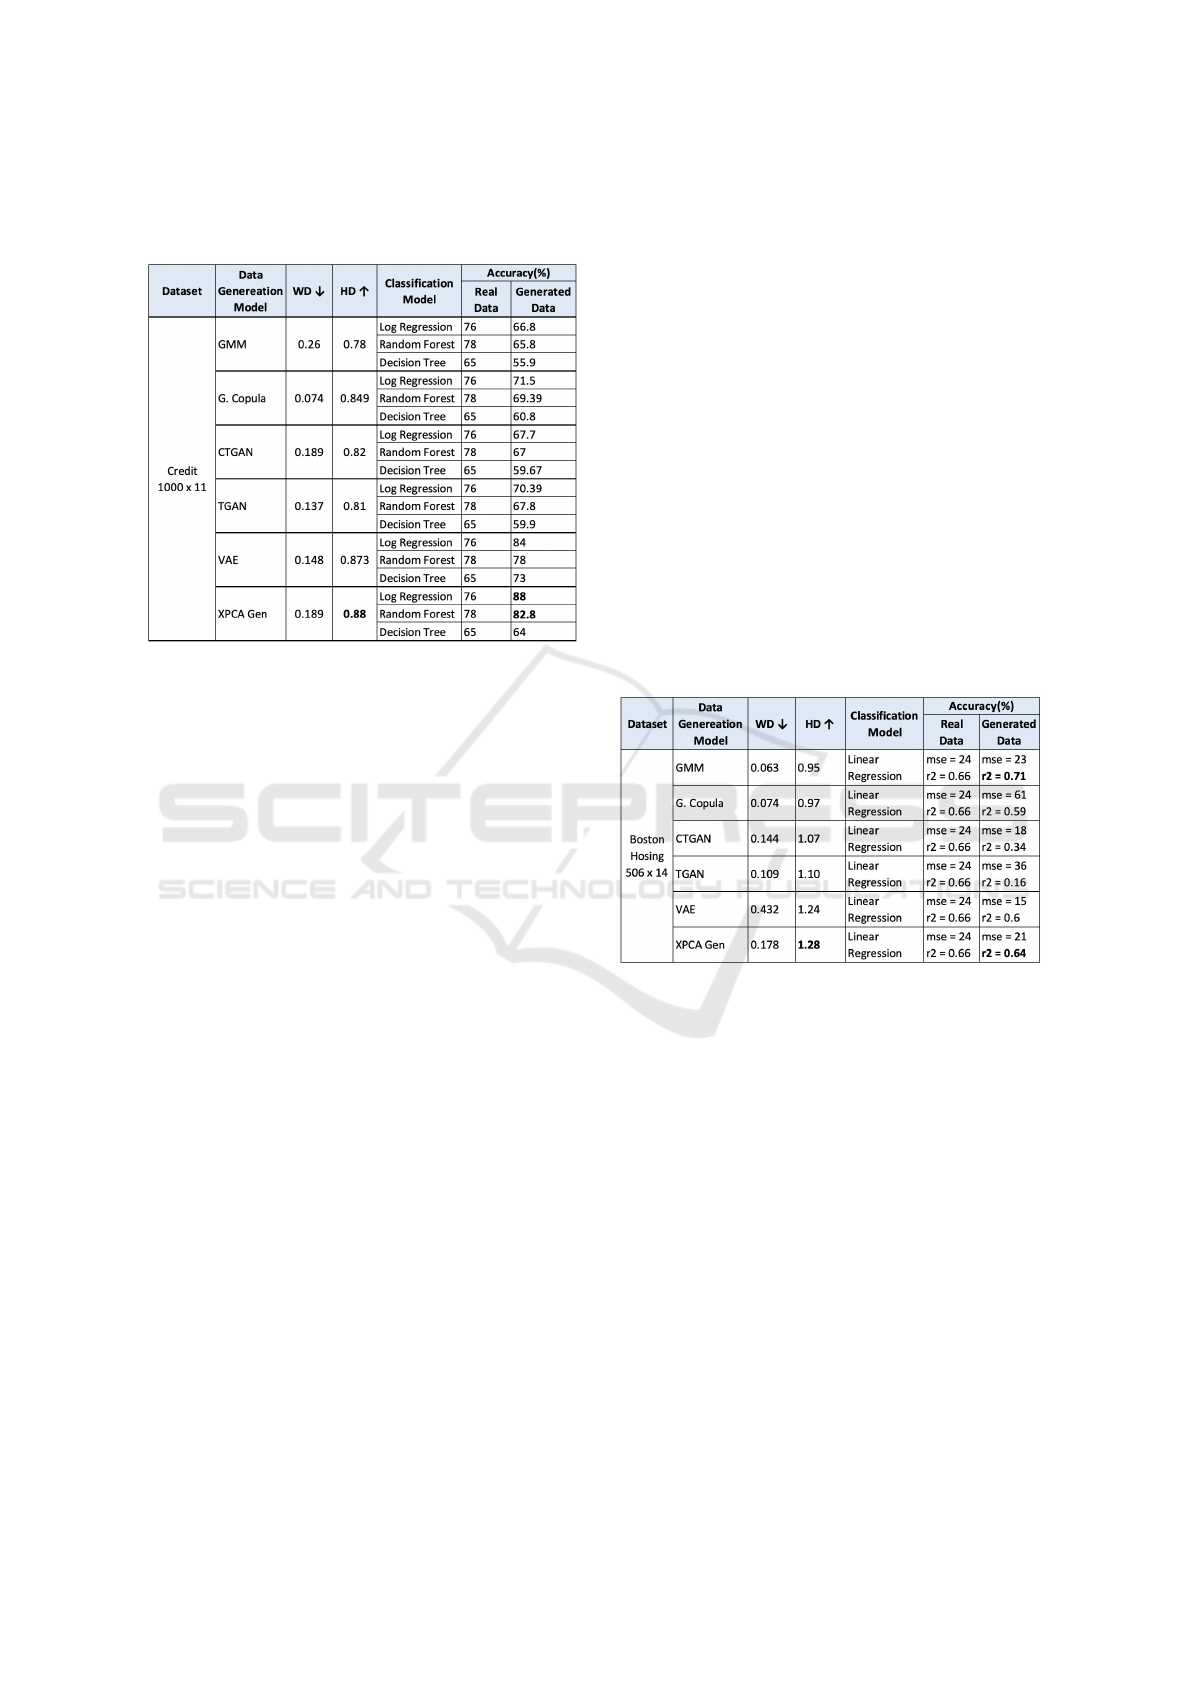
Table 1: Comparison of statistical metrics and classification
accuracy obtained using different models for real and gen-
erated data.
into are Normalised WD (with respect to total), Haus-
dorff distance and classification efficiency. One of the
observation that was made during this evaluation is
that for the generated credit data by XPCA Gen and
VAE, high HD is obtained between real and gener-
ated data. In the context of data generation, achieving
high HD is a good sign, as it indicates that the gen-
erated data contains diverse samples, that preserves
the privacy of real data. The normalised WD val-
ues are also quite reasonable, indicating less amount
of cost of transforming generated data into real data.
Looking at the classification efficiency of generated
labels and predicted labels for synthetic data, the clas-
sifiers performed well on the data generated by the
proposed method XPCA Gen. Logistic regression and
Random Forest could classify the XPCA Gen gen-
erated data with an accuracy of 88% and 82.8% re-
spectively, which is higher when compared to other
models. Decision tree also performed reasonably well
on the generated data by XPCA Gen. These classifi-
cation results indicate that the XPCA Gen generated
data has captured most of the patterns and relation-
ships in the real data. The synthesized data exhib-
ited characteristics that match well with those of the
real data, allowing the models to make good accu-
rate predictions. This is due to the ability of XPCA
Gen of generating data samples without the influence
of noise or redundant information, allowing to focus
on relevant patterns and details in the data. Whereas
other models (CTGAN, GMM, Copula, etc) utilised
all variables and information to produce new sam-
ples, without any inherent way to remove redundant
information or noise. This characteristic of XPCA
Gen is beneficial when dealing with high-dimensional
datasets, as it helps prevent overfitting and captures
the essential underlying structure.
5.1.2 Regression Results and Comparison
This section displays the comparison results of XPCA
Gen and other benchmark techniques when applied on
the Boston housing dataset.
In this experiment, a linear regression model is
used as an evaluation metric or ML utility to assess
the performance of XPCA Gen generated data. By
using regression metrics, such as the R2 score, the
study provides a quantitative analysis of the predictive
capabilities of XPCA-Gen generated data and enables
a comparative analysis with other synthetic data gen-
eration methods. In Table 2, the comparison results
obtained on the generated Boston dataset by different
techniques are tabulated.
Table 2: Comparison of statistical metrics and regression
goodness obtained using different models for real and gen-
erated data.
Since the goal here is to generate synthetic data,
R2 score would be the useful metric to look into as it
gives a relative measure of the model’s performance
and its ability to capture the underlying patterns and
relationships in the data. When comparing different
synthetic data generation methods, a higher R2 score
suggests that the generated data is better aligned with
the real data and exhibits stronger predictive capabil-
ities. Looking into the results in Table 2, the R2 score
is quiet high for GMM and XPCA Gen data. This
shows that the data generated by these two models
has captured most of the complexities and patterns in
the real dataset. This could be due to the fact that
GMM is a probabilistic model, which when well cal-
iberated can capture the underlying data distribution.
In the case of XPCA Gen, it is due to its ability to
generate data from relevant patterns (capturing corre-
lation, clusters, etc.) in the data with reduced noise
influence.
ICPRAM 2024 - 13th International Conference on Pattern Recognition Applications and Methods
148
5.2 Ablation Study
This section shows the results obtained for the ab-
lation study conducted in order to compare the per-
formance of XPCA Gen with other standard tabular
data generation models. To perform this study, the
three datasets CMC, PID and ILP mentioned in Sec-
tion 4.2 are used. The models used to generate the
tabular data are CTGAN, GM (Gaussian Multivariate
or also known as Gaussian Copula), and WGANGP.
The utility evaluation of generated data is performed
using classification models such as Random Forest,
KNN, Decision Tree, SVM and Multi-Layer Percep-
tron. The accuracy, precision, recall and F1-score are
obtained from the aforementioned classification mod-
els. These utility metrics are then averaged for real
and generated datasets, after which the absolute dif-
ference is computed. The results are included in Ta-
ble 3. Specifically, the results of GM, CTGAN and
WGANGP are obtained from the research work of
(Hernadez et al., 2023).
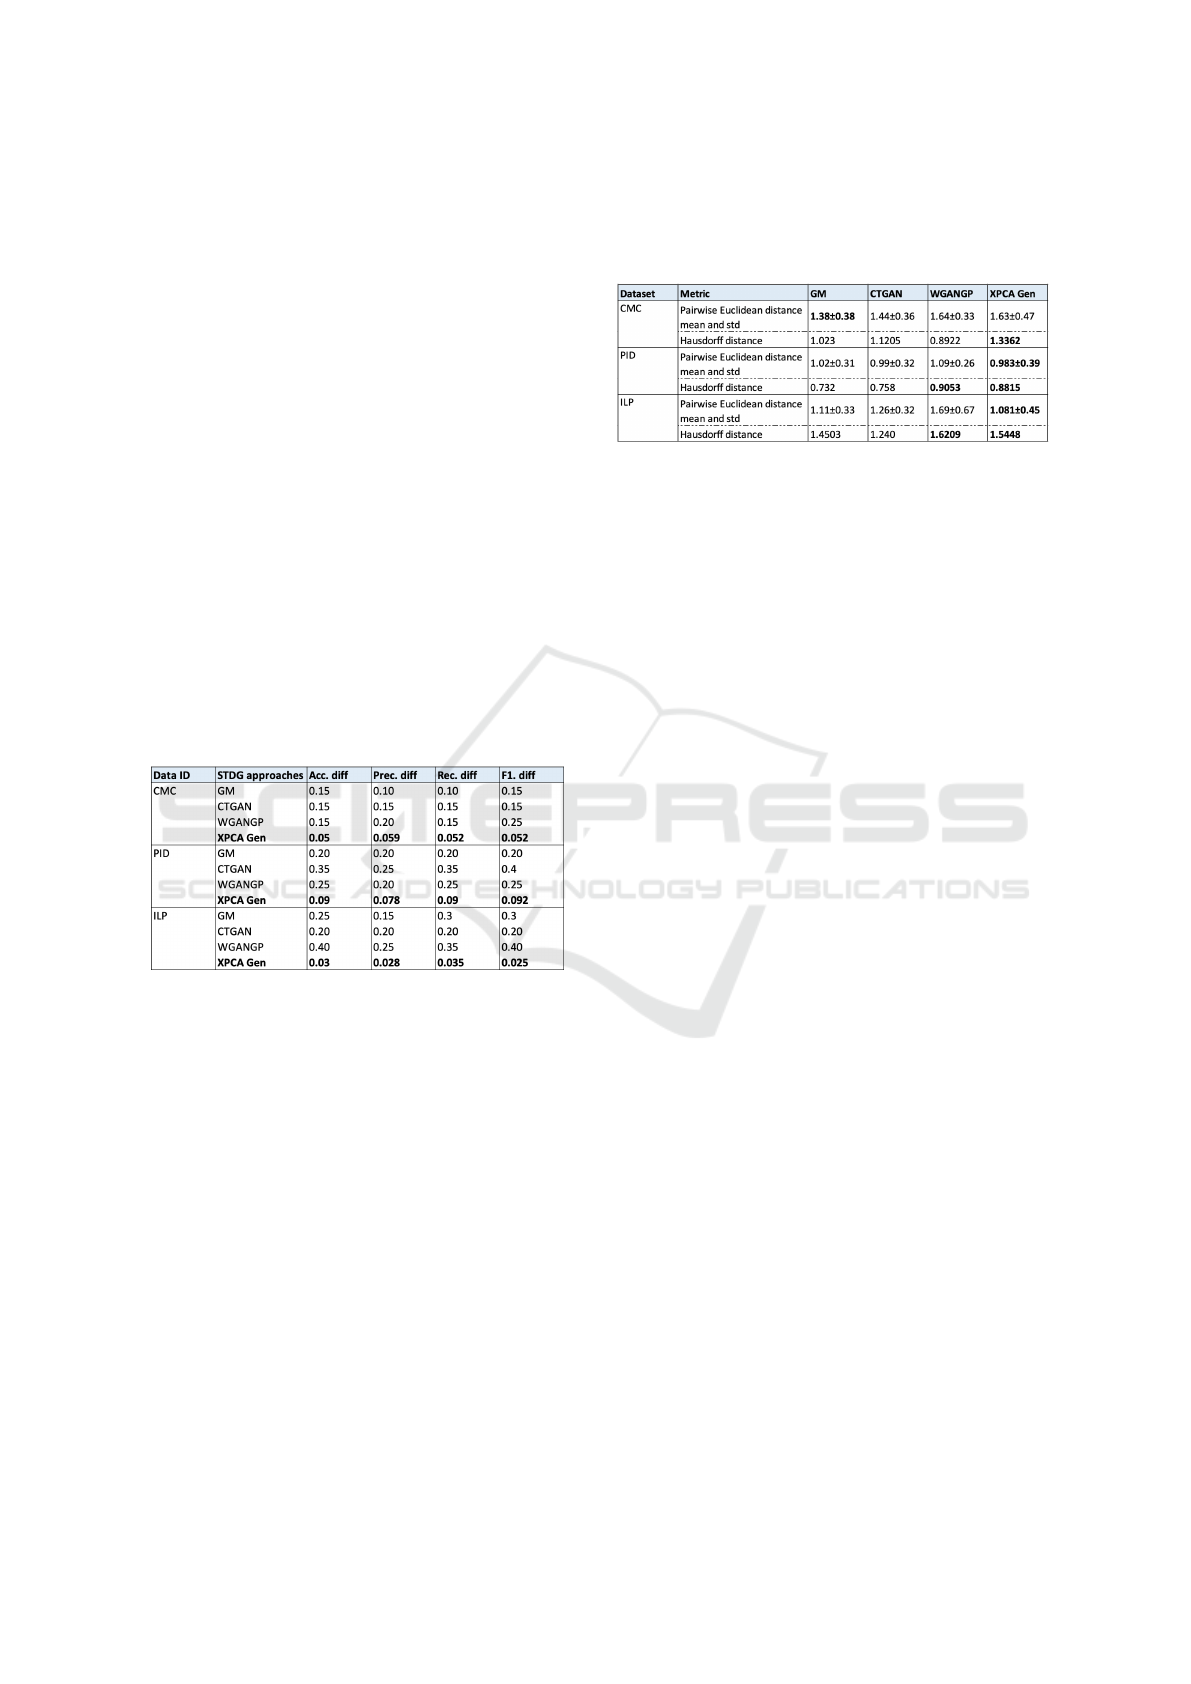
Table 3: Comparison of utility metrics for data generated
with Synthetic Tabular Data Generation (STDG) models
and XPCA Gen.
The observations in Table 3 show that XPCA
Gen outperforms all other models in terms of accu-
racy, precision, recall and F1-score differences. This
proves that the considered evaluation metrics provide
very similar results to the values obtained for real
data. Furthermore, this indicates that XPCA Gen gen-
erated synthetic data is a good representation of the
real data in terms of the underlying patterns, rela-
tionships and other characteristics. For all mentioned
datasets, this model has captured all the relevant pat-
terns during the data generation process, when com-
pared to other models listed in the table.
After analysing the utility metrics performance,
the similarity metrics are evaluated. These results are
presented in Table 4, where the results from other
STDG models are also listed. It was observed that,
for all the three datasets, XPCA Gen has compara-
tively achieved a higher Hausdorff distance, indicat-
ing that the generated samples are very diverse and
different from original samples. This diversity in sam-
Table 4: Comparison of similarity metrics for data gener-
ated with Synthetic Tabular Data Generation (STDG) mod-
els like GM, CTGAN and WGANGP with the proposed
method XPCA Gen.
ples is useful in some applications like data augmen-
tation (where the goal is to introduce variations to the
dataset), privacy preservation of real data and train-
ing robust models, etc. Furthermore, for PID and
ILP datasets, the pairwise Euclidean distance mean is
comparatively lower than for other models. This indi-
cates that synthetic data generated using XPCA Gen
is an accurate representation of the real data.
6 CONCLUSION AND
DISCUSSION
We conducted a set of experiments to compare the
benefits of XPCA Gen with respect to existing tabular
data generation techniques. We utilised the bench-
mark machine learning datasets: Credit, Boston,
CMC, ILP, PID. During the performed experiments
and conducted ablation study, it was observed that
XPCA Gen outperformed the other considered stan-
dard techniques, in terms of utility metrics like classi-
fication accuracy and similarity metrics (e.g. Haus-
dorff distance). The results indicate that the pro-
posed technique effectively captured most of the rel-
evant patterns and complex relationships present in
the real data. Also due to fact that XPCA Gen uses
PCs to generate data, there is a reduced chance of
over-fitting. This observation is supported by the
performed evaluation with ML utility, which has re-
sulted in good classification accuracy of the generated
datasets.
Despite the fact that XPCA Gen generates the
best information from a high dimensional complex
dataset, in an efficient manner, it still exposes a few
limitations in the current state. There can be excess
variance in generated data due to the use of Copula
to model the dependence structure or due to the flex-
ibility in modelling individual variable distributions.
Therefore, suitable regularization techniques can be
used to smoothen the results to reduce the excessive
variance and correlation if needed.
XPCA Gen: Extended PCA Based Tabular Data Generation Model
149

REFERENCES
Adler, J. and Lunz, S. (2018). Banach wasserstein gan. Ad-
vances in neural information processing systems, 31.
Anderson-Bergman, C., Kolda, T. G., and Kincher-Winoto,
K. (2018). Xpca: Extending pca for a combination
of discrete and continuous variables. arXiv preprint
arXiv:1808.07510.
Assefa, S. A., Dervovic, D., Mahfouz, M., Tillman, R. E.,
Reddy, P., and Veloso, M. (2020). Generating syn-
thetic data in finance: opportunities, challenges and
pitfalls. In Proceedings of the First ACM International
Conference on AI in Finance, pages 1–8.
Bank, D., Koenigstein, N., and Giryes, R. (2020). Autoen-
coders. arXiv preprint arXiv:2003.05991.
Bhanot, K., Qi, M., Erickson, J. S., Guyon, I., and Ben-
nett, K. P. (2021). The problem of fairness in synthetic
healthcare data. Entropy, 23(9):1165.
Brechmann, E. C. and Schepsmeier, U. (2013). Modeling
dependence with c-and d-vine copulas: the r package
cdvine. Journal of statistical software, 52:1–27.
Brophy, E., Wang, Z., and Ward, T. E. (2019). Quick and
easy time series generation with established image-
based gans. arXiv preprint arXiv:1902.05624.
Davari, A., Aptoula, E., Yanikoglu, B., Maier, A., and
Riess, C. (2018). Gmm-based synthetic samples for
classification of hyperspectral images with limited
training data. IEEE Geoscience and Remote Sensing
Letters, 15(6):942–946.
De, P., Chatterjee, A., and Rakshit, A. (2020). Regular-
ized k-svd-based dictionary learning approaches for
pir sensor-based detection of human movement direc-
tion. IEEE Sensors Journal, 21(5):6459–6467.
Donahue, C., McAuley, J., and Puckette, M. (2018).
Adversarial audio synthesis. arXiv preprint
arXiv:1802.04208.
Esteban, C., Hyland, S. L., and R
¨
atsch, G. (2017). Real-
valued (medical) time series generation with recurrent
conditional gans. arXiv preprint arXiv:1706.02633.
Fan, J., Liu, T., Li, G., Chen, J., Shen, Y., and Du, X. (2020).
Relational data synthesis using generative adversarial
networks: A design space exploration. arXiv preprint
arXiv:2008.12763.
Fedus, W., Goodfellow, I., and Dai, A. M. (2018). Maskgan:
better text generation via filling in the . arXiv preprint
arXiv:1801.07736.
Frid-Adar, M., Klang, E., Amitai, M., Goldberger, J., and
Greenspan, H. (2018). Synthetic data augmentation
using gan for improved liver lesion classification. In
2018 IEEE 15th international symposium on biomed-
ical imaging (ISBI 2018), pages 289–293. IEEE.
Goodfellow, I., Pouget-Abadie, J., Mirza, M., Xu, B.,
Warde-Farley, D., Ozair, S., Courville, A., and Ben-
gio, Y. (2020). Generative adversarial networks. Com-
munications of the ACM, 63(11):139–144.
Han, F. and Liu, H. (2012). Semiparametric principal com-
ponent analysis. Advances in Neural Information Pro-
cessing Systems, 25.
Hastie, T., Tibshirani, R., Friedman, J. H., and Friedman,
J. H. (2009). The elements of statistical learning: data
mining, inference, and prediction, volume 2. Springer.
Hernadez, M., Epelde, G., Alberdi, A., Cilla, R., and
Rankin, D. (2023). Synthetic tabular data evaluation
in the health domain covering resemblance, utility,
and privacy dimensions. Methods of Information in
Medicine.
Islam, Z., Abdel-Aty, M., Cai, Q., and Yuan, J. (2021).
Crash data augmentation using variational autoen-
coder. Accident Analysis & Prevention, 151:105950.
Jolliffe, I. T. (2002). Principal component analysis for spe-
cial types of data. Springer.
Jordon, J., Jarrett, D., Saveliev, E., Yoon, J., Elbers, P.,
Thoral, P., Ercole, A., Zhang, C., Belgrave, D., and
van der Schaar, M. (2021). Hide-and-seek privacy
challenge: Synthetic data generation vs. patient re-
identification. In NeurIPS 2020 Competition and
Demonstration Track, pages 206–215. PMLR.
Kingma, D. P. and Welling, M. (2013). Auto-encoding vari-
ational bayes. arXiv preprint arXiv:1312.6114.
Kurita, T. (2019). Principal component analysis (pca).
Computer Vision: A Reference Guide, pages 1–4.
Li, S.-C., Tai, B.-C., and Huang, Y. (2019). Evaluating vari-
ational autoencoder as a private data release mecha-
nism for tabular data. In 2019 IEEE 24th Pacific Rim
International Symposium on Dependable Computing
(PRDC), pages 198–1988. IEEE.
Liu, F., Cheng, Z., Chen, H., Wei, Y., Nie, L., and Kankan-
halli, M. (2022). Privacy-preserving synthetic data
generation for recommendation systems. In Proceed-
ings of the 45th International ACM SIGIR Confer-
ence on Research and Development in Information
Retrieval, pages 1379–1389.
Makhzani, A., Shlens, J., Jaitly, N., Goodfellow, I., and
Frey, B. (2015). Adversarial autoencoders. arXiv
preprint arXiv:1511.05644.
Meyer, D. and Nagler, T. (2021). Synthia: Multidimen-
sional synthetic data generation in python. Journal of
Open Source Software, 6(65):2863.
Moon, J., Jung, S., Park, S., and Hwang, E. (2020). Con-
ditional tabular gan-based two-stage data generation
scheme for short-term load forecasting. IEEE Access,
8:205327–205339.
Reynolds, D. A. et al. (2009). Gaussian mixture models.
Encyclopedia of biometrics, 741(659-663).
Sano, N. (2020). Synthetic data by principal component
analysis. In 2020 International Conference on Data
Mining Workshops (ICDMW), pages 101–105. IEEE.
Sklar, A. (1973). Random variables, joint distribution func-
tions, and copulas. Kybernetika, 9(6):449–460.
Wan, Z., Zhang, Y., and He, H. (2017). Variational autoen-
coder based synthetic data generation for imbalanced
learning. In 2017 IEEE symposium series on compu-
tational intelligence (SSCI), pages 1–7. IEEE.
Wen, B., Colon, L. O., Subbalakshmi, K., and Chan-
dramouli, R. (2021). Causal-tgan: Generating tabu-
lar data using causal generative adversarial networks.
arXiv preprint arXiv:2104.10680.
ICPRAM 2024 - 13th International Conference on Pattern Recognition Applications and Methods
150

Wu, E., Wu, K., Cox, D., and Lotter, W. (2018). Condi-
tional infilling gans for data augmentation in mam-
mogram classification. In Image Analysis for Moving
Organ, Breast, and Thoracic Images: Third Interna-
tional Workshop, RAMBO 2018, Fourth International
Workshop, BIA 2018, and First International Work-
shop, TIA 2018, Held in Conjunction with MICCAI
2018, Granada, Spain, September 16 and 20, 2018,
Proceedings 3, pages 98–106. Springer.
Xu, L. and Veeramachaneni, K. (2018). Synthesizing tabu-
lar data using generative adversarial networks. arXiv
preprint arXiv:1811.11264.
Xu, W., Sun, H., Deng, C., and Tan, Y. (2017). Variational
autoencoder for semi-supervised text classification. In
Proceedings of the AAAI Conference on Artificial In-
telligence, volume 31.
Yale, A., Dash, S., Dutta, R., Guyon, I., Pavao, A., and Ben-
nett, K. P. (2019). Privacy preserving synthetic health
data. In ESANN 2019-European Symposium on Ar-
tificial Neural Networks, Computational Intelligence
and Machine Learning.
Zhao, Z., Birke, R., Kunar, A., and Chen, L. Y. (2021). Fed-
tgan: Federated learning framework for synthesizing
tabular data. arXiv preprint arXiv:2108.07927.
XPCA Gen: Extended PCA Based Tabular Data Generation Model
151
