
Comfort Assessment Method of EEG-Based Exoskeleton
Walking-Assistive Device
Heyuan Wang
1a
, Kaitai Li
1b
, Hui Liu
2c
, Xuesong Ye
1
and Congcong Zhou
3d
1
College of Biomedical Engineering & Instrument Science, Biosensor National Special Laboratory, Zhejiang University,
Hangzhou, Zhejiang, 310027, China
2
Cognitive Systems Lab, University of Bremen, 28359 Bremen, Germany
3
Sir Run Run Shaw Hospital, School of Medicine, Zhejiang University, National Engineering Research Center for
Innovation and Application of Minimally Invasive Devices, East Qingchun Road, Hangzhou, Zhejiang, 310016, China
Keywords: Biosignal Processing, Comfort Assessment, EEG, Deep Learning, Exoskeleton Walking-Assistive.
Abstract: The study of wearable exoskeleton robotics has garnered significant attention, amidst a rapidly expanding
corpus of scholarly work aimed at the empirical evaluation of the performance characteristics of robotic
exoskeletons. However, quantifying comfort performance is still a significant and challenging task. This study
aimed to perform comfort assessment based on EEG (Electroencephalography) signals and classical machine
learning models as well as deep learning model. It involved collecting EEG data from users wearing lower
limb exoskeleton walking-assistive devices for comfort assessment during walking experiments. The
subjective evaluation labels of comfort were obtained using a semantic differential scale, providing comfort
labels data for each participant in each trial. This study conducted a comparative analysis of three classical
ML (Machine Learning) models, Naive Bayes, K-Nearest Neighbors, and Support Vector Machine models,
with DL (Deep Learning) model, LSTM (Long Short-Term Memory), in terms of their accuracy for comfort
assessment. The results of the analysis showed that the deep learning model, LSTM, outperformed the
classical machine learning models, in terms of accuracy for evaluating comfort. Specifically, we get an
accuracy of 0.91±0.12 on the LSTM model. The LSTM model demonstrated higher accuracy and better
performance in capturing complex patterns and relationships within the EEG data, leading to the potential of
more accurate predictions of comfort levels.
1 INTRODUCTION
As devices for human-machine symbiosis,
exoskeletons with the strategy of human-in-the-loop,
which incorporates human physiological indicators as
feedback control parameters into the control loop,
have achieved many positive results (Han et al.,
2021a; Song & Collins, 2021; Zhang et al., 2017a). In
the performance evaluation study of lower limb
exoskeleton walking-assistive devices, comfort is
defined as the user's perception of human-robot
interaction (Pinto-Fernandez et al., 2020). Wrong
parameter setting of the assistive device can lead to
discomfort and even pain, which may start fighting
a
https://orcid.org/0000-0002-1817-9198
b
https://orcid.org/0000-0002-0680-9818
c
https://orcid.org/0000-0002-6850-9570
d
https://orcid.org/0000-0001-8397-1491
the device or engage in other compensatory actions
(Felt et al., 2015). In previous studies on the
optimization of exoskeleton walking-assistive
devices, it has been mentioned that quantifying
comfort is a more challenging direction (Koller et al.,
2016). Powered ankle exoskeleton providing too high
peak torque may lead to discomfort during walking,
and uncomfortable exoskeleton plantarflexion
assistance will increase tibialis anterior muscle
activity (Han et al., 2021b). Some assistive patterns
of the exoskeleton are uncomfortable for the wearers,
resulting in unpleasant optimization experiences and
inaccurate outcomes, so some fixed parameters need
to be set to ensure comfort based on pilot tests (Wang
Wang, H., Li, K., Liu, H., Ye, X. and Zhou, C.
Comfort Assessment Method of EEG-Based Exoskeleton Walking-Assistive Device.
DOI: 10.5220/0012564800003657
Paper published under CC license (CC BY-NC-ND 4.0)
In Proceedings of the 17th Inter national Joint Conference on Biomedical Engineering Systems and Technologies (BIOSTEC 2024) - Volume 1, pages 675-682
ISBN: 978-989-758-688-0; ISSN: 2184-4305
Proceedings Copyright © 2024 by SCITEPRESS – Science and Technology Publications, Lda.
675
et al., 2022). The aim of this paper is to objectively
assess the comfort and later introduce it into the
human-in-the-loop optimization of lower limb
exoskeleton control.
The human body receives various external stimuli
and generates conscious judgments of comfort in the
brain. By assessing brain activity based on
electromagnetic or metabolic activity, it is possible to
evaluate the state of brain activity and objectively
reflect the level of comfort. Commonly used methods
for detecting neural activity include EEG, MEG,
ECoG (Lorach et al., 2023), fNIRS, fMRI (Heeger &
Ress, 2002), etc., the first three are to detect the
electromagnetic activity of the brain, and the last two
are to detect the metabolic activity of the brain. EEG
is one of the most commonly used methods for
measuring brain neural activity. It can detect cluster
electrical activity in the cerebral cortex.
Previous research has shown that changes in
metabolic activity caused by blood circulation can
affect brain electrical rhythms. Additionally, exo-
skeleton assistive devices alter lower limb dynamics
during human walking. This impact can be reflected to
some extent in the comfort level by using several
frequency domain features, especially those related to
the 𝛼 frequency band (Jeong & Kim, 2009;Ling & Xia,
2015;Liu & Chen, 2015;Luo et al., 2020;Park & Lee,
2021). Some researchers have used two classical
machine learning models and EEG signals to evaluate
comfort, and have achieved a classification accuracy of
up to 0.75~0.85 in the binary classification task (Ortiz
et al, 2021). Their study also showed that several
electrodes that were selected to be more relevant to
differentiating comfort when walking were electrodes
located in the primary motor cortex and somatosensory
cortex. This may be related to the difference in gait due
to discomfort. In recent years, deep learning networks
have performed very well on many learning models.
Our research group has conducted study on ankle-foot
motion recognition based on sEMG (surface
Electromyography) and acceleration signals using
classic machine learning models and deep learning
networks (Zhou et al, 2021). The results have
demonstrated the effectiveness of deep learning
networks in processing bioelectric signals. Under the
condition of sufficient data, we have the opportunity to
capture the hidden features that are difficult to be
directly calculated by traditional feature engineering.
In response to the above situation, we conducted
a comfort assessment experiment for exoskeleton
walking-assistive devices based on EEG signals and
classical machine learning models as well as deep
learning model. We validated and compared the
performance of different models in comfort
assessment.
2 METHODOLOGY
This study recruited four healthy university student
participants, from which 10800000 raw data frames
were obtained. The inclusion criteria for recruitment
were as follows: all participants should have no limb
injury, no joint disease, no muscle disease, no nervous
system disease and in good physical condition in the
last week. This series of experiments obtained
approval from the ethics committees of both the
university and the hospital. All participants
volunteered to take part in this study and were
provided with full information about the experimental
setup and procedures before the start of the
experiment.
EEG recording was performed using the
BrainProduct actiCHamp Plus 64-channel device
with a sampling frequency of 2500Hz. The EEG
electrode placement followed the international
standard EEG 10-10 system. The electrodes utilized
actiCAP active electrodes with Ag/AgCl sensors,
providing improved recording capabilities with lower
noise levels. Subjects were instructed to minimize eye
blinking during the experiment and focus on
performing lower limb movements on a treadmill.
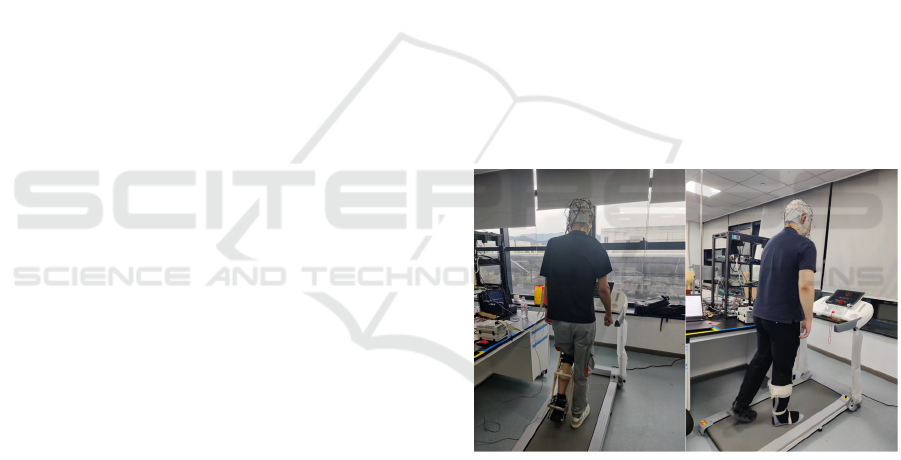
Figure 1: Subjects wearing laboratory-developed powered
ankle exoskeleton and unpowered ankle exoskeleton, AFO.
The experimental procedure consists of three parts. In
the first part, the recording of EEG signals begins
while the participants maintain a resting state by
standing still for 15 seconds. The second part involves
the initiation phase of the treadmill, where the
treadmill gradually accelerates to the desired speed
within 15 seconds. The third part involves continuous
walking, which is the phase where vali data is
recorded and lasts for 2 minutes. Three categories of
semantic difference scales (1~2 uncomfortable, 3~5
neutral, and 6~7 comfortable) are set and let the
subjects self-rate after each trial.
BIOSIGNALS 2024 - 17th International Conference on Bio-inspired Systems and Signal Processing
676
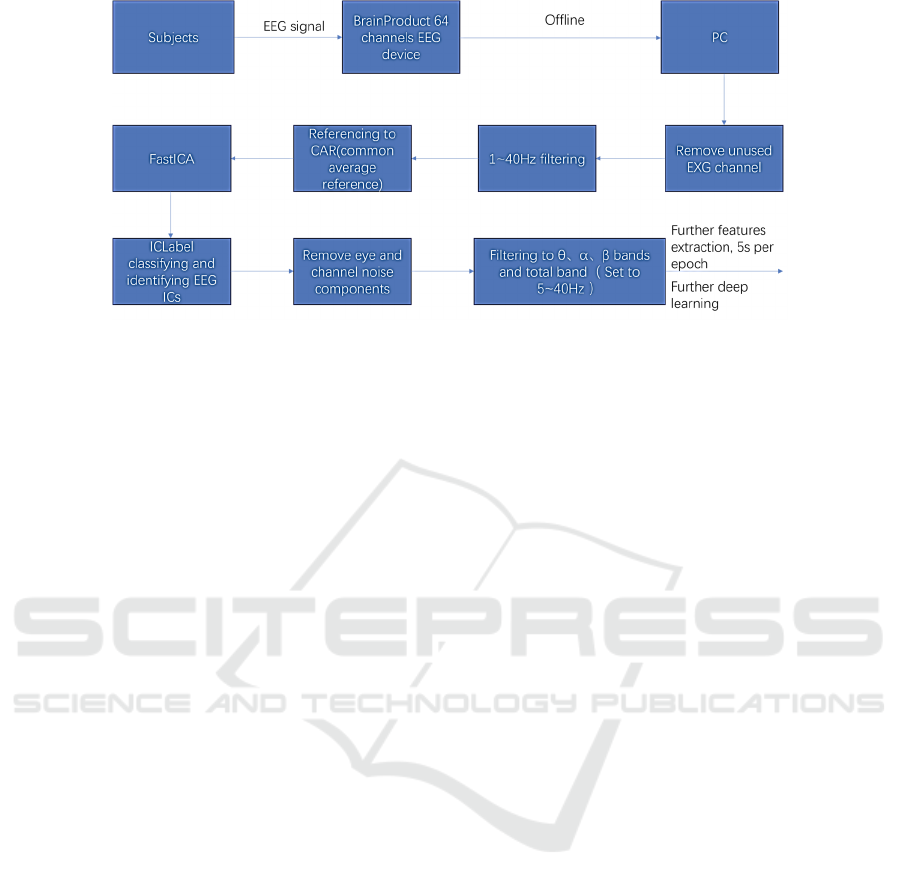
Figure 2: EEG preprocessing pipeline: 1)Remove unused EXG channels; 2)1~40Hz filtering; 3)Re-referencing to CAR;
4)FastICA; 5)ICLabel; 6)Remove eye and channel noise ICs.
In the walking experiment, subjects were asked
to wear three different devices: powered ankle
exoskeletons,unpowered ankle exoskeleton (Zhou
et al, 2022), and self-assessed comfortable shoes. The
experiments were conducted at 1.5 m/s, 2.5 m/s, and
3.5 m/s. The powered ankle exoskeleton used in the
experiment was a laboratory-developed device
designed to provide assistance during continuous
walking. Based on ankle joint biomechanics, the
exoskeleton provided a peak assistive torque during
each gait cycle (Cappellini et al., 2006;Zhang et al.,
2017b), while the unpowered ankle exoskeleton was
the Ober AFO.
The subject's EEG signals are recorded by the
BrainProduct EEG device and transmitted to the PC.
Preprocessing of EEG signals is a series of steps that
perform processing on raw EEG data to extract useful
information and remove noise. First, the unused
channel EXG is removed, which is configured to
collect other electrophysiological signals such as
EMG and ECG. Next, filtering in the frequency band
of interest is to highlight the signal in our frequency
range of interest, specifically 1~40Hz bandpass
filtering. In the next step, re-referencing to the CAR
(Common Average Reference) is a commonly used
modified reference method. This method eliminates
common pattern noise between electrodes by
calculating the average of all electrodes and
subtracting the signal from each electrode. This helps
to make the individual electrodes more independent
of each other for better analysis and interpretation of
the EEG signals.
FastICA (Independent Component Analysis)
can be used to extract ICs (Independent Components)
from EEG data, separating the EEG activity that is
mixed together, allowing us to study and understand
the different EEG components. FastICA excels in
both separation quality and computational speed, two
performance metrics that ICA algorithms focus on.
ICLabel is a machine-learning-based tool trained
using a large number of labeled EEG data for
automatically classifying and labeling independent
components in EEG data. It can identify different
types of components in the EEG signal, such as line
noise, channel noise, ocular electrical activity,
electromyographic activity, etc. Finally, based on the
labeling results, the eye and channel noise
components are removed. EEG is filtered to each
frequency band for frequency domain feature
extraction. Filtered EEG band definition: 𝜃(5~7Hz);
𝛼(8~14Hz); 𝛽(15~30Hz); 𝑡𝑜𝑡𝑎𝑙(5~40Hz).
3 FEATURE EXTRACTION
3.1 Frequency Domain Feature
For periodic signals, their Fourier transform
converges, allowing them to be described using a
frequency spectrum. The frequency spectrum of a
periodic signal is distinct and provides an accurate
representation of the signal's components and energy
distribution across different frequencies. The PSD
(Power Spectral Density) is used to describe the
frequency spectrum of actual signals, which are
mostly random signals with infinite energy that
cannot satisfy the absolute integrability condition
required for Fourier transform convergence.
However, PSD cannot be obtained accurately and can
only be estimated using spectral estimation methods.
The PSD of the EEG in specific frequency bands and
the ratio of the PSDs between different frequency
bands are commonly used features of EEG analysis
Comfort Assessment Method of EEG-Based Exoskeleton Walking-Assistive Device
677

(Jap et al., 2009). The AR (Autoregressive) model is
a commonly used parametric method for power
spectrum estimation. The difference equation and
power spectral density of the AR model are as
follows:
𝑥
(
𝑛
)
=−𝑎
𝑥
(
𝑛−𝑘
)
+𝑤
(
𝑛
)
(1)
𝑃
(
𝜔
)
=
𝜎
1 + 𝑎
𝑒
+⋯+𝑎
𝑒
(2)
Where 𝑤
(
𝑛
)
is a white noise signal with zero
mean and variance of 𝜎
, 𝑝 is the order of the AR
model.
The AR power spectral density estimation method
based on the Burg algorithm was used to extract
feature1 to feature10. The order of the AR model was
set at 18, and the extraction was performed at
intervals of 0.5Hz within the frequency range of 5Hz
to 50Hz. After calculating the PSD for each frequency
band, the following features were obtained:
∑
𝛽/
∑
(𝜃+ 𝛼);
∑
𝛽/
∑
𝛼; max
(
𝛼
)
/
∑
𝑡𝑜𝑡𝑎𝑙; max
(
𝛽
)
/
∑
𝑡𝑜𝑡𝑎𝑙;
∑
𝛼/
∑
𝑡𝑜𝑡𝑎𝑙;
∑
𝛽/
∑
𝑡𝑜𝑡𝑎𝑙; max
(
𝜃+𝛼
)
/
∑
𝑡𝑜𝑡𝑎𝑙 ;
∑
(𝜃+ 𝛼)/
∑
𝑡𝑜𝑡𝑎𝑙 ; max (𝛼) ; max (𝛽) .
The AR power spectral density estimation method
based on the Yule-Walker algorithm, with an AR
model order of 2, was used to extract feature11:
max (𝑡𝑜𝑡𝑎𝑙).
3.2 Time Domain Feature
Standard deviation is a measure of the amount of
variation or dispersion in a set of values. It quantifies
the amount of variation or dispersion of a set of values
from the mean. Standard deviation is calculated for
pre-processed multi-channel EEG data:
𝑠𝑡𝑑=
∑|
𝑥
−𝑥
̅
|
𝑛−1
(3)
Signal energy is the total power contained in a
signal over a period of time. It is calculated by
integrating the squared values of the signal amplitude
over time and is proportional to the duration and
amplitude of the signal. Calculate Energy from pre-
processed multi-channel EEG data:
𝐸= 𝑥
(4)
The Weibull distribution has two parameters: the
shape parameter and the scale parameter. In this study
rectified EEG were used and only the scale parameter
was calculated. The scale parameter determines the
shape and scale of the distribution. When the scale
parameter increases, the distribution becomes more
concentrated with a higher peak value. Conversely, as
the scale parameter decreases, the distribution
becomes flatter with lower peaks.
𝑓
(
𝑥;𝜆,𝑘
)
=
𝑘
𝜆
𝑥
𝜆
𝑒
(
⁄)
𝑥≥0
0𝑥<0
(5)
where 𝜆 is the scale parameter.
The Hjorth parameter is a set of three time-domain
features that describe a single EEG channel. These
features are activity, mobility, and complexity. They
are commonly used in EEG signals for feature
extraction (Chen et al., 2023;Rizal et al, 2022).
Calculate the Hjorth parameter for the preprocessed
multi-channel EEG data:
𝐻𝑗𝑜
𝑟𝑡ℎ (𝑎𝑐𝑡𝑖𝑣𝑖𝑡𝑦)=𝜎
(6)
𝐻𝑗𝑜
𝑟𝑡ℎ (𝑚𝑜𝑏𝑖𝑙𝑖𝑡𝑦)=𝜎
𝜎
⁄
(7)
𝐻𝑗𝑜
𝑟𝑡ℎ
(
𝑐𝑜𝑚𝑝𝑙𝑒𝑥𝑖𝑡𝑦
)
=
𝜎
𝜎
⁄
𝜎
𝜎
⁄
(8)
Where 𝜎
, 𝜎
, and 𝜎
are the stand deviations
of 𝑥(𝑛), 𝑥′(𝑛), and 𝑥′′(𝑛) respectively. 𝑥(𝑛)
represents the preprocessed sequence of the EEG
signal, and 𝑥′(𝑛) and 𝑥′′(𝑛) represent its first- and
second-order differences.
3.3 Nonlinear Feature
Entropy, originating from Shannon's information
theory as: −
∑
𝑝𝑙𝑜𝑔(𝑝), also known as information
entropy, has given rise to many features in EEG
analysis (Aydın et al., 2009). It is a type of nonlinear
feature. Log energy entropy is a commonly used EEG
feature similar to wavelet entropy, it only involves the
summation of probabilities using logarithms. The
formula is as follows:
𝐻
(
𝑥
)
=−
𝑙𝑜𝑔
𝑝
(
𝑥
)
(9)
Where 𝑝
(𝑥) is probability distribution function
of EEG signal 𝑥, 𝑖 indicates one of the discrete states.
The Sample Entropy (SamEn) is an extension of
the Approximate Entropy (ApEn), which is used to
measure the probability of generating a new pattern
in the signal. The formula is as follows:
𝐻
(
𝑛,𝑚,𝑟
)
=−𝑙𝑛
𝐵
(
𝑟
)
𝐵
(
𝑟
)
(10)
Where 𝑚 is the dimension, which can be 1 or 2; 𝑟
is the approximate tolerance, 𝐵
(
𝑟
)
is the ratio of the
approximate quantity to the total quantity.
BIOSIGNALS 2024 - 17th International Conference on Bio-inspired Systems and Signal Processing
678
4 DATASET AND CLASSIFIERS
4.1 Dataset
4.1.1 Dataset Construction
In order to avoid the influence of the magnitude of
different feature vectors on the results, they were
standardized. After feature extraction and
standardization, the data is shown as Table 1, where
the data frames represent the time frames of the
multichannel EEG, the feature frames represent the
calculated features for each epoch, 5s for each epoch:
Table 1: Exoskeleton walking-assistive device comfort
assessment dataset.
Comfort level
N
umber of data frames
Uncomfortable 180(2250000)
N
eutral 540(6750000)
Comfortable 144(1800000)
Feature Frames (Raw Data Frames)
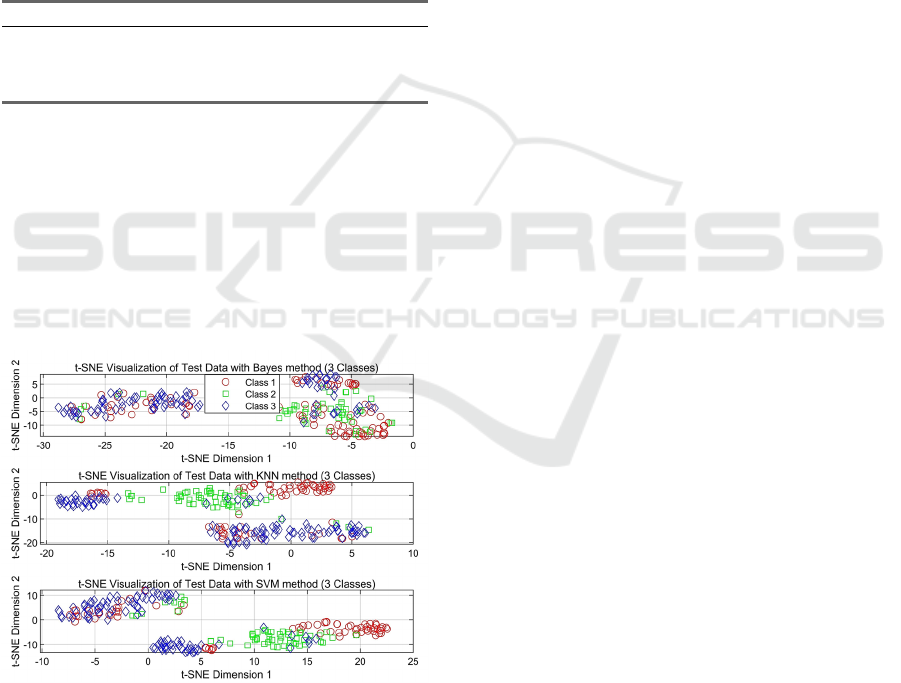
4.1.2 Data Visualization
t-SNE (t-Distributed Stochastic Neighbor
Embedding) is a popular dimensionality reduction
technique used for visualizing high-dimensional data
in a lower-dimensional space. It is particularly
effective in revealing the underlying structure and
patterns within the data (Heggs et al., 2023).
Figure 3: Schematic diagram of t-SNE dimensionality
reduction of the three classifiers, from top to bottom, are
Naive Bayes, KNN and SVM classifiers, in which red
represents ‘uncomfortable’, green represents ‘neutral’, and
blue represents ‘comfortable’.
The algorithm works by constructing a probability
distribution over pairs of high-dimensional data
points, both in the original space and in the lower-
dimensional space. It then tries to minimize the
divergence between these two distributions. In
simpler terms, t-SNE aims to find a lower-
dimensional representation that maintains the
similarities between data points from the original
high-dimensional space, while also ensuring that
dissimilar points are well-separated. By iteratively
optimizing this objective function, t-SNE gradually
maps the data points into the lower-dimensional
space, where they can be visualized and analysed
effectively. In the study of decoding handwritten
characters through an intracortical brain-computer-
interface, 31 handwritten characters can be clearly
distinguished by the two-dimensional visualization of
neural activity drawn by t-SNE (Willett et al., 2021).
As can be seen from the visualization results in
Figure 3, several classifiers have a certain degree of
distinction, and the distinction degree of KNN and
SVM is obviously higher than that of the Naive Bayes
model, the intra-class distance is smaller, and the
inter-class distance is larger.
4.2 Classifiers
4.2.1 Naive Bayes
Naive Bayes model is an elementary yet efficient
algorithm (Wickramasinghe & Kalutarage, 2021) that
assumes independence among features and leverages
prior probabilities for sample class determination. It
is widely used in text classification, sentiment
analysis, and more due to its simplicity and
effectiveness.
4.2.2 SVM
SVM model using ECOC (Error-Correcting Output
Code) can help with multi-class classification
problems (Ubeyli, 2008), encoding categories into
binary codes and building binary SVM classifiers for
each code. The final classification result is
determined by the output encoding of these binary
classifiers.
4.2.3 KNN
KNN is an instance-based model that classifies a new
sample based on its nearest neighbor's category,
calculated using the predefined number of neighbors
K. KNN is simple and performs well on small
datasets, but may face computational and storage
challenges with large datasets (Bablania et al., 2018).
Comfort Assessment Method of EEG-Based Exoskeleton Walking-Assistive Device
679
4.2.4 LSTM
LSTM is a type of RNN (Recurrent Neural Network)
used for processing and predicting time series data. It
has stronger memory capabilities and handles long-
term dependencies better than traditional RNNs.
LSTM uses gates to control information flow,
including forget, input, and output gates. These gates
update cell states, enabling the network to learn long-
term dependencies effectively and avoid gradient
problems during training. In past EEG studies, LSTM
has shown good performance (Du et al., 2022). In this
study, time series data before feature extraction is
used in the LSTM model.
5 RESULTS
5.1 Model Optimization
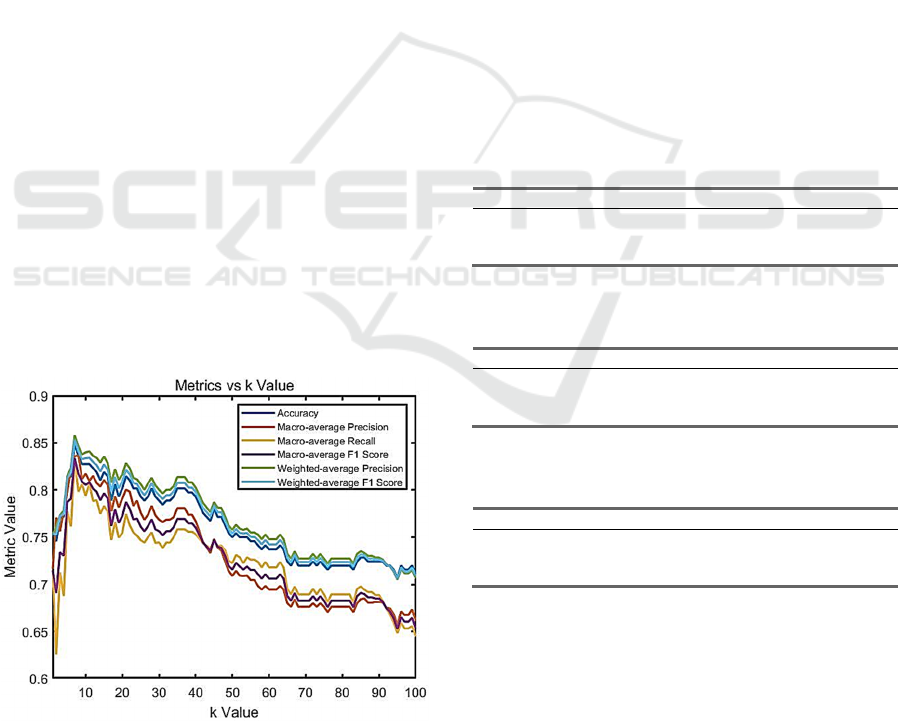
The K value in the KNN model indicates how many
data points of the nearest neighbors are considered
when classifying. Specifically, when a new data point
needs to be classified or predicted, the KNN
algorithm finds the data points in the K training set
that are closest to that data point, and then uses them
to determine the classification or prediction value of
the new data point. The choice of K value has a great
impact on the performance and results of the KNN
model. To balance the number of frames between the
different classes, stratified random sampling is used
to divide the training set (60%) and the test set (40%).
The test results show that the k value of the optimal
KNN classifier ranges from 5 to 15.
Figure 4: The change curves of classification accuracy,
precision, recall and F1 score of the KNN model trained
after a stratified random sampling of the data set with the
increase of k value.
Figure 4 compares the change curves of various
multiclassification evaluation metrics with the
change of K-value, including accuracy, macro-
average precision, macro-average recall, macro-
average F1 score, weighted-average precision, and
weighted-average F1 score, which are all possible
metrics. The optimal k value of 5 of the 6 evaluation
metrics is 7. In this stratified random sampling, the
optimal accuracy of the model is 84.9%. After 20
times of stratified random sampling, grid search was
used to find the optimal classifier at k=5~15, and the
average optimal accuracy was 88.32%±1.2%.
5.2 Comparison of Classical ML
Models
In a stratified random sampling, the performance of
the three models is calculated and compared. The
performance of SVM and KNN model is significantly
higher than that of Naive Bayes model. The
performance of SVM and KNN model is similar, but
in general, SVM model is slightly better than KNN
model. Specific comparisons are shown in Table 2,
Table 3 and Table 4 below.
Table 2: SVM model performance.
Class
\
Metric Accuracy Precision Recall F1 Score
Uncomfor
t
able
0.9267 0.8235 0.718 0.7671
Neutral
0.8879 0.8978 0.9111 0.9044
Comfor
t
able
0.9526 0.8853 0.931 0.9076
SVM model accuracy: 88.36%
Table 3: KNN model performance.
Class
\
Metric Accuracy Precision Recall F1 Score
Uncomfor
t
able
0.9353 0.8 0.8205 0.8101
Neutral
0.8664 0.8662 0.9111 0.8881
Comfor
t
able
0.931 0.92 0.7931 0.8519
KNN model accuracy: 86.64%
Table 4: Naive Bayes model performance.
Class
\
Metric Accuracy Precision Recall F1 Score
Uncomfor
t
able
0.8621 0.6667 0.359 0.4667
Neutral
0.681 0.6784 0.8593 0.7582
Comfor
t
able
0.7759 0.575 0.3966 0.4694
Naive Bayes model accuracy: 65.95%
It can be seen that although SVM model
outperforms KNN model on most evaluation metrics,
several metrics are lower than KNN model. They are
Uncomfortable Accuracy, Comfortable Precision,
Uncomfortable Recall, Uncomfortable F1 Score.
The accuracy of the Naive Bayes model is not too
low for each class. But Comfortable Recall,
Uncomfortable recall, Comfortable F1 Score,
Uncomfortable F1 Score are all very low.
BIOSIGNALS 2024 - 17th International Conference on Bio-inspired Systems and Signal Processing
680

5.3 ML and DL Models Comparison
Table 5 below compares the performance of the deep
learning model LSTM with three classical machine
learning models. It can be seen that the LSTM model
is superior to the machine learning models in terms of
accuracy of up to 0.91±0.12, even if the optimal KNN
classifier is trained many times, the average accuracy
of these multiple optimal KNN classifiers is only
0.88, and the LSTM can obtain an accuracy of up to
0.91 even without model optimization, indicating that
the LSTM can capture the hidden features of the
relationship between human EEG data and comfort
levels.
Table 5: Comparison of the performance of three classical
Machine Learning models and Deep Learning model
LSTM in this task. The Naive Bayes model was not
optimized. The accuracy of KNN is the average of multiple
optimal KNN models, which is the result in 5.1. The SVM
model with ECOC uses a conventional linear kernel, was
also not optimized. Both Bayes and SVM models were
obtained after 20 stratified random sampling.
Results Models
LSTM Ba
y
es K
N
N SVM
Accuracy 0.91±
0.12
0.63±
0.03
0.88±
0.01
0.86±
0.02
(mean±std)
6 CONCLUSIONS
This study is intended to explore the comfort
assessment method for exoskeleton walking-assistive
devices. EEG signals were collected from subjects
during a walking experiment, and frequency-domain,
time-domain, and nonlinear features were extracted.
The t-SNE technique was used for dimensionality
reduction and visualization of categories,
demonstrating separability between different
categories. Subsequently, evaluations based on
several classical machine learning models were
conducted and compared with the performance of the
deep learning model LSTM. The results indicate that
among the classical machine learning models, the
Naive Bayes model performed the worst, with
accuracy far lower than SVM and KNN. Both SVM
and KNN demonstrated good performance, achieving
accuracies above 0.8. The deep learning model LSTM
outperformed several classical machine learning
models in accuracy (0.91±0.12). This indicates that
the deep learning model LSTM exhibits excellent
performance in revealing the potential relationship
between EEG and comfort levels, and can identify
hidden features.
ACKNOWLEDGEMENTS
This work was supported in part by Zhejiang
Provincial Natural Science Foundation of China
under Grant No. LY22H180006 and the National Key
R&D Program of China under Grant No.
2017YFF0210803.
REFERENCES
Aydın, S., Saraoğlu, H. M., & Kara, S. (2009). Log Energy
Entropy-Based EEG Classification with Multilayer
Neural Networks in Seizure. Annals of Biomedical
Engineering, 37, 2626-2630
Bablania, A., Edlaa, D. R., & Dodiaa, S.
(2018Classification of EEG Data using k-Nearest
Neighbor approach for Concealed Information Test.
Paper presented at the 8th International Conference on
Advances in Computing and Communication (ICACC-
2018).
Cappellini, G., Ivanenko, Y. P., Poppele, R. E., &
Lacquaniti, F. (2006). Motor Patterns in Human
Walking and Running. Journal of Neurophysiology,
95(6), 3426-3437
Chen, W., Cai, Y., Li, A., Su, Y., & Jiang, K. (2023). EEG
feature selection method based on maximum
information coefficient and quantum particle swarm.
Scientific Reports, 13.
Du, X., Ma, C., Zhang, G., Li, J., Lai, Y., Zhao, G.,... Wang,
H. (2022). An Efficient LSTM Network for Emotion
Recognition From Multichannel EEG Signals. IEEE
Transactions on Affective Computing, 13(3).
Felt, W., Selinger, J. C., Donelan, J. M., & Remy, C. D.
(2015). "Body-In-The-Loop": Optimizing Device
Parameters Using Measures of Instantaneous Energetic
Cost. PLoS ONE, 10(8)
Han, H., Wang, W., Zhang, F., Li, X., Chen, J., Han, J.,...
Zhang, J. (2021a). Selection of Muscle-Activity-Based
Cost Function in Human-in-the-Loop Optimization of
Multi-Gait Ankle Exoskeleton Assistance. IEEE
Transactions on Neural Systems and Rehabilitation
Engineering, 29, 944-952.
Han, H., Wang, W., Zhang, F., Li, X., Chen, J., Han, J.,...
Zhang, J. (2021b). Selection of Muscle-Activity-Based
Cost Function in Human-in-the-Loop Optimization of
Multi-Gait Ankle Exoskeleton Assistance. IEEE
Transactions on Neural Systems and Rehabilitation
Engineering, 29, 944-952.
Heeger, D. J., & Ress, D. (2002). What does fMRI tell us
about neuronal activity? Nature Reviews Neuroscience,
3, 142-151
Heggs, R. M., Prado, S., Gava, G. P., Go, M. A., & Schultz,
S. R. (2023). Neural manifold analysis of brain circuit
Comfort Assessment Method of EEG-Based Exoskeleton Walking-Assistive Device
681

dynamics in health and disease. Journal of
Computational Neuroscience, 51, 1-21.
Jap, B. T., Lal, S., Fischer, P., & Bekiaris, E. (2009). Using
EEG spectral components to assess algorithms for
detecting fatigue. Expert Systems with Applications, 36,
2352-2359
Jeong, J., & Kim, H. (2009). Assessment of the Wear
Comfort of Outdoorwear by ECG and EEG Analyses.
Journal of the Korean Society of Clothing and Textiles,
33(10), 1665-1672
Koller, J. R., Gates, D., Ferris, D. P., & Remy, C.
(2016'Body-in-the-Loop' Optimization of Assistive
Robotic Devices: A Validation Study. Paper presented
at the Robotics: Science and Systems XII.
Ling, Y., & Xia, L. (2015). Study on Wearing Pressure
Comfort Based on Females' Physiological Index.
Chinese Journal of Ergonomics, 21(6)
Liu, Y., & Chen, D. (2015). An analysis on EEG power
spectrum under pressure of girdle. International
Journal of Clothing Science and Technology, 27(4),
495-505
Lorach, H., Galvez, A., Spagnolo, V., Martel, F., Karakas,
S., Intering, N.,... Courtine, G. (2023). Walking
naturally after spinal cord injury using a brain–spine
interface. Nature, 618, 126-133.
Luo, X., Yun, S., Xue, C., Yue, Z., & Ren, H. (2020). Study
on comfort evaluation methods of different women's
high-heeled shoes based on electroencephalograph
(EEG) technology. Leather and Footwear Journal,
20(1), 5-14.
Ortiz, M., Vicente, P., Ianez, E., Montiel, E., & Azorin, J.
M. (2021). Assessing Footwear Comfort by
Electroencephalography Analysis. IEEE Access, 9,
134259-134269.
Park, S., & Lee, Y. (2021). Verification of Effectiveness of
Wearing Compression Pants in Wearable Robot Based
on Bio-signals. Journal of the Korean Society of
Clothing and Textiles, 45(2), 305-316.
Pinto-Fernandez, D., Torricelli, D., Sanchez-Villamanan,
M. D. C., Aller, F., Mombaur, K., Conti, R.,... Pons, J.
L. (2020). Performance Evaluation of Lower Limb
Exoskeletons: A Systematic Review. IEEE
Transactions on Neural Systems and Rehabilitation
Engineering, 28(7), 1573-1583.
Rizal, A., Hadiyoso, S., & Ramdani, A. Z. (2022). FPGA-
Based Implementation for Real-Time Epileptic EEG
Classification Using Hjorth Descriptor and KNN.
Electronics, 11(19), 3026
Song, S., & Collins, S. H. (2021). Optimizing Exoskeleton
Assistance for Faster Self-Selected Walking. IEEE
Transactions on Neural Systems and Rehabilitation
Engineering, 29, 786-795.
Ubeyli, E. D. (2008). Analysis of EEG signals by
combining eigenvector methods and multiclass support
vector machines. Computers in Biology and Medicine,
38, 14-22
Wang, W., Chen, J., Ding, J., Zhang, J., & Liu, J. (2022).
Improving Walking Economy With an Ankle
Exoskeleton Prior to Human-in-the-Loop
Optimization. Frontiers in Neurorobotics
, 15, 797147
Wickramasinghe, I., & Kalutarage, H. (2021). Naive Bayes:
applications, variations and vulnerabilities: a review of
literature with code snippets for implementation. Soft
Computing, 25, 2277-2293
Willett, F. R., Avansino, D. T., Hochberg, L. R.,
Henderson, J. M., & Shenoy, K. V. (2021). High-
performance brain-to-text communication via hand-
writing. Nature, 593, 249-254
Zhang, J., Fiers, P., Witte, K. A., Jackson, R. W.,
Poggensee, K. L., Atkeson, C. G.,... Collins, S. H.
(2017a). Human-in-the-loop optimization of
exoskeleton assistance during walking. Science,
356(6344), 1280-1284.
Zhang, J., Fiers, P., Witte, K. A., Jackson, R. W.,
Poggensee, K. L., Atkeson, C. G.,... Collins, S. H.
(2017b). Human-in-the-loop optimization of
exoskeleton assistance during walking. SCIENCE,
356(6344), 1280-1284.
Zhou, C., Yang, L., Liao, H., Liang, B., & Ye, X. (2021).
Ankle foot motion recognition based on wireless
wearable sEMG and acceleration sensors for smart
AFO. Sensors and Actuators A: Physical, 331.
Zhou, C., Yang, Z., Li, K., & Ye, X. (2022). Research and
Development of Ankle– Foot Orthoses: A Review.
sensors, 22(17), 6596
BIOSIGNALS 2024 - 17th International Conference on Bio-inspired Systems and Signal Processing
682
