
SynthCheck: A Dashboard for Synthetic Data Quality Assessment
Gabriele Santangelo, Giovanna Nicora, Riccardo Bellazzi and Arianna Dagliati
Department of Electrical, Computer and Biomedical Engineering, University of Pavia, Pavia, Italy
Keywords: Synthetic Data, Quality Evaluation, Privacy, Graphical User Interface.
Abstract: In recent years, synthetic data generation has become a topic of growing interest, especially in healthcare,
where they can support the development of robust Artificial Intelligence (AI) tools. Additionally, synthetic
data offer advantages such as easier sharing and consultation compared to original data, which are subject to
patient privacy laws that have become increasingly rigorous in recent years. To ensure a safe use of synthetic
data, it is necessary to assess their quality. Synthetic data quality evaluation is based on three properties:
resemblance, utility, and privacy, that can be measured using different statistical approaches. Automatic
evaluation of synthetic data quality can foster their safe usage within medical AI systems. For this reason, we
have developed a dashboard application, in which users can perform a comprehensive quality assessment of
their synthetic data. This is achieved through a user-friendly interface, providing easy access and intuitive
functionalities for generating reports.
1 INTRODUCTION
Machine Learning (ML) and Artificial Intelligence
(AI) are increasingly being exploited to solve health-
related problems, such as prognosis prediction from
Electronic Health Records (EHR) or detecting
patterns in multi-omics data. These approaches are
gradually being translated from bench to bedside,
with 171 enabled AI-based medical devices from the
Food and Drug Administration (FDA) as of October
2023 (Joshi et al., 2022).
Data plays a significant role in the development of
such systems, but concerns have been raised when
dealing with patient’s data, with regulators
underlying the need to protect patients’ privacy. To
this end, in recent years, there has been a growing
proposal to replace original data (derived from real
patients) with synthetic data that mimic the main
statistical characteristics of their real counterparts.
One of the most common definition of synthetic data
is the one used by the US Census Bureau (Philpott,
2018), which reads as follows: “Synthetic data are
microdata records created by statistically modeling
original data and then using those models to generate
new data values that reproduce the original data’s
statistical properties”.
Synthetic data are now widely used to train ML
classifiers. For example, (Chen & Chen, 2022)
trained an ML model for lung cancer using synthetic
data only. Synthetic data can also be exploited to test
ML classification performance (Tucker et al., 2020).
(Hernandez et al., 2022) provides a systematic
review of the approaches for synthetic data generation
(SDG) developed in the last few years. SDGs can be
categorized into three main groups: (1) classical
approaches, which includes baseline methods (e.g.
anonymization and noise addition) and statistical and
supervised machine learning approaches; (2) deep
learning approaches, where the generative model is
realized using deep learning; lastly, the (3) third
group includes those approaches that do not fall into
the previous categories (e.g. methods consisting of
generating synthetic data by simulating a series of
procedures).
Regardless of the methods employed to generate
them, it is essential to assess the quality of the
synthetic data. In a recent paper, Hernadez et al. have
described the different metrics currently used to
evaluate tabular synthetic data (Hernadez et al.,
2023). These metrics can be classified into three
categories based on their evaluation objectives. First,
resemblance metrics focuses on assessing the
statistical properties of synthetic data by directly
comparing the statistical distributions of features
between the original and synthetic datasets and
analyzing whether the correlation structure among the
features of the original dataset is preserved in the
synthetic dataset. Utility-related metrics are aimed at
246
Santangelo, G., Nicora, G., Bellazzi, R. and Dagliati, A.
SynthCheck: A Dashboard for Synthetic Data Quality Assessment.
DOI: 10.5220/0012558700003657
Paper published under CC license (CC BY-NC-ND 4.0)
In Proceedings of the 17th International Joint Conference on Biomedical Engineering Systems and Technologies (BIOSTEC 2024) - Volume 2, pages 246-256
ISBN: 978-989-758-688-0; ISSN: 2184-4305
Proceedings Copyright © 2024 by SCITEPRESS – Science and Technology Publications, Lda.

Table 1: List of tools that perform evaluation of synthetic data utility, resemblance and privacy.
Tool Description Metrics GUI Report
Synthetic Data Vault
(Patki et al., 2016)
(SDGym and
SDGMetrics module
)
Python package to
generate and evaluate
synthetic data
resemblance, privacy no yes
SDNist (Task et al.,
2023)
Python package for
evaluation
resemblance, utility,
privacy
no yes
Anonymeter (Giomi
et al., 2023)
Python package to
evaluate privacy
privacy no no
SynthGauge Python package utility, privacy no no
synthpop (Raab et
al., 2021)
R library utility no no
syntheval (SynthEval,
2023/2023)
Python package for
evaluation
resemblance, utility,
privacy
no no
evaluating the usability of statistical conclusions
drawn from synthetic data or the results from ML
models trained with synthetic data. The third relevant
aspect is privacy - a measurement about how private
synthetic data are in terms of the disclosure risk of
private or sensitive information. For example,
simulated cyberattacks by a virtual attacker can be
executed, and their performance subsequently
evaluated.
Different works have benchmarked SDG
methods, also in light of the above mentioned aspects.
In (Goncalves et al., 2020), authors compare eight
SDGs on medical data from the Surveillance
Epidemiology and End Results (SEER) programs in
terms of statistical resemblance between the original
and the synthetic data in terms of privacy, revealing
that no particular methods demonstrated superior
performance. In (Reiner Benaim et al., 2020), a cross
hospital study in the Rambam Health Care Campus,
Israel, authors tested the validity of synthetic data
generated directly from the actual real data across
different clinical research projects. Their results
positively state that synthetic data were a close
estimate to real data from a statistical point of view.
In (Yan et al., 2022), authors benchmarked several
deep learning SDGs on EHR data, investigating the
trade-off between utility and privacy, and finding that
no single SDG outperformed the others. Since
synthetic data can be used to train ML models,
(Rodriguez-Almeida et al., 2023) studied the
relationship between resemblance and the
performance of ML classifiers trained on synthetic
data. In a recent study, (Azizi et al., 2023) showed
how synthetic data can support federated learning.
The aim was to assess country-level differences in the
role of sex on cardiovascular diseases using a dataset
of Austrian and Canadian individuals. The shared
datasets between the two countries were synthesized
using sequence-optimized decision trees and showed
low privacy risk.
Numerous tools have been created for the
generation and assessment of synthetic data. Table 1
presents a list of open-source tools available for
evaluating synthetic datasets concerning resemblance,
privacy, and utility. Only two of these tools measure all
three aspects, and notably, none of them offer a
Graphical User Interface (GUI). The absence of a GUI
might limit the usability of these tools for non-
informatics users, particularly clinicians.
To address this issue, we have implemented a
Dashboard application that users can install and
utilize on their computers. This application allows
both real and synthetic data, and it generates various
metrics to assess resemblance, utility, and privacy.
Furthermore, users can download a report containing
the obtained results.
The following sections provide details on the
implemented metrics and the Dash application
designed for synthetic data evaluation. A case study
on a dataset of Intensive Care Unit (ICU) patients is
then presented.
2 METHODS
2.1 Quality Metrics
This section describes the methods to evaluate the
quality of a synthetic dataset in terms of resemblance,
utility and privacy, that were included in the
application.
SynthCheck: A Dashboard for Synthetic Data Quality Assessment
247

2.1.1 Resemblance Metrics
To assess the resemblance between the original data
and the synthetically generated dataset we considered
three main metrics categories: Univariate
Resemblance Analysis (URA), Multivariate
Relationships Analysis (MRA) and Data Labeling
Analysis (DLA).
URA analysis evaluates synthetic data’s ability to
preserve original data’s univariate statistical
properties. It compares distributions of features
between the original and synthetic datasets using
statistical tests (e.g. Student t-test, Mann-Whitney U-
test, Kolmogorov-Smirnov test for continuous
features and Chi-square test for categorical features).
Preserved statistical properties in synthetic data are
indicated by accepted null hypotheses in tests for
continuous features and rejected hypotheses for
categorical ones. Distance measures like cosine,
Jensen-Shannon, and Wasserstein (only for
continuous features) can also be used to assess
statistical properties preservation – the smaller the
distance, the better the preservation.
The MRA analyses determine if synthetic data
replicates original data’s statistical properties in a
multidimensional context, exploiting different
methods:
Correlation matrices: Pearson correlation
matrix is computed for continuous features and
normalized contingency table for categorical
features, for both the original and synthetic
datasets. It is assumed that if the synthetic data
are generated correctly, then the differences
between the “real matrix” and the “synthetic
matrix” will be small;
Outliers analysis: For each observation present
in the original dataset and in the synthetic
dataset, the Local Outlier Factor (LOF) score is
computed. Next, comparison between scores
assigned to original and synthetic data is
visualized;
Variance explained analysis: Principal
Component Analysis (PCA) is performed to
measure the variance explained by the
variables in both the original and synthetic
datasets;
Data “shape” preservation: A visual analysis is
performed using the Uniform Manifold
Approximation and Projection (UMAP)
method to visualize the “shape” assumed by the
original data and compare it with that assumed
by the synthetic data.
In the DLA analysis, several classifiers (e.g.
Random Forest, K-Nearest Neighbors, Decision Tree,
Support Vector Machines and Multilayer Perceptron)
are trained to recognize whether the proposed record
is original or synthetic and their performances are
evaluated. To evaluate their performance, the
following metrics are computed: accuracy, recall,
precision and F1 score. If the semantics of the original
data are preserved in the synthetic data, then the
various classifiers should not be able to distinguish
whether the proposed record is original or synthetic,
i.e. they should have low performance.
2.1.2 Utility Metrics
To assess utility, we evaluate whether the performan-
ces of ML classifiers trained with real data are
maintained when they are trained with synthetic data.
In the “Train on Real Test on Real” (TRTR)
approach, a classifier is selected and trained to predict
the value of a target class using a portion of the
original dataset as the training set. Subsequently, it is
evaluated using a test set derived from the same
original dataset. The performance metrics of the
trained classifier, including accuracy, recall,
precision and F1 score, are computed.
In the “Train on Synthetic Test on Real” (TSTR)
approach, the training set is derived from the
synthetic dataset, while the test set consists of
elements from the original dataset. Whereby, the
classifier is trained on synthetic data and tested on
real data. At the end of this analysis, the values of the
performance metrics are computed and compared
between the TRTR and TSTR approach.
2.1.3 Privacy Metrics
Privacy preservation is measured with two different
analyses: the first analysis is called Similarity
Evaluation Analysis (SEA), while the second
involves simulating two different cyberattacks, i.e.
Membership Inference Attack (MIA) and Attribute
Inference Attack (AIA).
In SEA analysis, three distance metrics between
the original and the synthetic data are calculated:
Euclidean distance, cosine similarity and Hausdorff
distance. The distances are calculated considering the
rows (each row representing a patient) of the two
datasets. High values in the case of Euclidean and
Hausdorff distances indicate low similarity between
original and synthetic data, whereby minimal privacy
loss, whereas the opposite is true for cosine similarity.
In the simulated MIA, the attacker has access to a
portion of the original dataset (referred to as the
original subset) and attempts to identify the records in
the original subset that are part of the test set used to
generate the synthetic data phase. The attacker
HEALTHINF 2024 - 17th International Conference on Health Informatics
248
calculates distances (e.g., cosine similarity) between
the original subset record and synthetic dataset
records. If any distance exceeds a similarity
threshold, the record is labelled as belonging to the
original training set. After simulating the attack, the
accuracy and precision of the attacker are computed.
The underlying idea is that if the attacker succeeds in
identifying records, the synthetic dataset contains
records that are too similar to those in the original
training set, resulting in a loss of security for the
original data.
In the simulated AIA, the attacker has access to a
portion of the original dataset and the complete
synthetic dataset, but the original subset lacks some
of the features present in the original dataset. The
attacker’s objective is to reconstruct the missing
features from this subset, using a ML classification or
regression model, depending on the type of feature to
be reconstructed. The model is trained using the
features from the synthetic dataset and the target class
is chosen from the missing features that the attacker
wants to reconstruct. Then, the trained model is used
to predict the considered missing feature, utilizing the
features from the original subset. Finally, the attacker
performance is evaluated by calculating accuracy, if
the reconstructed feature is categorical, or Root Mean
Squared Error (RMSE), in the case of continuous
features. If the synthetic dataset prevents accurate
reconstruction, it suggests preservation of the original
dataset’s privacy.
2.2 Dashboard Architecture
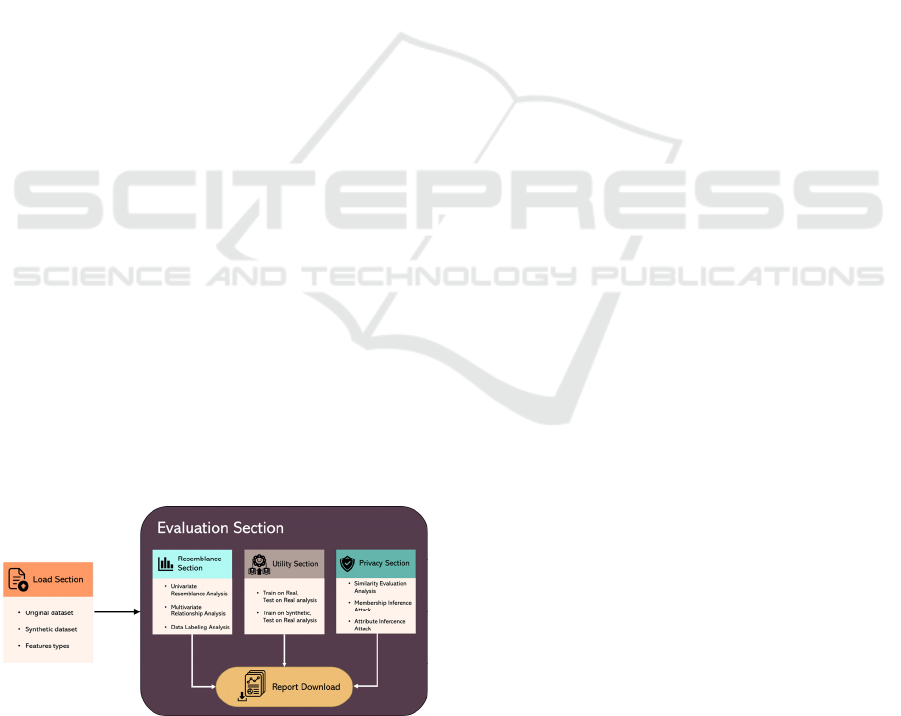
Figure 1 shows the architecture designed for the
application: an initial section where users can upload
the necessary data for quality analysis and a second
section where synthetic data are evaluated using the
metrics described above. Each of the various
subsections allows for downloading a detailed report
of the obtained results.
Figure 1: Architecture diagram of the application. It
comprises two distinct sections: a data loading section and
a section implementing the evaluation metrics for synthetic
data quality.
3 RESULTS
3.1 Dashboard Implementation
For the development of the application, we used the
Python Dash package, a library used for creating
interactive and customized applications. Code and
installation instructions are available in a GitHub
repository (Santangelo, 2023).
As illustrated in Figure 2, the application is
composed of panels reflecting the architecture
illustrated in Figure 1. Through the navigation bar at
the bottom of each page, users can navigate through
the panels after entering the required data (refer to
Appendix section, Figure 9-17, for additional images
related to the application GUI). In the following
paragraphs the application’s panels are described in
detail.
3.1.1 Load Datasets Panel
In the first panel, users can upload all the data
necessary for quality evaluation in Comma Separated
Values (CSV) files (Figure 2, panel 1): (1) the
original dataset, (2) the synthetic dataset and (3) a file
indicating the type (numerical or categorical) of each
feature in the uploaded datasets. The structure of this
file consists of two columns, labelled “Feature” and
“Type”. In the first column, all the features names
from the uploaded datasets will be listed, and in the
second column, the corresponding feature type.
3.1.2 Evaluation Panel
Once the users have uploaded the data, they can
execute the quality assessment of the synthetic data.
It consists of three panels, each implementing a
different quality analysis as described in the Methods
section.
From the Resemblance panel (Figure 2, panels 2-
a), the user can access three different subsections.
First, URA analysis can be performed. The user can
select the desired statistical tests and distance metrics
from three different dropdown menus. Under each
dropdown menu, a table displays the results obtained
for each feature. Additionally, only for statistical
tests, table’s rows are highlighted in red or green
based on accepting/refuting the null hypothesis and,
by clicking on a feature in the table, the user can view
a comparative plot of probability distribution (for
continuous features) or bar plot of the proportions of
each category (for categorical features) with original
data and synthetic data.
SynthCheck: A Dashboard for Synthetic Data Quality Assessment
249
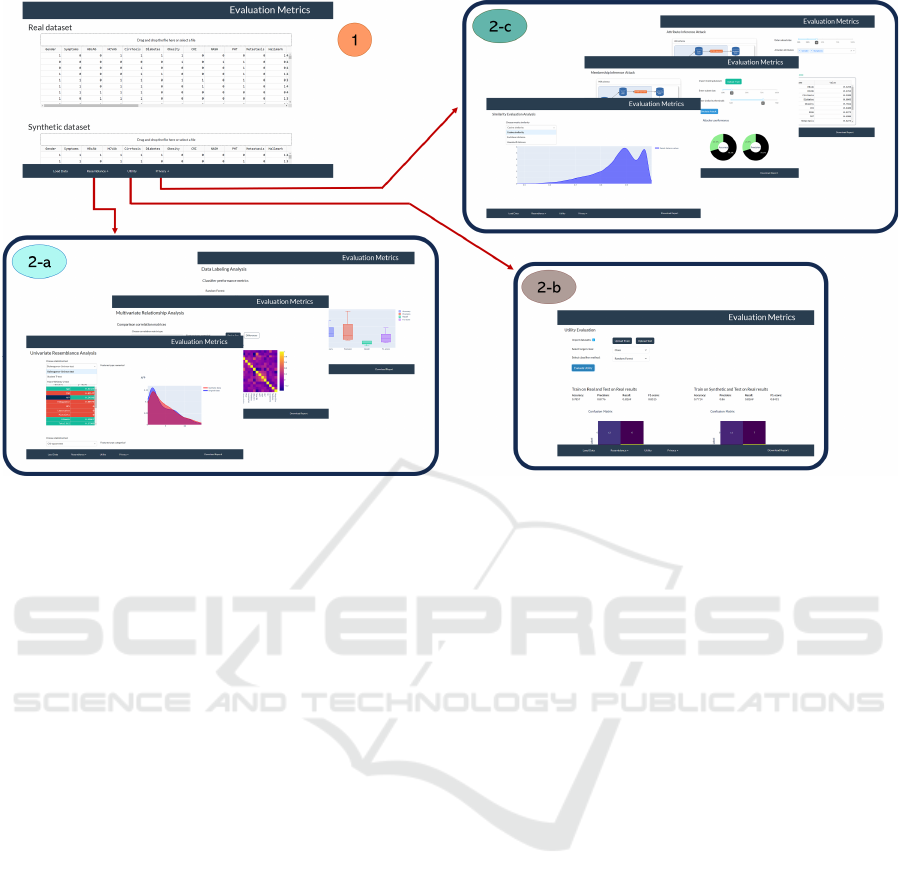
Figure 2: Navigation diagram of the sections included in the application. After loading the required data (panel 1), from the
navigation bar at the bottom, it is possible to navigate through various panels to perform specific analysis: Resemblance
analysis (panels 2-a), Utility analysis (panel 2-b) and Privacy analysis (panels 2-c). Furthermore, from the navigation bar, a
button is available for the user to download a report of the panel they are currently in (this button is not present in the data
loading panel).
In the second subsection, all the metrics related to
the MRA analysis are computed. In the correlation
matrices section, the user can choose from a
dropdown menu whether to view matrices related to
continuous or categorical features. In addition, the
user can choose to view the matrices separately for
real and synthetic data or the difference matrix
between the two. In the outliers analysis section, a
comparative plot with two boxplots of the negative
LOF score in real and synthetic data is shown. While
in the variance explained analysis section, a plot
showing the explained variance ratio trend as the
components considered increase, considering the
original data and the synthetic data; moreover, in the
adjacent table are listed the differences between the
explained variance ratio with original and synthetic
data. At the end of this subsection, the user can
perform the UMAP method and choose the
parameters with which the method should be
executed. In addition, there are two buttons that
implement two different strategies: with the first one,
two separate graphs will be displayed for comparison
between real and synthetic data, while with the
second button, it will be shown a single graph
obtained by running the UMAP method on a single
dataset obtained by concatenating the original and
synthetic datasets.
The last subsection does not implement any user
interactions and it presents the results related to the
DLA analysis. On the left, for each classifier used in
the analysis, the values of performance metrics
(accuracy, precision, recall and F1 score) are
displayed, while on the right, four boxplots related to
the metrics are shown.
In the Utility panel (Figure 2, panels 2-b), the
TRTR and the TSTR approaches are implemented.
Initially, the user has to select, through the two
dropdown menus, a target class from the available
options (only categorical features are listed, since
both analyses are based on a classification problem)
and a ML model to be trained. Furthermore, the user
can choose to upload the original training set and test
set using the buttons at the top, otherwise a random
split of the original dataset already uploaded will be
performed. Then the analysis can be started using the
button at the bottom.
The Privacy panel (Figure 2, panels 2-c) includes
all the analysis performed for privacy evaluation,
therefore the user can access three different
subsections.
The first subsection displays the results obtained
from the SEA analysis. The user can select from the
HEALTHINF 2024 - 17th International Conference on Health Informatics
250

dropdown menu which metric to compute. If cosine
similarity or Euclidean distance is chosen, density
plots of the paired distance values calculated will be
shown. For the Hausdorff distance, only its
corresponding value will be shown.
In the second subsection, a MIA is simulated and
the attacker's performance is shown to the user upon
completing the simulation. Initially, the user has to
upload the training set used in the generation of the
analysed synthetic data and choose, using the
available sliders, the size of the dataset portion that
the attacker will have access to during the attack and
the similarity threshold used by the attacker. Once
this information is provided, the simulation can be
started and, when it is finished, the attacker’s
performance (accuracy and precision) is displayed
through two pie charts.
The last subsection is related to the AIA
simulation. The user has to set the size of the portion
of the original dataset available to the attacker using
a slider. Additionally, through the dropdown menu,
the user has to select which features from the original
dataset, the attacker will have access to during the
attack. Subsequently, the simulation results will be
shown in a tabbed interface and, by clicking on one
of the two different tabs (“Accuracy” or “RMSE”),
the user can view the reconstruction performance of
categorical and continuous features, respectively. In
particular, for the continuous features, the
Interquartile Range (IQR) is also shown to better
understand the RMSE value obtained for each
feature.
Additionally, each panel allows the user to
download a report containing the graphs and/or tables
displayed within that specific panel.
3.2 A Case Study with MIMIC Dataset
To assess the validity and functionality of the
developed application, the MIMIC-II dataset was
utilized. This dataset (Silva et al., 2012), contains
vital signs and heterogeneous clinical data of 12,000
ICU patients. Up to 42 variables were recorded for
each patient at least once during the first 48 hours
after admission to the ICU: 6 of these variables are
general descriptors and time series variables with
multiple observations.
Aggregated features were obtained as reported in
(Johnson, 2018/2023), followed by removal of
features with at least 70% missing values. The
resultant dataset consists of 109 features and 6000
records, with some features containing missing
values. Before proceeding with the generation of
synthetic data, the dataset was divided into training
set (80%) and test set (20%) and then to address
missing data, MICE (Multivariate Imputation by
Chained Equations) from the homonym R library
(Buuren & Groothuis-Oudshoorn, 2011), was used.
To generate synthetic data, we select two
approaches, namely HealthGAN (Yale et al., 2020)
and Synthetic Data Vault (SDV) (Patki et al., 2016).
The first method is a deep learning approach that
creates a generative model for synthesizing new data;
specifically, the method uses a modified Generative
Adversarial Network (GAN).
The SDV method learns statistical information
from the original dataset to create the generative
model from which, subsequently, new synthetic data
is sampled. Each feature of the dataset to be modelled
is associated with the parameters of a continuous
statistical distribution. Then, the covariance matrix
among the features is estimated. Therefore, the
generative model consists of the set of all parameters’
distribution and the covariance matrix.
For the sake of readability, only MRA results for
Resemblance evaluation, Utility results and MIA
results for Privacy evaluation are reported and
discussed.
3.2.1 MRA (Resemblance) Results
Table 2 compares correlation matrices derived from
real and synthetic data (both for continuous and
categorical features). The percentage of feature pair
combinations with a difference between real and
synthetic values less than 0.1 was calculated. For the
LOF method, the percentage ratio between the
numbers of identified synthetic and real outliers
(negative LOF score < -1.5) is reported. Finally, the
difference between real and synthetic data in terms of
explained variance, considering one component and
two components, is reported for the PCA.
Table 2: Summary table of MRA results.
HealthGAN SDV
Pearson correlation
matrix
(%feature combination with
difference < 0.1)
92 95
Normalized contingency
table
(%feature combination with
difference < 0.1)
76 48
LOF method
(%ratio synthetic and real
outliers)
55.45 7.27
PCA method
(%difference explained
variance real-synthetic)
1.90
3.94
20.21
5.54
SynthCheck: A Dashboard for Synthetic Data Quality Assessment
251
As shown in Table 2, both methods appear to
perform well in replicating the statistical properties of
the original data. In particular, the HealthGAN
approach seems to provide excellent results even for
categorical features and outliers replication. Indeed,
the percentage of synthetic categorical feature pair
combinations that adheres to the dependency
structure of the original features and outliers
replication ratio is higher with HealthGAN.
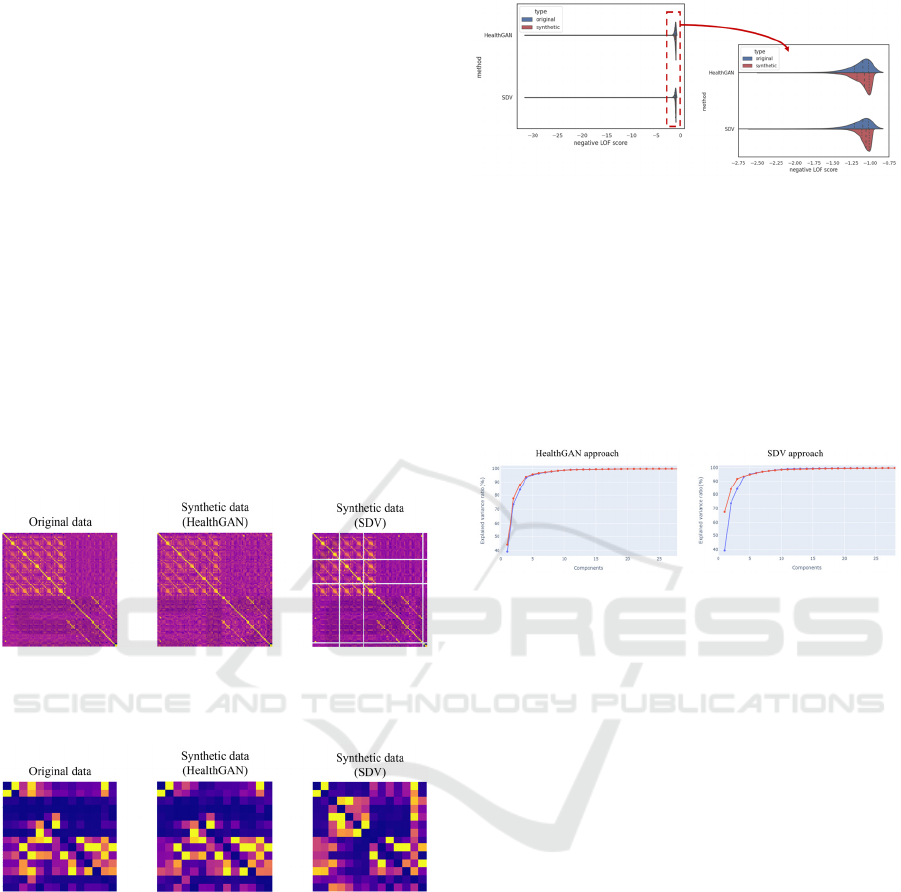
Figure 3 and Figure 4 show correlation matrices
for continuous features and normalized contingency
tables for categorical features. As seen in Figure 4,
HealthGAN and SDV methods manage to faithfully
replicate the correlation structure among the
categorical features of the original dataset, as the
matrices (original vs. synthetic) are very similar. The
same conclusions can be drawn for continuous
features (see Figure 3), but only concerning the
HealthGAN method, as the matrix obtained with the
synthetic data generated by the SDV method has
some “gaps”.
Figure 3: Correlation matrices for continuous features (on
the left for original data, in the centre for synthetic data with
HealthGAN and on the right for synthetic data with SDV).
Figure 4: Normalized contingency tables for categorical
features (on the right for original data, at the upper left for
synthetic data with HealthGAN and at the bottom left for
synthetic data with SDV).
The long-tailed distribution of the violin plots in
Figure 5 is due to the distribution of the negative LOF
scores of the original dataset. As observed, both SDG
methods fail to faithfully replicate the behaviour of
the original data concerning outliers, although the
HealthGAN method appears to perform better
compared to the SDV method.
Figure 5: Splitted violin plots depicting the distribution of
negative LOF scores for original observations (blue) and
synthetic observations (red), obtained with HealthGAN
(top) and SDV (bottom).
Using PCA, the synthetic data obtained with both
methods show a very similar behaviour to the original
data (see Figure 6). Indeed, the two trends are almost
completely overlapped, with slight differences when
considering the first five components, especially with
the SDV method.
Figure 6: Plots showing the explained variance trend,
considering the original data (blue) and the synthetic data
(red), with HealthGAN (on the left) and SDV (on the right).
Figure 7 reports the UMAP projections of the
original and synthetic data. The UMAP parameter
controlling the number of neighbours was set to 20,
while the parameter determining the minimum
distance between points in the reduced representation
was set to 0.1. Particularly for HealthGAN, the results
obtained can be considered acceptable since the
“shape” of the synthetic data is similar to that of the
original data, even if rotated. For example, the central
cavity that is more prominent in the original data but
still present in the synthetic data generated with
HealthGAN and the perimeter shape of the synthetic
data, in this case with both HealthGAN and SDV
methods, that closely resembles that of the original
data.
Figure 8 was obtained using the same UMAP
parameters as in Figure 7, but in this case, the original
dataset was concatenated with the synthetic one.
From Figure 8, it can be observed that with both SDG
methods, the synthetic data adheres to the original
data, although the synthetic data obtained with the
SDV method does not cover some small portions of
the original dataset.
HEALTHINF 2024 - 17th International Conference on Health Informatics
252
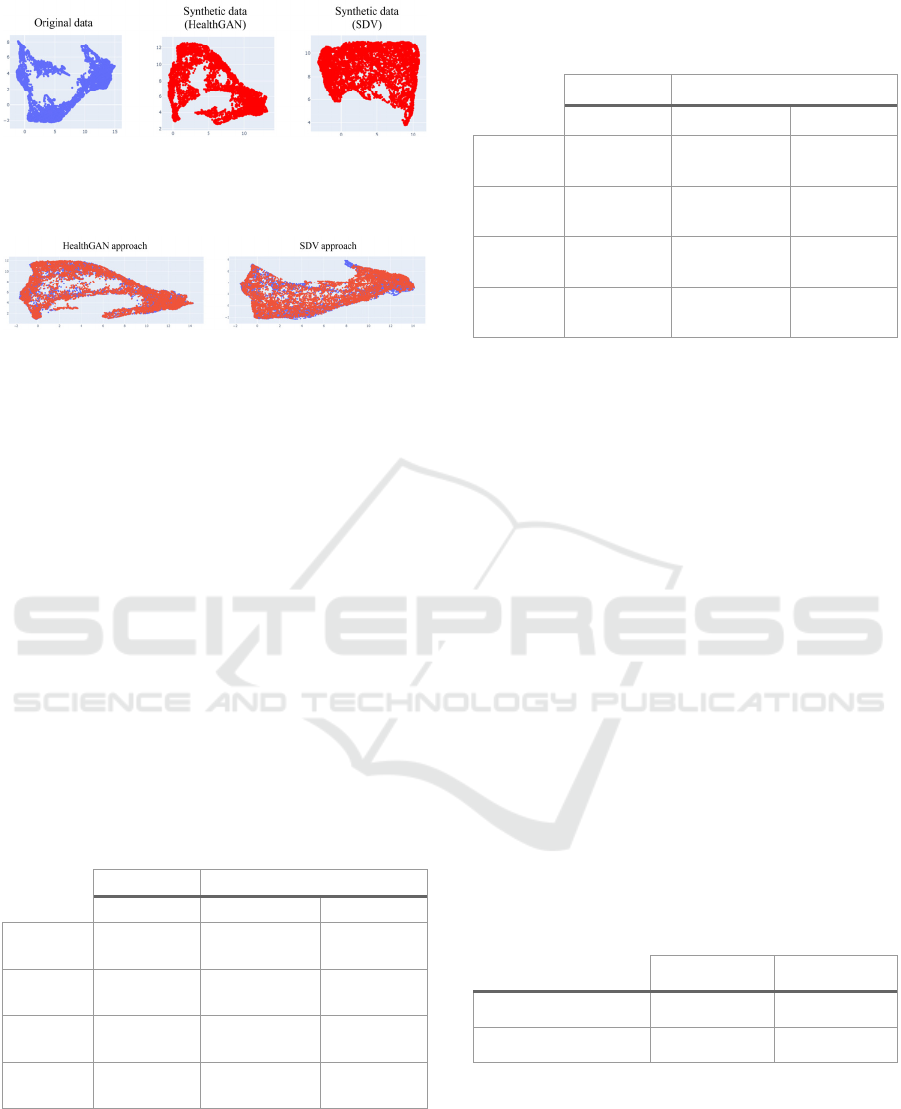
Figure 7: UMAP projections of the original data (in blue,
on the left) and the synthetic data with HealthGAN (in red,
in the centre) and with SDV (in red, on the right).
Figure 8: UMAP projections of the original dataset (blue)
concatenated with synthetic dataset (red), using
HealthGAN (left) and SDV (right).
3.2.2 Utility Results
In this analysis, a classifier was trained on a
classification problem (target class
“Inhospital_death”), initially using real data (TRTR
approach) and then using synthetic data (TSTR
approach). Both classifiers were tested on the same
original test set. In addition, the same training set and
test set used in learning the generative model were
selected as the original training set and original test
set, respectively. The results obtained with two
approaches are shown in Table 3 (with Random
Forest classifier) and Table 4 (with Decision Tree
classifier), which report the 95% confidence intervals
obtained through 100 replications.
Table 3: Summary table of Utility evaluation, with TRTR
approach results and TSTR approach results. The classifier
used is Random Forest with target class “Inhospital_death”.
TRTR TSTR
HealthGAN SDV
accuracy
(0.875,
0.876)
(0.867,
0.868)
(0.866,
0.867)
precision
(0.682,
0.700)
(0.374,
0.521)
(0.468,
0.502)
recall
(0.129,
0.134)
(0.005,
0.008)
(0.048,
0.052)
F1 score
(0.217,
0.225)
(0.010,
0.015)
(0.086,
0.094)
The goal of Utility evaluation is not to assess the
obtained performance (whether high or low) but to
analyse the differences between the values of the
performance metrics obtained in the TRTR approach
and those obtained in the TSTR approach.
Table 4: Summary table of Utility evaluation, with TRTR
approach results and TSTR approach results. The classifier
used is Decision Tree with target class “Inhospital_death”.
TRTR TSTR
HealthGAN SDV
accuracy
(0.785,
0.788)
(0.795,
0.799)
(0.616,
0.620)
precision
(0.280,
0.285)
(0.271,
0.280)
(0.136,
0.139)
recall
(0.387,
0.395)
(0.312,
0.320)
(0.349,
0.358)
F1 score
(0.325,
0.331)
(0.290,
0.297)
(0.195,
0.200)
Generally, if the model inherently overfits the data
(such as Decision Tree) and the synthetic data are
very similar to the original data, then the differences
between the performance metrics obtained with the
two approaches (TRTR and TSTR) will be less
pronounced compared to when a classifier that
overfits less (such as Random Forest) is used. As
evident from Table 3 and Table 4, better results in
utility evaluation are obtained using the Decision
Tree classifier.
3.2.3 MIA (Privacy) Results
Table 5 shows the results achieved by providing the
attacker with half of the original dataset and using a
similarity threshold of 0.7, which the attacker uses to
identify the records. The 95% confidence intervals
were obtained through 50 replications. From the
information present in this portion of the original
dataset and the information contained in the synthetic
dataset, the attacker must be able to identify which
records in the original subset belong to the training set
used during the SDG phase.
Table 5: Summary table of MIA results, showing the
attacker’s performance values (accuracy and precision).
HealthGAN SDV
Attacker’s accuracy (0.798, 0.800) (0.799, 0.802)
Attacker’s precision (0.798, 0.800) (0.799, 0.800)
The attacker’s performance is quite high in all the
considered cases. This indicates that the synthetic
data are similar to the original data used for training,
as the attacker was able to identify the latter based on
the synthetic data.
Different results can be obtained by changing the
proportion of the original dataset provided to the
SynthCheck: A Dashboard for Synthetic Data Quality Assessment
253

attacker and the similarity threshold used by the
attacker. For example, reducing the size of the
original subset will result in lower attacker
performance. However, it was chosen to show the
performance with half of the original dataset, as it
represents a meaningful test case.
4 CONCLUSIONS
This paper presents a dashboard application that,
through a simple and intuitive GUI, allows users to
conduct a quality analysis of a synthetic dataset
obtained using any generative method. The
application implements various quality evaluation
metrics across three different assessment aspects, to
evaluate the quality of synthetic data: resemblance,
utility and privacy preservation. Furthermore, the
users can also download summary reports from the
different evaluation panels. The application is freely
available for download at (Santangelo, 2023).
In order to assess the performance of the different
proposed metrics, they were used to evaluate the
quality of synthetic datasets obtained from two SDG
methods, namely HealthGAN and SDV. The original
dataset used is the MIMIC-II, which contains EHR
information from patients in ICU. In general,
synthetic data successfully replicate original data’s
statistical properties and ML classifiers’ performance
metrics obtained with the original dataset. However,
the privacy aspect is not fully respected since the
synthetic data are too similar to the original data.
Furthermore, the HealthGAN method seems to
overperform compared to the SDV method.
Among the limitations of this work, one is related
to the type of synthetic data generated, which includes
only tabular data, while EHRs may also include
bioimages and biosignals. All the implemented
metrics were designed for the evaluation of tabular
synthetic data, thus requiring modification or the
addition of new metrics for evaluating synthetic data
of a different nature. Another limitation is the
handling of missing data: the application assumes that
input datasets do not contain missing values.
Therefore, datasets with missing values need to be
imputed before use.
Regarding future developments of the
implemented metrics, it would be important and
advantageous for some analyses to integrate an
explainability (XAI) component for the results
obtained. For example, in the case of DLA, which
uses ML algorithms, it could be useful to identify
which features had a greater or lesser impact on the
final results, allowing for a detailed inspection of
these features. Moreover, it would be useful to
integrate a section for the evaluation of missing data’s
patterns, when they are present in the input datasets.
ACKNOWLEDGEMENTS
Gabriele Santangelo is a PhD student enrolled in the
National PhD program in Artificial Intelligence,
XXXIX cycle, course on Health and life sciences,
organized by Università Campus Bio-Medico di
Roma. This work was supported by “Fit4MedRob-
Fit for Medical Robotics” Grant B53C22006950001.
REFERENCES
Azizi, Z., Lindner, S., Shiba, Y., Raparelli, V., Norris, C. M.,
Kublickiene, K., Herrero, M. T., Kautzky-Willer, A.,
Klimek, P., Gisinger, T., Pilote, L., & El Emam, K.
(2023). A comparison of synthetic data generation and
federated analysis for enabling international evaluations
of cardiovascular health. Scientific Reports, 13(1),
11540. https://doi.org/10.1038/s41598-023-38457-3
Buuren, S. van, & Groothuis-Oudshoorn, K. (2011). mice:
Multivariate Imputation by Chained Equations in R.
Journal of Statistical Software, 45, 1–67.
https://doi.org/10.18637/jss.v045.i03
Chen, A., & Chen, D. O. (2022). Simulation of a machine
learning enabled learning health system for risk
prediction using synthetic patient data. Scientific
Reports, 12(1), 17917. https://doi.org/10.1038/s41598-
022-23011-4
Giomi, M., Boenisch, F., Wehmeyer, C., & Tasnádi, B.
(2023). A Unified Framework for Quantifying Privacy
Risk in Synthetic Data. Proceedings on Privacy
Enhancing Technologies, 2023(2), 312–328.
https://doi.org/10.56553/popets-2023-0055
Goncalves, A., Ray, P., Soper, B., Stevens, J., Coyle, L., &
Sales, A. P. (2020). Generation and evaluation of
synthetic patient data. BMC Medical Research
Methodology, 20(1), 108. https://doi.org/10.1186/s128
74-020-00977-1
Hernadez, M., Epelde, G., Alberdi, A., Cilla, R., & Rankin,
D. (2023). Synthetic Tabular Data Evaluation in the
Health Domain Covering Resemblance, Utility, and
Privacy Dimensions. Methods of Information in
Medicine, 62(S 01), e19–e38. https://doi.org/10.1055/s-
0042-1760247
Hernandez, M., Epelde, G., Alberdi, A., Cilla, R., & Rankin,
D. (2022). Synthetic data generation for tabular health
records: A systematic review. Neurocomputing, 493, 28–
45. https://doi.org/10.1016/j.neucom.2022.04.053
Johnson, A. (2023). Challenge2012 [Jupyter Notebook].
https://github.com/alistairewj/challenge2012 (Original
work published 2018)
HEALTHINF 2024 - 17th International Conference on Health Informatics
254
Joshi, G., Jain, A., Araveeti, S. R., Adhikari, S., Garg, H., &
Bhandari, M. (2022). FDA approved Artificial
Intelligence and Machine Learning (AI/ML)-Enabled
Medical Devices: An updated landscape [Preprint].
Health Informatics. https://doi.org/10.1101/2022.12.07.
22283216
Patki, N., Wedge, R., & Veeramachaneni, K. (2016). The
Synthetic Data Vault. 2016 IEEE International
Conference on Data Science and Advanced Analytics
(DSAA), 399–410. https://doi.org/10.1109/DSAA.201
6.49
Philpott, D. (Ed.). (2018). A guide to Federal terms and
acronyms (Second edition). Bernan Press.
Raab, G. M., Nowok, B., & Dibben, C. (2021). Assessing,
visualizing and improving the utility of synthetic data.
https://doi.org/10.48550/ARXIV.2109.12717
Reiner Benaim, A., Almog, R., Gorelik, Y., Hochberg, I.,
Nassar, L., Mashiach, T., Khamaisi, M., Lurie, Y.,
Azzam, Z. S., Khoury, J., Kurnik, D., & Beyar, R. (2020).
Analyzing Medical Research Results Based on Synthetic
Data and Their Relation to Real Data Results: Systematic
Comparison From Five Observational Studies. JMIR
Medical Informatics, 8(2), e16492. https://doi.org/10.219
6/16492
Rodriguez-Almeida, A. J., Fabelo, H., Ortega, S., Deniz, A.,
Balea-Fernandez, F. J., Quevedo, E., Soguero-Ruiz, C.,
Wägner, A. M., & Callico, G. M. (2023). Synthetic
Patient Data Generation and Evaluation in Disease
Prediction Using Small and Imbalanced Datasets. IEEE
Journal of Biomedical and Health Informatics, 27(6),
2670–2680. https://doi.org/10.1109/JBHI.2022.3196697
Santangelo, G. (2023). SynthCheck [Python]. https://github.
com/bmi-labmedinfo/SynthCheck.git
Silva, I., Moody, G., Scott, D. J., Celi, L. A., & Mark, R. G.
(2012). Predicting in-hospital mortality of ICU patients:
The PhysioNet/Computing in cardiology challenge 2012.
39, 245–248. Scopus.
SynthEval. (2023). [Jupyter Notebook]. schneiderkamplab.
https://github.com/schneiderkamplab/syntheval
(Original work published 2023)
Task, C., Bhagat, K., & Howarth, G. (2023). SDNist v2:
Deidentified Data Report Tool (1.0.0) [dataset]. National
Institute of Standards and Technology. https://doi.org/
10.18434/MDS2-2943
Tucker, A., Wang, Z., Rotalinti, Y., & Myles, P. (2020).
Generating high-fidelity synthetic patient data for
assessing machine learning healthcare software. Npj
Digital Medicine, 3(1), 147. https://doi.org/10.1038/
s41746-020-00353-9
Yale, A., Dash, S., Dutta, R., Guyon, I., Pavao, A., & Bennett,
K. P. (2020). Generation and evaluation of privacy
preserving synthetic health data. Neurocomputing, 416,
244–255. https://doi.org/10.1016/j.neucom.2019.12.136
Yan, C., Yan, Y., Wan, Z., Zhang, Z., Omberg, L., Guinney,
J., Mooney, S. D., & Malin, B. A. (2022). A Multifaceted
benchmarking of synthetic electronic health record
generation models. Nature Communications, 13(1),
7609. https://doi.org/10.1038/s41467-022-35295-1
APPENDIX
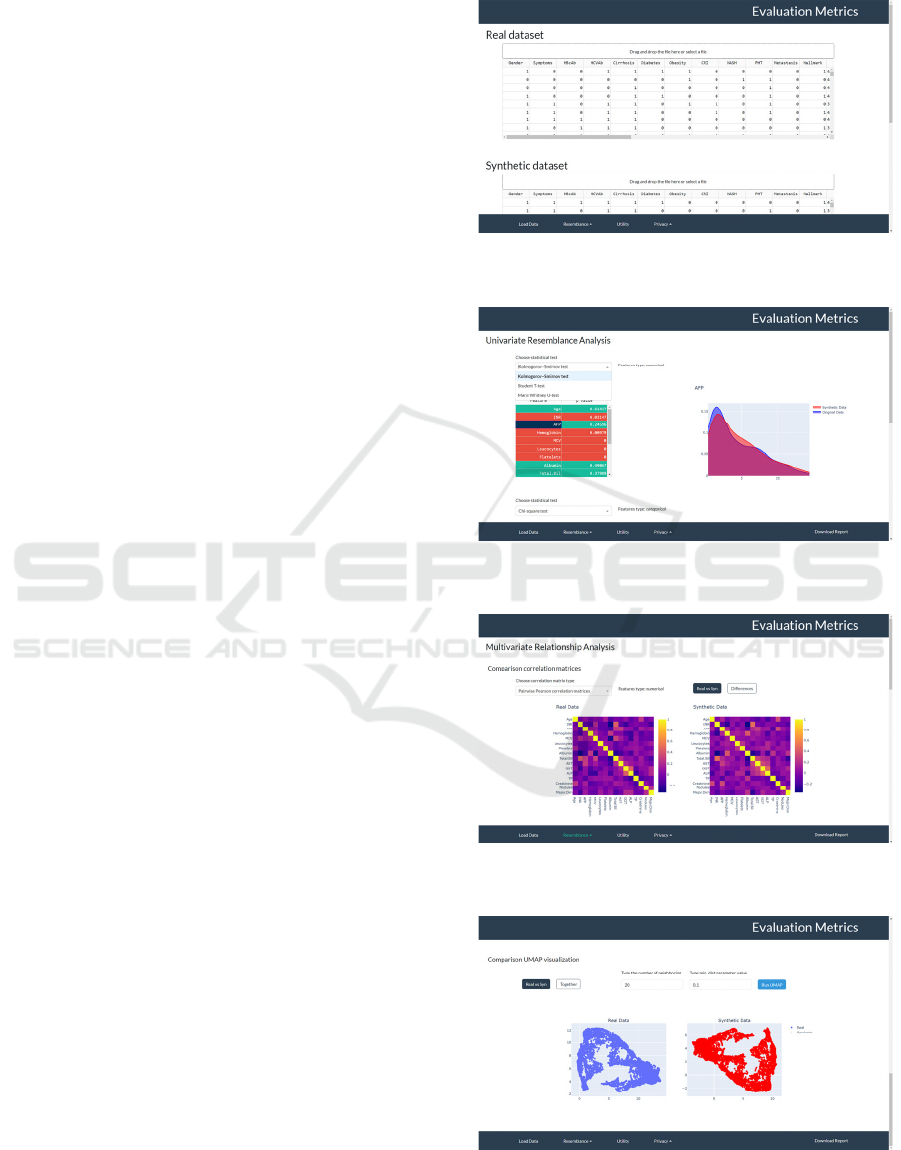
Figure 9: Initial screen with details about the table shown
to the user during the upload of the original dataset.
Figure 10: Detail of the results obtained with the statistical
tests in the URA subsection.
Figure 11: Detail of the comparison of correlation matrices
in the MRA subsection.
Figure 12: Detail of the dataset comparison using the
UMAP method in the MRA subsection.
SynthCheck: A Dashboard for Synthetic Data Quality Assessment
255
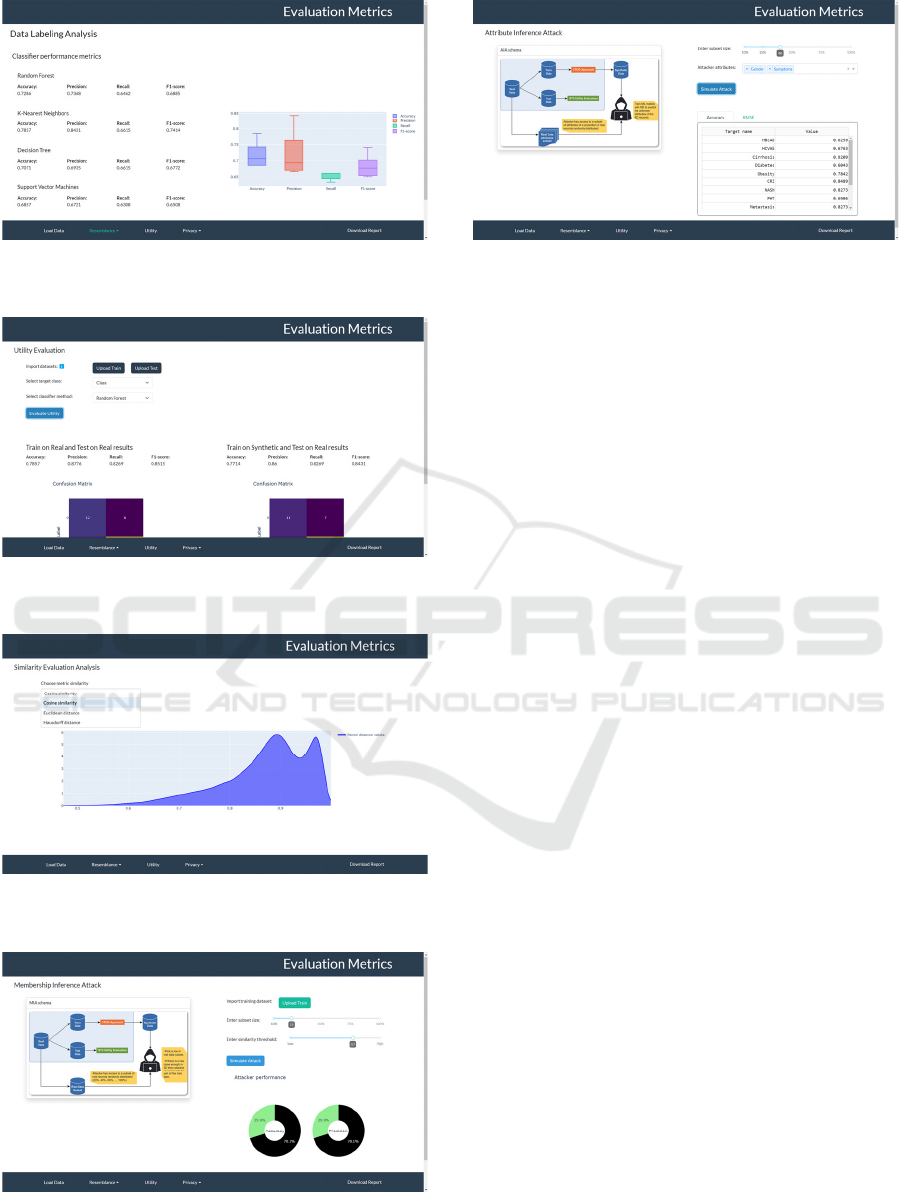
Figure 13: Subsection related to DLA analysis with
boxplots.
Figure 14: Input panel for providing information required
for executing the Utility evaluation and results section.
Figure 15: Section for the SEA analysis with the result, in
the case of Cosine similarity calculation.
Figure 16: Input panel of the data required for the MIA
simulation and results section.
Figure 17: Input panel of the data required for the AIA
simulation and results section.
HEALTHINF 2024 - 17th International Conference on Health Informatics
256
