
A Novel Keystroke Dataset for Preventing Advanced Persistent Threats
Xiaofei Wang*
a
, Rashik Shadman*
b
, Daqing Hou
c
, Faraz Hussain
d
and
Stephanie Schuckers
e
Electrical and Computer Engineering Department, Clarkson University, Potsdam, NY, U.S.A.
Keywords:
Keystroke Dataset, Keylogger, Authentication, APT.
Abstract:
Computer system security is indispensable in today’s world due to the large amount of sensitive data stored
in such systems. Moreover, user authentication is integral to ensuring computer system security. In this
paper, we investigate the potential of a novel keystroke dynamics-based authentication approach for preventing
Advanced Persistent Threats (APT) and detecting APT actors. APT is an extended and planned cyber-attack
in which the intruder logs into a system many times over a long period of time to gain administrative access
and to steal sensitive data or disrupt the system. Since keystroke dynamics can be made to work whenever
an APT actor is typing on the keyboard, we hypothesize that it naturally be a good match for APT detection.
Furthermore, keystroke dynamics promises to be non-intrusive and cost-effective as no additional hardware is
required other than the keyboard. In this work, we created a novel dataset consisting of keystroke timings of
Unix/Linux IT system administration commands. We evaluated the authentication performance of our novel
dataset on three algorithms, i.e., the Scaled Manhattan distance, and the so-called new distance metric (Zhong
et al., 2012) with/without fusion. We compared our result with that of the state-of-the-art CMU dataset. The
best 95% confidence interval of EER for our Linux Command dataset was (0.038, 0.044) which was very close
to that of the CMU dataset (0.027, 0.031) despite the small size of our dataset.
1 INTRODUCTION
According to NIST (2012), an Advanced Persistent
Threat (APT) is “an adversary that possesses sophis-
ticated levels of expertise and significant resources
which allow it to create opportunities to achieve its
objectives by using multiple attack vectors (e.g., cy-
ber, physical, and deception). These objectives typ-
ically include establishing and extending footholds
within the information technology infrastructure of
the targeted organizations for purposes of exfiltrating
information, undermining or impeding critical aspects
of a mission, program, or organization; or positioning
itself to carry out these objectives in the future.”
An APT is a well-resourced adversary engaged
in sophisticated malicious cyber activity that is tar-
geted and aimed at prolonged network/system intru-
sion. APT objectives could include espionage, data
a
https://orcid.org/0009-0008-4412-4917
b
https://orcid.org/0009-0007-6470-9042
c
https://orcid.org/0000-0001-8401-7157
d
https://orcid.org/0000-0001-8971-1850
e
https://orcid.org/0000-0002-9365-9642
∗
Equal contribution.
theft, and network/system disruption or destruction.
Since a great deal of effort and resources are required
to carry out APT attacks, CISA: Cyber & Infras-
tructure Security Agency (2023a) believes that APTs
are often carried out by nation-state actors that select
high-value targets, such as large corporations or criti-
cal government agencies. According to NIST (2012),
the advanced persistent threat: (i) pursues its objec-
tives repeatedly over an extended period of time; (ii)
adapts to defenders’ efforts to resist it; and (iii) is de-
termined to maintain the level of interaction needed
to execute its objectives.”
In this work, we propose a novel application of be-
havioral biometrics (Ray-Dowling et al., 2023), par-
ticularly keystroke dynamics (Banerjee and Woodard,
2012), to continuously detect APT actors as an ad-
ditional layer of security beyond the initial logins.
This is motivated by the observation that once inside
the targeted system, the APT actors will attempt to
achieve administrative rights or other objectives by
typing commands on command lines. Indeed, this
observation appears to be consistent with the steps
that APT actors took as documented in several recent
high-profile APT cases, e.g., CISA: Cyber & Infras-
894
Wang, X., Shadman, R., Hou, D., Hussain, F. and Schuckers, S.
A Novel Keystroke Dataset for Preventing Advanced Persistent Threats.
DOI: 10.5220/0012558000003654
Paper published under CC license (CC BY-NC-ND 4.0)
In Proceedings of the 13th International Conference on Pattern Recognition Applications and Methods (ICPRAM 2024), pages 894-901
ISBN: 978-989-758-684-2; ISSN: 2184-4313
Proceedings Copyright © 2024 by SCITEPRESS – Science and Technology Publications, Lda.

tructure Security Agency (2023b); DOJ (2023a,b).
Behavioral biometric authentication identifies a per-
son based on the unique patterns exhibited when they
interact with a computing device, such as a tablet, a
smartphone or a computer (including mouse and key-
board). Research has shown that like fingerprints or
iris, the typing patterns of individuals also tend to be
unique. Therefore, it is possible to differentiate im-
posters from genuine users using their typing patterns
and keystroke dynamics. Based on these, we propose
to study the detection of APT actors based on their
keystroke dynamics when typing commands on com-
mand lines.
Since keystroke dynamics can be made to work
whenever an APT actor is typing on the keyboard,
it would naturally be a good match for APT detec-
tion. As elaborated in Section 2, recognizing that
intrusion detection based on the content of com-
mand lines alone is a hard problem, Schonlau et al.
(2001) suggested using command lines in conjunction
with other approaches including behavioral biomet-
rics such as keystroke dynamics. This paper takes the
first step in this direction by collecting a Linux com-
mand keystroke dynamics dataset and conducting al-
gorithmic evaluation.
A keystroke biometric authentication system of-
fers several benefits. Firstly, it is cost-effective since
no extra hardware is needed; the regular keyboard
alone suffices. Additionally, it is non-intrusive as it
does not impose any additional burden on the user.
Keystroke dynamics functions by initially generating
a user-specific enrollment template based on their typ-
ing patterns. During the verification process, a user’s
test sample is compared with their own enrollment
template, and a matching score is calculated and com-
pared with a set threshold for decision-making.
In our work, we developed a keylogger to record
the keystrokes and created a novel keystroke dataset
of 33 subjects typing a set of eleven system adminis-
tration commands. We then extracted different fea-
tures of the keystrokes, including timing features. To
investigate the potential of this dataset in authentica-
tion, we measured the performance of three widely-
used efficient algorithms using our novel dataset and
compared it with the state-of-the-art CMU dataset
(Killourhy and Maxion, 2009).
This paper is organized as follows. Section 2 de-
scribes related work. Section 3 describes the data col-
lection procedure. Sections 4, 5, and 6 present our
algorithms, experimental setup, and the evaluation of
both the new dataset and the CMU dataset. Lastly,
Section 7 concludes the paper.
2 RELATED WORK
Commands Usage-Based APT Detection. Prior
work in behavior-based masquerader detection has
been focused on statistical analysis of Unix com-
mand lines since different users tend to prefer to use
different sets of commands. In particular, (Schon-
lau et al., 2001) presented a useful collection of pi-
oneering masquerader research based on a profile of
command-line usage, in which six masquerader de-
tection techniques were applied to a dataset collected
using the Unix acct auditing mechanism. In terms
of detecting masqueraders, the best detection result
reported was for a Bayes One-Step Markov model,
which achieved a hit rate of 69.3% with a correspond-
ing false-alarm rate of 6.7%. In terms of minimizing
false alarms (targeted at 1%), their best result was ob-
tained by using a “uniqueness” metric that achieved a
39.4% hit rate with a corresponding false-alarm rate
of 1.4%. Using Schonlau et al.’s dataset (Schonlau
et al., 2001), Maxion and Townsend (Maxion and
Townsend, 2002) extended the work from one-class
classifiers to the Na
¨
ıve Bayes binary classifier, achiev-
ing a 56% improvement in masquerader detection
with a corresponding false-alarm rate of just 1.3%.
Due to a limitation of the Unix acct auditing
mechanism, Schonlau et al.’s dataset (Schonlau et al.,
2001) includes only the user-id and the commands
themselves. To overcome this limitation and study the
effects of an enriched command line that also includes
options and arguments, Maxion (Maxion, 2003) ap-
plied the binary na
¨
ıve bayes classifier to the Green-
berg dataset (Greenberg, 1988). The enriched com-
mand lines were found to facilitate correct detection
at the 82% level, far exceeding previous results, with
a corresponding 30% reduction in the overall cost
of errors, and only a small increase in false alarms.
Maxion and Townsend subsequently performed an in-
depth error analysis that reveals more insights about
the factors at work in the detection process (Max-
ion and Townsend, 2004). It is also noteworthy that
unlike Schonlau et al.’s work, Maxion uses only 10
rather than 100 commands in masquerader detection.
Recognizing that intrusion detection based on
command lines is a hard problem, Schonlau et al. was
the first to suggest using command lines in conjunc-
tion with other approaches including behavioral bio-
metrics such as keystroke dynamics. This paper takes
the first step in this direction by collecting a Linux
command keystroke dataset and conducting algorithm
evaluation.
Keystroke Datasets. In the literature, there are sev-
eral keystroke datasets. Wahab et al. (2021) col-
lected keystroke data from students and university
A Novel Keystroke Dataset for Preventing Advanced Persistent Threats
895

staff. The subjects filled out an account recovery
web form of multiple fields viz Full name, Address,
City, Zip, Phone, Email, Declaration, and Password.
500,000 keystrokes were collected from 44 students
and university staff. Tschinkel et al. (2017) col-
lected keystrokes obtained from spreadsheet and web
browsing input. Authentication was performed us-
ing both text and numeric keypad entries. Vural
et al. (2014) collected keystroke data for short pass-
phrases, free-text questions and transcription tasks.
39 subjects participated in the data collection. In the
case of CMU dataset (Killourhy and Maxion, 2009),
there were 51 subjects. Each subject typed the pass-
word “.tie5roanl” 400 times in 8 sessions (50 times
per session). A more detailed discussion of several
keystroke datasets can be be found in a recent survey
on keystroke dynamics (Shadman et al., 2023).
Runtime Feature-Based APT Detection. In prior
work, a classification model was introduced to detect
Advanced Persistent Threats (APT) (Chandran et al.,
2015). To build the model, they gathered APT mal-
ware samples from the internet and extracted various
features. These features were used to train the model,
which was subsequently tested on a target system.
Whenever an APT attack was detected on the system,
the model triggered an alert signal. They employed
various models for this task, and the Random Forest
model exhibited the highest accuracy of 99.8%.
In (Mirza et al., 2014), APT countermeasures
focused on detecting malware through a technique
called windows function hooking. This approach
was employed to identify zero-day attacks, which are
previously unknown and unaddressed vulnerabilities.
Malware often calls specific windows functions that
are essential for completing the attack. These partic-
ular functions are typically APIs accessed by special-
ized Dynamic Link Libraries (DLLs). By utilizing
function hooking, they intercepted low-level DLLs,
enabling observation of potential malware executions.
While these methods can be effective, they typically
rely on prior knowledge of attacks to train the model.
3 DATA COLLECTION: THE
LINUX COMMAND
KEYSTROKE DATASET
In order to generate a novel Linux Command
keystroke dataset, we performed the data collec-
tion on Linux. The Linux operating systems record
keystroke events as a user types on the keyboard. We
can access these events through the Linux IO library:
<linux/input.h>. We developed a Linux keylogger
Table 1: Eleven common Linux administration commands
participants typed during data collection.
Linux Commands Functionality
grep Print lines that match patterns
ls List directory contents
pwd Print name of current/working directory
uptime Tell how long the system has been running
ps Report a snapshot of the current process
fdisk Manipulate disk partition table
kill Send a signal to a process
cd Change directory
ifconfig Configure a network interface
du Estimate file space usage
df Report file system disk space usage
which once initialized, continues working in the back-
ground, until discontinued. This keylogger records
the event of every key press and key release as shown
in Figure 1. It also records the time of every key press
and key release. As a result, latency (time between
consecutive key presses/ key releases) and hold time
(time between press and release of a key) can be ex-
tracted. Table 1 depicts the list of common Linux
system administration commands that we used in our
data collection.
We recruited 33 subjects to participate in the
study. The task was for the subject to type the eleven
Linux commands in Table 1 in a fixed order. These
commands have a total of 40 characters. We con-
ducted one session for most of the users, which took
about 45 minutes. There were 50 repetitions of the
Linux commands by each user. We collected those
keystrokes and extracted the timing features. In light
of the CMU password dataset (Killourhy and Max-
ion, 2009), this list of eleven Linux commands, when
combined, can be considered as working like a long
password when typed in a fixed order.
For the data collection, we used our Linux key-
logger that records the timestamp of every key press
and key release in a log file. Figure 1 depicts a sample
log file. In the log file, time is recorded in HH:MM:SS
format followed by the number of microseconds. This
log file is used as input to a python code. The python
ICPRAM 2024 - 13th International Conference on Pattern Recognition Applications and Methods
896
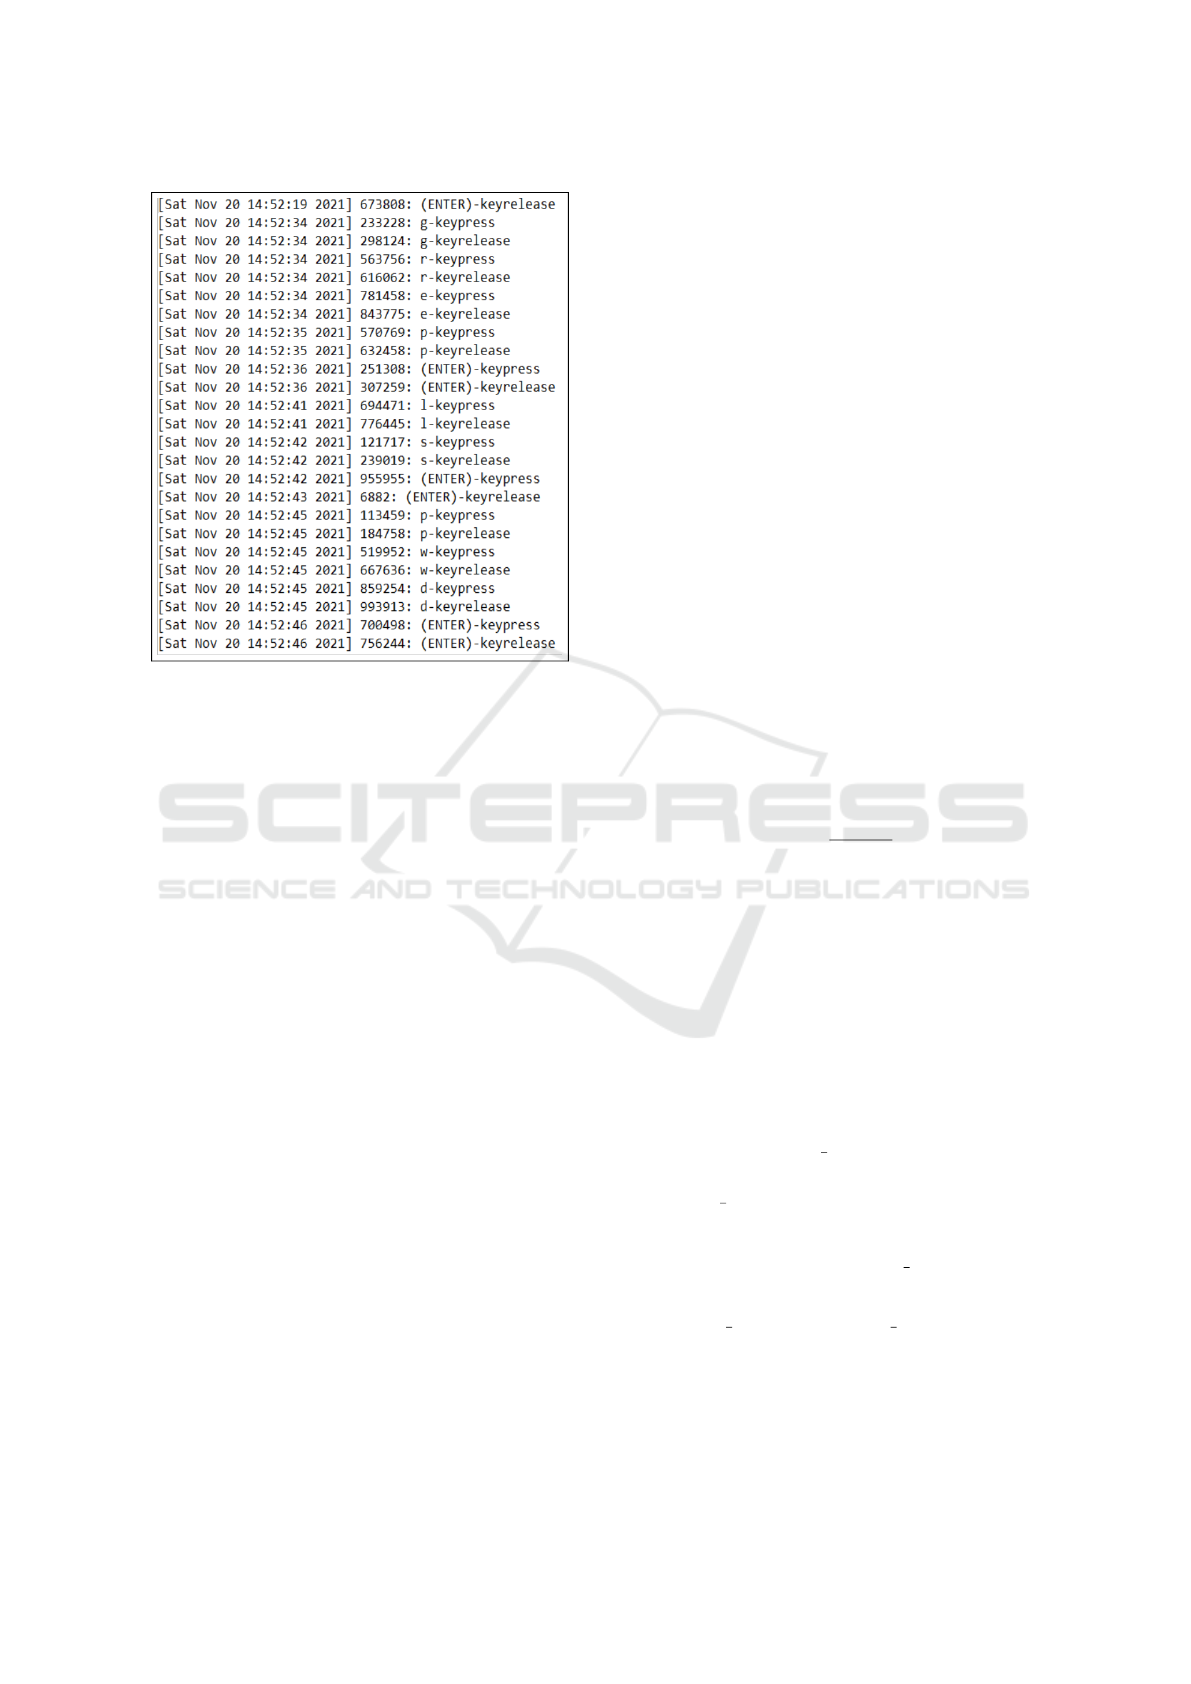
Figure 1: Sample log file generated by Linux keylogger.
This log file contains the key press time and key release time
of every key in HH:MM:SS format and also in microsecond
after second.
code extracts all the timing features from the log file
and outputs the timing values which are used as data
input to the authentication algorithm. Two timing fea-
tures between every pair of successive keys of a Linux
command as well as the hold time of every key were
considered:
• PP = key press time of key2 – key press time of
key1
• RP = key press time of key2 – key release time of
key1
• H = key release time – key press time
These are the features that were used to compare the
typing pattern of two users.
Table 2 depicts timing features of first two Linux
commands, ‘grep’ and ‘ls’. As it is shown in Ta-
ble 2, no timing feature was considered between the
keystrokes of two consecutive Linux commands, e.g.
between ‘p’ of ‘grep’ and ‘l’ of ‘ls’. Figure 2 depicts
an example CSV file of the processed keystroke data.
In the .csv file, the first column shows the index of the
user. The second column shows the session number
of the user. The third column shows the number of
repetition of the Linux commands in the correspond-
ing session. In the next columns, the keystroke timing
data is inputted. This .csv file was used as input to the
authentication algorithms.
Upon request our dataset can be made freely avail-
able to others for research purposes.
4 ALGORITHMS
In this section, we describe the algorithms that we use
to evaludate our dataset. The Scaled Manhattan dis-
tance and the new distance metric were introduced in
earlier work. We apply fusion to the new distance
metric for better performance.
4.1 Algorithm 1: Scaled Manhattan
Distance
In (Killourhy and Maxion, 2009), Killourhy and Max-
ion used 14 anomaly detectors to perform classifica-
tion of genuine users and imposter users. The Scaled
Manhattan distance showed the best performance. As
described by Araujo et al. (2004), this detector has
an improvement over the Manhattan algorithm. The
method of the Scaled Manhattan distance is easily un-
derstood and shown in Equation 1. Initially, we need
to calculate the mean vector and the mean absolute
deviation of each feature. In the testing phase, the
same as in the Manhattan distance method, the gen-
uine anomaly score is calculated as difference in i-th
features of the test and mean vectors which is then
divided by the average absolute deviation from the
training phase.
d =
n
∑
i=1
|X
i
−Y
i
|
A
i
(1)
4.2 Algorithm 2: New Distance Metric
In (Zhong et al., 2012), Zhong, Deng, and Jain intro-
duced a new distance metric by combining ideas from
Mahalanobis distance and Manhattan distance. With
the CMU dataset, this new distance metric achieved
an EER of 0.087, which is better than the 0.096 EER
for Scaled Manhattan distance on the same dataset.
In the testing phase, we calculate the genuine scores
and imposter scores with Equation 2, where x and y
are points in genuine training data and testing sample
data, respectively, and S
−
1
2
is the inverse of the square
root of covariance matrix S. Equation 3 shows the cal-
culation of S
1
2
, the square root of covariance matrix S,
where P is the matrix of all eigenvectors of S.
||x − y||
′
= ||x
′
− y
′
||
1
= ||S
−
1
2
(x − y)||
1
(2)
S
1
2
= P ∗ (P
−1
∗ S ∗ P)
1
2
∗ P
−1
(3)
A Novel Keystroke Dataset for Preventing Advanced Persistent Threats
897

Table 2: Example timing features from two Linux com-
mands, grep and ls.
Linux Command Keys Timing Features
g H.g
PP.g.r
RP.g.r
r H.r
PP.r.e
RP.r.e
e H.e
PP.e.p
RP.e.p
p H.p
l H.l
PP.l.s
RP.l.s
s H.s
4.3 Algorithm 3: New Distance Metric
(with Fusion)
Since using more than one sample to generate genuine
scores and imposter scores is believed to be more ac-
curate for making classification decisions, we apply
fusion to the new distance metric method. In this pa-
per, we use the minimum, average, and maximum of
multiple scores to generate the final decision score.
We perform fusion with 2, 3, 4, 5 samples per fusion,
to evaluate the impact of the number of samples on
performance of different fusion methods.
5 EXPERIMENTAL SETUP
Our goal was to comparatively evaluate the perfor-
mance of the three algorithms on two datasets - our
Liunx Command dataset and the Carnegie Mellon
University (CMU) dataset. For this, we divided the
CMU data into training and testing sets with the same
size as in (Killourhy and Maxion, 2009). We ran-
Table 3: EER results of two algorithms using two different
datasets- CMU and Linux commands.
Algorithm CMU Dataset Linux Command
Scaled Manhattan Distance (0.093, 0.096) (0.140, 0.144)
New Distance Metric (0.087, 0.089) (0.281, 0.285)
domly selected 40 out of the 51 subjects as train-
ing/testing data, for 50 times. Each subject was used
as the genuine user once with all the others as im-
posters. Training made use of each subject’s first 200
feature vectors, and the remaining 200 vectors were
used as genuine test samples and first 5 samples of
every other user as imposter test samples, for a total
of 250 imposter test samples.
For our own Linux Command dataset, we ran-
domly selected 25 out of the 33 subjects as training
and testing data, for 50 times. For each subject we se-
lected first 20 feature vectors as genuine training sam-
ples. The remaining 30 feature vectors were used as
genuine testing samples, and the first one sample from
each of the remaining 32 subjects was used to form 32
imposter testing samples.
After that, we used the three algorithms for these
two datasets to calculate both genuine scores and im-
poster scores, which were used to plot ROC curves
(Receiver Operating Characteristic) and obtain the fi-
nal Equal Error Rate (EER). EER is a commonly used
error rate to evaluate the classification performance in
keystroke dynamics. In order to obtain a reliable es-
timation of performance, we tested each algorithm 50
times and calculated the 95% confidence interval of
the EER values.
6 RESULTS & DISCUSSION
After testing the three different algorithms mentioned
earlier for both CMU and Linux Command datasets,
the results for Scaled Manhattan distance and new
distance metric are shown in Table 3, and the fusion
method results of the two datasets are shown in Table
4 and Table 5.
Table 3 shows the average performance across all
subjects in each dataset. In addition, we also gener-
ated sample ROC curves for Scaled Manhattan dis-
tance and new distance metric method, respectively,
showing two subjects who have the best EER perfor-
mance and two subjects who have the worst EER per-
formance. Figures 3 and 4 show the ROCs for the
Linux Command dataset and CMU dataset, respec-
tively, complementing the result in Table 3.
The fusion method by using the minimal (min)
ICPRAM 2024 - 13th International Conference on Pattern Recognition Applications and Methods
898
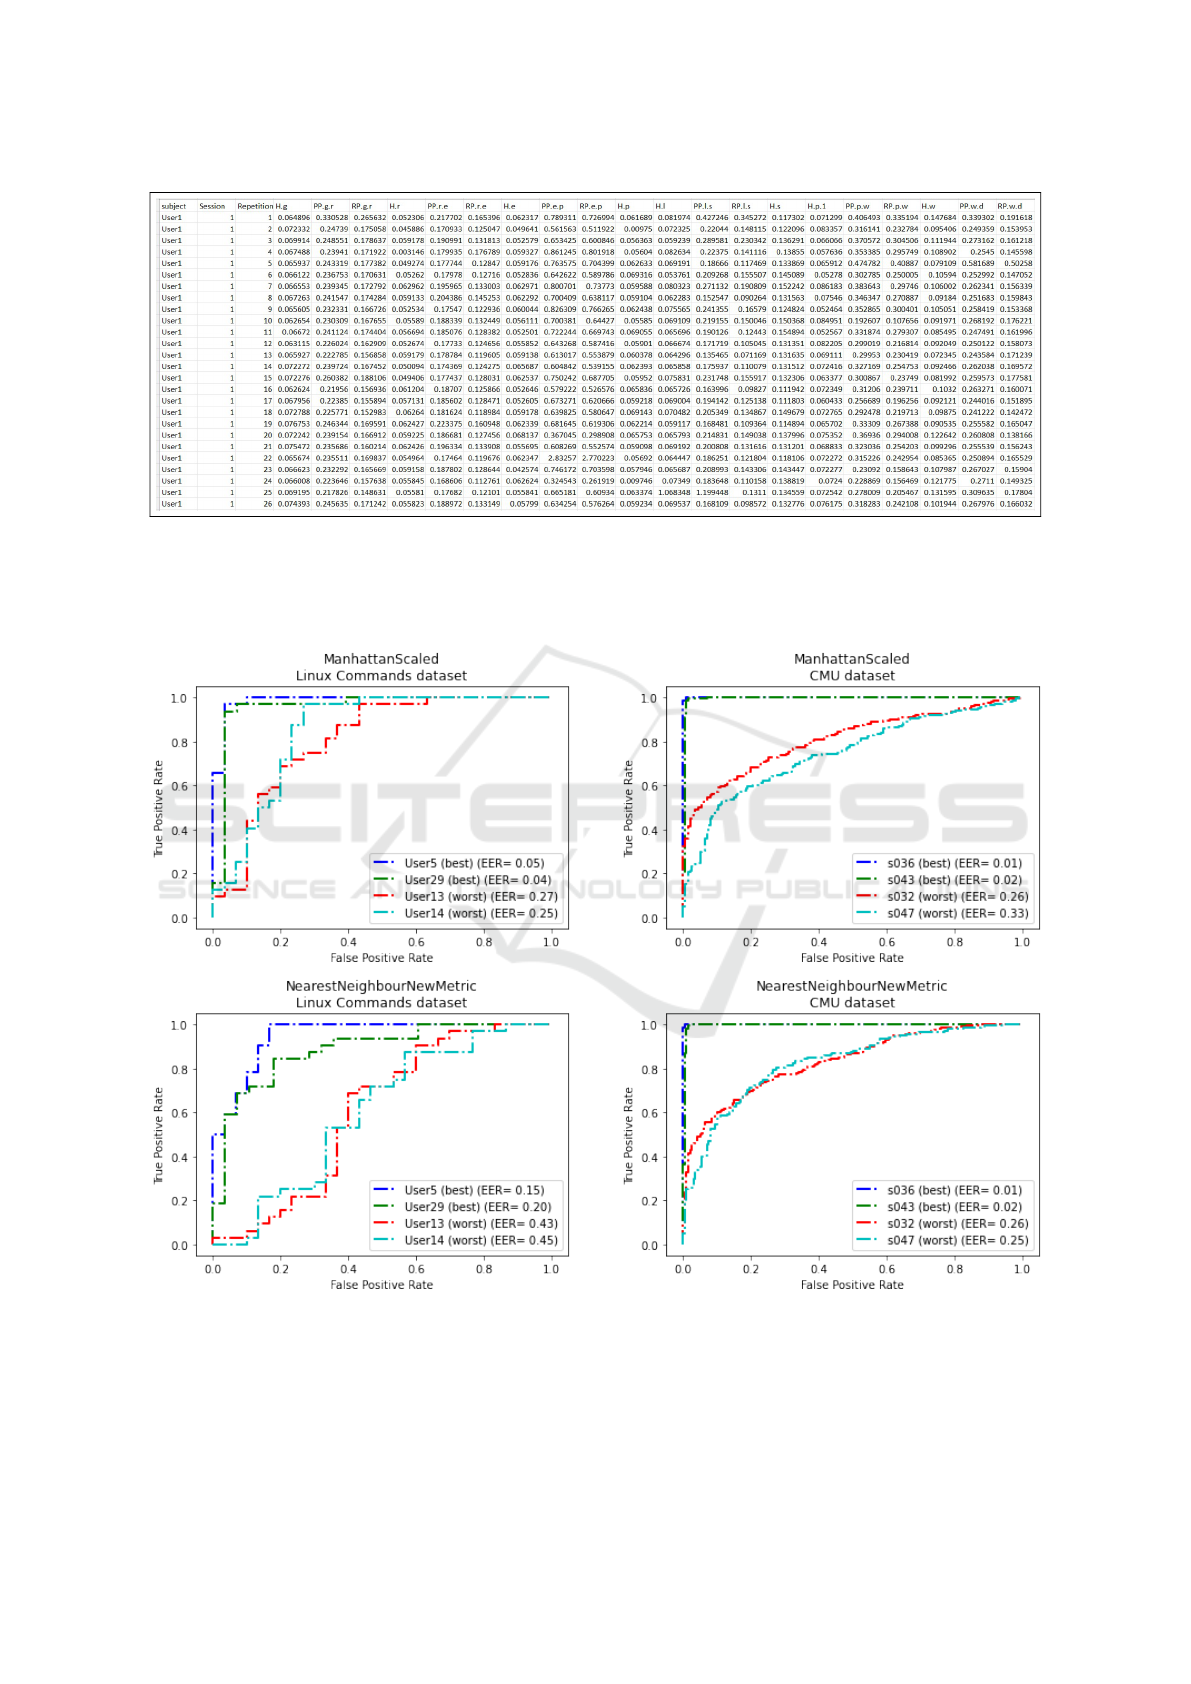
Figure 2: CSV file containing all the timing features of a user. The first, second, and third columns show the index of the
subject, the session number, and the number of attempt in the corresponding session, respectively. The later columns show all
the timing features. Here, H.g means hold time of ‘g’ and PP.g.r means time difference between key press time of ‘r’ and key
press time of ‘g’. Similarly RP.g.r indicates time difference between key press time of ‘r’ and key release time of ‘g’. All the
timing values are in second.
Figure 3: ROC curves for Scaled Manhattan Distance (top)
and New Distance Metric (bottom), on Linux Command
Dataset, with two subjects who have the best EER and two
subjects who have the worst EER.
Figure 4: ROC curves for Scaled Manhattan Distance (top)
and New Distance Metric (bottom), on the CMU Dataset,
with two subjects who have the best EER and two subjects
who have the worst EER.
A Novel Keystroke Dataset for Preventing Advanced Persistent Threats
899

Table 4: EER results of three fusion methods (minimum,
maximum and mean) for new distance metric with 2-5 sam-
ples per fusion for the Linux command dataset.
Samples Min Max Mean
1 (0.281, 0.285) (0.281, 0.285) (0.281, 0.285)
2 (0.181, 0.186) (0.283, 0.289) (0.214, 0.220)
3 (0.097, 0.104) (0.322, 0.335) (0.198, 0.209)
4 (0.062, 0.069) (0.332, 0.347) (0.182, 0.192)
5 (0.038, 0.044) (0.362, 0.379) (0.202, 0.219)
Table 5: EER results of three fusion methods (minimum,
maximum and mean) for new distance metric with 2-5 sam-
ples per fusion for the CMU dataset.
Samples Min Max Mean
1 (0.087, 0.089) (0.087, 0.089) (0.087, 0.089)
2 (0.053, 0.055) (0.082, 0.085) (0.058, 0.061)
3 (0.045, 0.047) (0.080, 0.082) (0.043, 0.045)
4 (0.034, 0.037) (0.077, 0.079) (0.034, 0.036)
5 (0.027, 0.031) (0.090, 0.092) (0.038, 0.040)
score of several samples at one time as the final score
has a productive influence on the performance of both
CMU dataset and Linux Command dataset. More-
over, the fusion method improved the EER more for
the Linux Command dataset than the CMU dataset.
The confidence interval of EER changed from (0.281,
0.285) to (0.038, 0.044) in the case of Linux Com-
mand dataset and from (0.087, 0.089) to (0.027,
0.031) in the case of CMU dataset. The maximal
(max) score fusion method used the highest score of
several samples, and its EER was the worst in all three
methods for both datasets. The mean score fusion
method used the average score of the multiple sam-
ples and was in the middle position in terms of EER.
Due to the small size of our Linux Command
dataset, the EER results were not as good as those
of the CMU dataset. However, our dataset is the first
dataset containing Linux command keystrokes and it
has the 95 percent probability that the EER value fol-
lowing in (0.038, 0.044). This shows the quality of
our dataset to authenticate the system administrators
and prevent APT.
In Table 3, we can see that new distance metric
performs better than the Scaled Manhattan distance
with CMU dataset. However, in the case of our own
Linux Command dataset, new distance metric does
not perform better than the Scaled Manhattan dis-
tance. We hypothesize that this is due to relatively
small training set for the Linux Command dataset (20
samples). To investigate, we rerun the CMU exper-
iment with the same amount of training data as in
the Linux dataset (20 samples). As a result, the con-
fidence interval of EER with Scaled Manhattan dis-
tance method changed from (0.093, 0.096) to (0.087,
0.090) and the EER of new distance metric method
increased from (0.087, 0.089) to (0.219, 0.223). This
result confirmed our earlier hypothesis that the small
enrollment profile size causes the poor performance
of the new distance metric. This would also indicate
that the new distance metric is more ‘data hungry’
than the Scaled Manhattan distance.
Our Linux command dataset has only 50 samples
per user. To further investigate the impact of data size,
we asked two of the original volunteers to increase
their data samples to 400 for the list of Linux com-
mands, the same amount as in the CMU dataset. Us-
ing the new data, we calculated the EER for those two
subjects. The EER values for Scaled Manhattan dis-
tance are 0.067 and 0.090, and for new distance metric
are 0.107 and 0.177. We observe that using a large en-
rollment profile improves the EER performance more
for the new distance metric than the Scaled Manhattan
distance method.
7 CONCLUSION
Our experiments evaluated and compared the perfor-
mance of our Linux Command dataset with that of the
CMU dataset. The new distance metric performs bet-
ter than Scaled Manhattan distance detector for CMU
dataset. In the case of our Linux Command dataset,
without fusion, the new distance metric does not im-
prove the Equal Error Rate over the Scaled Manhat-
tan distance, probably due to the limited amount of
keystroke data. However, introducing fusion methods
to the new distance metric solves this problem. The
fusion method has also improved the EER for CMU
dataset. In all three fusion methods, using a minimum
score to generate one final matching score from sev-
eral samples yields the best performance.
Increasing the enrollment profile size for two spe-
cific users in Linux Command dataset seem to have
improved the performance of the Scaled Manhattan
distance less than the new distance metric. The rea-
son appears to be that the new distance metric is more
sensitive to data size for performance.
As future work, we plan to enlarge our Linux
Command dataset with more subjects and with more
ICPRAM 2024 - 13th International Conference on Pattern Recognition Applications and Methods
900

samples per subject. We shall also investigate more
efficient algorithms to improve the performance. We
hypothesize that by fusion of command lines and
keystroke dynamics, we will significantly improve
the performance of intrusion detection. Lastly, we
plan to field-test the effectiveness of this method in
preventing and detecting advanced persistent threats
(APT) (NIST, 2012).
ACKNOWLEDGMENTS
This work were partially supported by NSF Award
CNS-1650503. Wang, Hou, and Schuckers were also
supported by NSF Award TI-2122746.
REFERENCES
Araujo, L. C., Sucupira, L. H., Lizarraga, M. G., Ling,
L. L., and Yabu-uti, J. B. (2004). User authentica-
tion through typing biometrics features. In Biometric
Authentication: First International Conference, ICBA
2004, Hong Kong, China, July 15-17, 2004. Proceed-
ings, pages 694–700. Springer.
Banerjee, S. and Woodard, D. (2012). Biometric authenti-
cation and identification using keystroke dynamics: A
survey. Journal of Pattern recognition research.
Chandran, S., Hrudya, P., and Poornachandran, P. (2015).
An efficient classification model for detecting ad-
vanced persistent threat. In 2015 international confer-
ence on advances in computing, communications and
informatics (ICACCI), pages 2001–2009. IEEE.
CISA: Cyber & Infrastructure Security Agency (2023a).
Advanced persistent threats and nation-state actors–
helping cybersecurity defenders protect against and
respond to apts. [Online]. Available: CISA APT
(2023), https://www.cisa.gov/topics/cyber-threats
-and-advisories/advanced-persistent-threats-and-nat
ion-state-actors.
CISA: Cyber & Infrastructure Security Agency (2023b).
People’s republic of china state-sponsored cyber ac-
tor living off the land to evade detection. [Online].
Available: Volt Typhoon (2023), https://www.cisa.g
ov/news-events/cybersecurity-advisories/aa23-144a.
DOJ (2023a). Chinese Military Personnel Charged
with Computer Fraud, Economic Espionage and Wire
Fraud for Hacking into Credit Reporting Agency
Equifax. [Online]. Available: DOJ Equifax Indict-
ment (2020), https://www.justice.gov/opa/pr/chine
se-military-personnel-charged-computer-fraud-eco
nomic-espionage-and-wire-fraud-hacking.
DOJ (2023b). U.S. Charges Russian FSB Officers and Their
Criminal Conspirators for Hacking Yahoo and Mil-
lions of Email Accounts. [Online]. Available: DOJ
Yahoo Indictment (2017), https://www.justice.gov/op
a/pr/us-charges-russian-fsb-officers-and-their-crimi
nal-conspirators-hacking-yahoo-and-millions.
Greenberg, S. (1988). Using unix: Collected traces of 168
users. University of Calgary.
Killourhy, K. S. and Maxion, R. A. (2009). Comparing
anomaly-detection algorithms for keystroke dynam-
ics. In 2009 IEEE/IFIP International Conference
on Dependable Systems & Networks, pages 125–134.
IEEE.
Maxion, R. A. (2003). Masquerade detection using en-
riched command lines. In 2003 International Con-
ference on Dependable Systems and Networks, pages
5–14. IEEE.
Maxion, R. A. and Townsend, T. N. (2002). Masquerade
detection using truncated command lines. In Proceed-
ings international conference on dependable systems
and networks, pages 219–228. IEEE.
Maxion, R. A. and Townsend, T. N. (2004). Masquerade
detection augmented with error analysis. IEEE Trans-
actions on Reliability, 53(1):124–147.
Mirza, N. A. S., Abbas, H., Khan, F. A., and Al Muhtadi, J.
(2014). Anticipating advanced persistent threat (apt)
countermeasures using collaborative security mecha-
nisms. In 2014 International Symposium on Biomet-
rics and Security Technologies (ISBAST), pages 129–
132. IEEE.
NIST (2012). NIST Special Publication 800-39 Managing
Information Security Risk. CreateSpace, Scotts Valley,
CA.
Ray-Dowling, A., Hou, D., and Schuckers, S. (2023). Sta-
tionary mobile behavioral biometrics: A survey. Com-
puters & Security, 128:103184.
Schonlau, M., DuMouchel, W., Ju, W.-H., Karr, A. F.,
Theus, M., and Vardi, Y. (2001). Computer intrusion:
Detecting masquerades. Statistical science, pages 58–
74.
Shadman, R., Wahab, A. A., Manno, M., Lukaszewski, M.,
Hou, D., and Hussain, F. (2023). Keystroke dynam-
ics: Concepts, techniques, and applications. [Online].
Available: arXiv:2303.04605, 2023.
Tschinkel, B., Esantsi, B., Iacovelli, D., Nagesar, P., Walz,
R., Monaco, V., and Bakelman, N. (2017). Keylog-
ger keystroke biometric system. [Online]. Available:
Research Gate (2017).
Vural, E., Huang, J., Hou, D., and Schuckers, S. (2014).
Shared research dataset to support development of
keystroke authentication. In IEEE International joint
conference on biometrics, pages 1–8. IEEE.
Wahab, A. A., Hou, D., Schuckers, S., and Barbir, A.
(2021). Utilizing keystroke dynamics as additional
security measure to protect account recovery mech-
anism. In ICISSP, pages 33–42.
Zhong, Y., Deng, Y., and Jain, A. K. (2012). Keystroke
dynamics for user authentication. In 2012 IEEE com-
puter society conference on computer vision and pat-
tern recognition workshops, pages 117–123. IEEE.
A Novel Keystroke Dataset for Preventing Advanced Persistent Threats
901
