
Particle and Cell Cluster Separation Based on Inertial Effects in
Rectangular Serpentine Channels
Michal Mul
´
ık
a
and Ivan Cimr
´
ak
b
Cell-in-fluid Biomedical Modelling & Computations Group, Faculty of Management Science and Informatics,
University of
ˇ
Zilina, Slovakia
Keywords:
Microfluidics, Inertial Flow, Clusters, PyOIF, ESPResSo, Separation.
Abstract:
It is well-established that the inertial effect in microfluidics has a significant impact on particle and cell cluster
separation. The outcomes are particularly dependent on the channel geometry and the particle and cell sus-
pensions introduced into the channel. In this study, we investigate various combinations related to the size of a
curved channel, fluid velocity, and the size and elasticity of clusters. We quantitatively and qualitatively eval-
uate the behavior of the examined clusters with respect to separation potential. Computational results suggest
specific combinations of flow parameters leading to efficient particle and cell cluster separation.
1 INTRODUCTION
Under specific microflow conditions, fluid inertia
dominates over viscous forces, allowing precise con-
trol and manipulation of suspended particles (Hood
et al., 2015). This has led to the development of tech-
niques to sort and separate particles based on size,
shape and deformability (Xu et al., 2021; Nivedita
et al., 2017; Liu et al., 2019; Warkiani et al., 2014).
Meandering channels induce complex flow patterns
and particle behavior due to inertial effects of (Xiang
and Ni, 2022). Experimental studies, such as (Tri-
pathi et al., 2016) generating four Dean vortices with
two bends and (Zhang et al., 2014) focusing on high-
throughput plasma extraction using a secondary flow-
assisted inertial microfluidic device, further investi-
gate these phenomena.
The inertial migration of particles was further ex-
plored in the work (Bug
´
a
ˇ
nov
´
a and Cimr
´
ak, 2023),
which focused on solid particles and their separation
in curved channels of rectangular shape. It was ob-
served that as the particles increase in size, they tend
to concentrate and stabilize more in the center of the
channel. This leaves a significant space for smaller
particles, which concentrate along the edges of the
channel, facilitating successful separation. The re-
sults demonstrate that not only are smaller cells capa-
ble of separating from larger ones, but in some cases,
a
https://orcid.org/0000-0001-5592-4524
b
https://orcid.org/0000-0002-0389-7891
they even leave the center of the channel completely
empty for a third type of even larger cells. This phe-
nomenon provides an intriguing possibility for triple
separation.
Over time, microfluidics has undergone signifi-
cant breakthroughs and clarifications, allowing for a
deeper exploration of phenomena and the continued
pursuit of answers to various questions. One such av-
enue includes the potential opportunity to leverage in-
ertial effects in bio-medicine or medicine in general.
In living organisms, such as the human body, iner-
tial flows are encountered, for instance, at vascular
bifurcations. The fact that cells divide and travel into
different branches provides us with a suitable oppor-
tunity to investigate where they are most likely to go.
This could enable the capture of rare cells from blood
(Tanaka et al., 2012). A similar concept is mentioned
in the article (Gossett et al., 2012), where, in the dis-
cussion of cell deformation, they were able to separate
diseased red blood cells from healthy ones or search
for sepsis markers.
In the article (Bug
´
a
ˇ
nov
´
a and Cimr
´
ak, 2023), de-
tailed information about inertial microfluidics, com-
putational models, and curved microchannels is pro-
vided. The study utilized the Lattice-Boltzmann
method, a technique also employed in our model. The
alignment of cells is correlated with the Reynolds
number, directly linked to the fluid velocity. In the
model, as the fluid velocity increases, the Reynolds
number becomes larger, leading to a more precise sta-
bilization of cells at a specific level within the chan-
Mulík, M. and Cimrák, I.
Particle and Cell Cluster Separation Based on Inertial Effects in Rectangular Serpentine Channels.
DOI: 10.5220/0012547300003657
Paper published under CC license (CC BY-NC-ND 4.0)
In Proceedings of the 17th International Joint Conference on Biomedical Engineering Systems and Technologies (BIOSTEC 2024) - Volume 1, pages 553-560
ISBN: 978-989-758-688-0; ISSN: 2184-4305
Proceedings Copyright © 2024 by SCITEPRESS – Science and Technology Publications, Lda.
553

nel. However, in the mentioned article, the discus-
sion remained focused on the level of small and solid
particles that did not have the opportunity to deform.
Our work investigates larger objects, which are under-
standably more prone to deformation. Therefore, we
have included this property in our examination.
Contents of this Work
In this study, we employed two geometries of sizes
160 × 80µm and 200 × 64µm. For the first time in the
model, we introduced rounded edges to better mimic
reality, as blood vessels in the body exhibit curvature.
We opted for larger geometries compared to those in
the article (Bug
´
a
ˇ
nov
´
a and Cimr
´
ak, 2023) since the
cells themselves and the subsequent cell clusters were
about two times larger. Consequently, we needed to
create a space where cell clusters would have greater
freedom in the flow.
In Section 2, we briefly explain inertial forces in
microflows. In Section 3, we will explore the funda-
mental types of channels commonly used in inertial
microfluidics worldwide and take a closer look at the
model we selected. Specifically, we will focus on two
channel sizes. Subsequently, we present the cell and
cell cluster model, where we utilized three sizes for
each type. Finally, we use two different values of cell
elasticity based on the well-known observation that
some cells exhibit greater deformability compared to
others when exposed to flow in S channels. In the
concluding Sections 4.1 and 4.2, we comprehensively
summarize the qualitative and quantitative results ob-
tained from our work through simulations. We expect
to gain valuable insights into the spatial distribution
of the cells over time in relation to the inertial flows,
namely Dean flows, induced by the secondary flow.
2 BASIC OVERVIEW OF
INERTIAL FOCUSING
The concentration of particles approximately 60%
away from the tube centerline in straight channels
results from a dynamic equilibrium between inertial
shear gradient lift forces, directing the particles to-
wards the wall, and wall repulsion forces generated by
elevated pressure between the particles and the chan-
nel wall (Matas et al., 2009). Modifying the channel
cross-section or introducing curvature through ser-
pentine or spiral geometries alters the distribution and
positions of lateral equilibrium, potentially expedit-
ing the lateral focusing of particles (Martel and Toner,
2014).
The forces governing this behavior encompass
three main components: the wall interaction lift
forces, the shear gradient lift forces, and the
secondary-flow induced Dean drag forces. All three
mentioned mechanisms constitute a complex system
where three different principles interact, all dependent
on the particle size, channel characteristics, fluid ve-
locity, and the elasticity of particles or cells. Compu-
tational modeling can analyze the impact under spe-
cific parameters and evaluate the sorting potential of
various suspensions.
3 MODEL AND
COMPUTATIONAL SETUP
3.1 Numerical Model
We employed a well-established computational
model capable of simulating fluid with immersed ob-
jects. In this model, the fluid is modelled by the
lattice-Boltzmann (LB) method (Arnold et al., 2013).
The cell membrane is represented by a network of tri-
angles, and their interaction is determined by elastic
coefficients, allowing us to control the magnitude of
deformation forces. In our case, we additionally re-
inforced the cell interiors with edges forming tetrahe-
dral mesh to address the high fluid velocity, which, in
a way, limits the deformation of cell clusters. More
detailed information on this can be found in the arti-
cles (Jan
ˇ
cigov
´
a et al., 2020; Jancigova and Tothova,
2014; Bachrat
´
y et al., 2018). The mentioned model
underwent verification and validation for its applica-
tion, as detailed in (Jan
ˇ
cigov
´
a et al., 2020; Jan
ˇ
cigov
´
a,
2020; Tothova et al., 2015).
3.2 Channel Geometry
In (Bug
´
a
ˇ
nov
´
a and Cimr
´
ak, 2023), the channel geom-
etry with sharp edges was used. In this work, we ex-
tended the model with rounded edges, leading to a
smoother flow of the fluid as shown in Figure 1. Due
to the periodicity of the channel, we will model only
two S-sections with periodical boundaries on the in-
flow and outflow to decrease computational complex-
ity.
Due to the significant computational demands, our
model includes only a curved section in the shape of
an ”S”, which was periodically repeated several times
until the clusters stabilized in the flow. The basic idea
depicted in Figure 2 is that particles or clusters, when
initially seeded randomly in the channel near the ob-
servation line, flow through one S-section towards a
BIOINFORMATICS 2024 - 15th International Conference on Bioinformatics Models, Methods and Algorithms
554
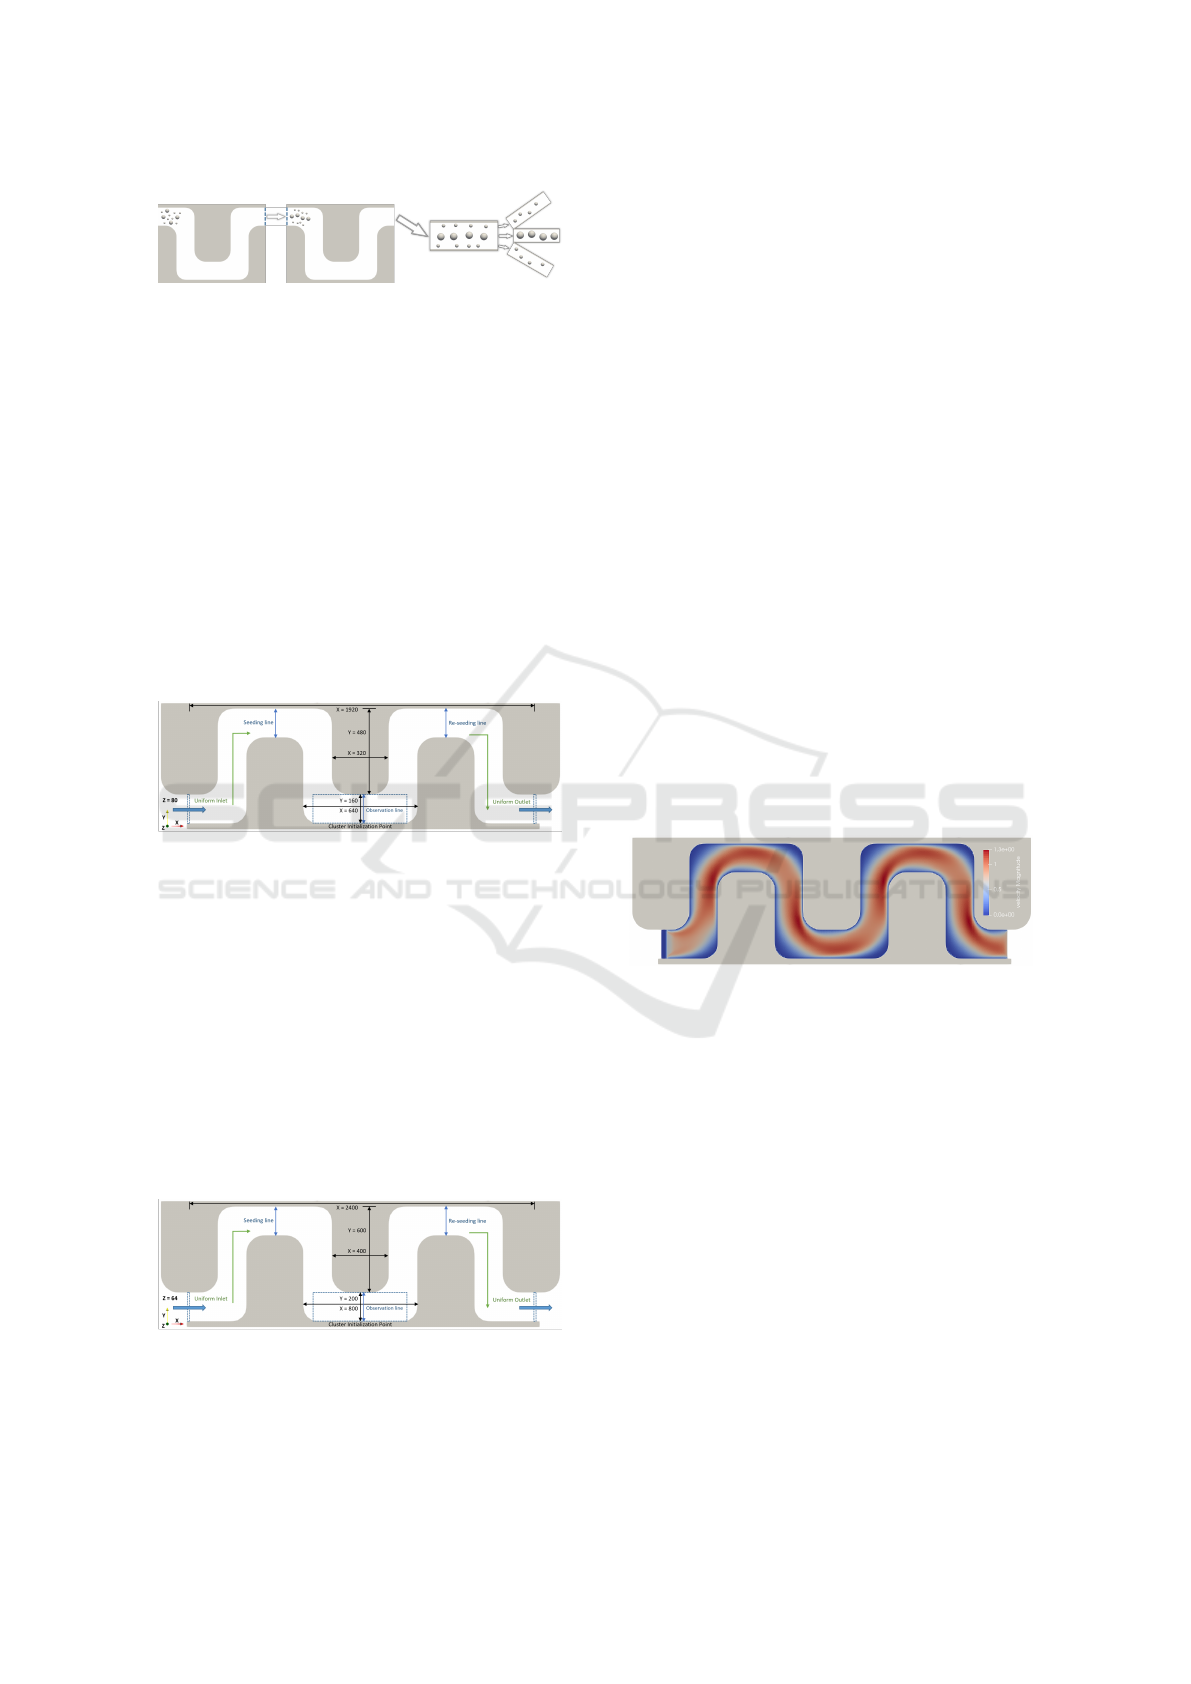
Figure 1: Separation of cells of different sizes based on the
use of a periodically repeating curved channel with round
edges in the shape of an ”S.”.
specific re-seeding line and are subsequently longi-
tudinally re-seeded back to the seeding line by al-
tering the X-coordinates while preserving the Y- and
Z-coordinates. This approach allowed us to conduct
simulations without creating an entire channel con-
sisting of 40 or 80 repeating S-sections. Moreover,
the cluster velocity in the fluid is maintained after the
transfer.
In addition to the seeding and re-seeding lines,
we also consider an observation line in the middle of
the channel. If a cluster passes through this line, we
record its center coordinates in a file. The outcome
for each cluster is then its trajectory in a graph, illus-
trating where the cluster has stabilized.
Figure 2: Detailed description of cross-section 160 × 80µm.
The orientation with respect to the X, Y, and Z axes is de-
scribed by the three-dimensional axis label in the lower-left
corner of the image.
When experimenting with different sizes of the
cross section we concluded that cell clusters need suf-
ficient space to rotate freely and for example, cross
section 80 × 40 used in (Bug
´
a
ˇ
nov
´
a and Cimr
´
ak, 2023)
is too narrow for clusters to move out of the center
of the cross section. These preliminary tests led to
choosing two different channel sizes. The dimensions
of both geometries are detailed in Figure 2 for the
cross-section 160 × 80µm and Figure 3 for the cross-
section 200 × 64µm, where all lengths are described
in micrometers.
Figure 3: Detailed description of cross-section 200 × 64µm.
The orientation with respect to the X, Y, and Z axes is de-
scribed by the three-dimensional axis label in the lower-left
corner of the image.
3.3 Fluid Set-up
The imposition of uniform boundary conditions at the
inlet and outlet serves to determine the average veloc-
ity within the channel, a factor directly proportional
to the volumetric flow rate. In the PyOIF framework,
achieving this involves implementing a specialized
velocity boundary equipped with pre-defined constant
values for the velocity field at the boundary points.
Values of the inlet conditions and the correspond-
ing Reynolds numbers are presented in Table 1.
Table 1: Fluid velocity parameters in 160 × 80µm curved
channel. Values in the other cross-section are similar.
Reynolds number [−] 19.2 37.3 48 64
Average velocity [µm/µs] 0.18 0.35 0.45 0.6
Our focus lies in examining flows within scenarios
that hold physical relevance. Specifically, we investi-
gate fluids with a density and viscosity akin to physi-
ological solutions or water, characterized by values of
1000kg/m
3
and 10
−3
Pa.s, respectively. In the sphere
of inertial microfluidics, where the Reynolds number
is a pertinent parameter, we adhere to ranges up to 100
(Ying and Lina, 2020). To encompass a diverse set of
conditions, we explore four distinct average velocities
within the channel, reaching up to 0.6 µm/µs, thereby
allowing the Reynolds number to vary up to 64.
Figure 4: The fluid flowing in the channel at the highest
Reynolds number 64. The units of the displayed scale are
in µm/µs.
A visual representation of the fluid flowing
throughout the simulation can be seen in Figure 4.
The more saturated red color, the higher the fluid ve-
locity at that location. Flow direction is from left to
right. The areas with deep blue indicate almost zero
fluid velocity.
3.4 Cell and Cluster Models
Similar to the membrane model of red blood cells
composed of triangular mesh, the cluster model is
composed of a tetrahedral mesh. Given the presence
of stiffer cancer clusters, we reinforced the cell’s in-
terior with additional edges forming complete cover
of cell’s interior by tetrahedrons to restrict excessive
deformation due to the high fluid velocity in the sim-
ulation. The edges of tetrahedrons are modelled as
Particle and Cell Cluster Separation Based on Inertial Effects in Rectangular Serpentine Channels
555
springs with given relaxed length and specific stiff-
ness. To get stiffer cells or clusters, higher values of
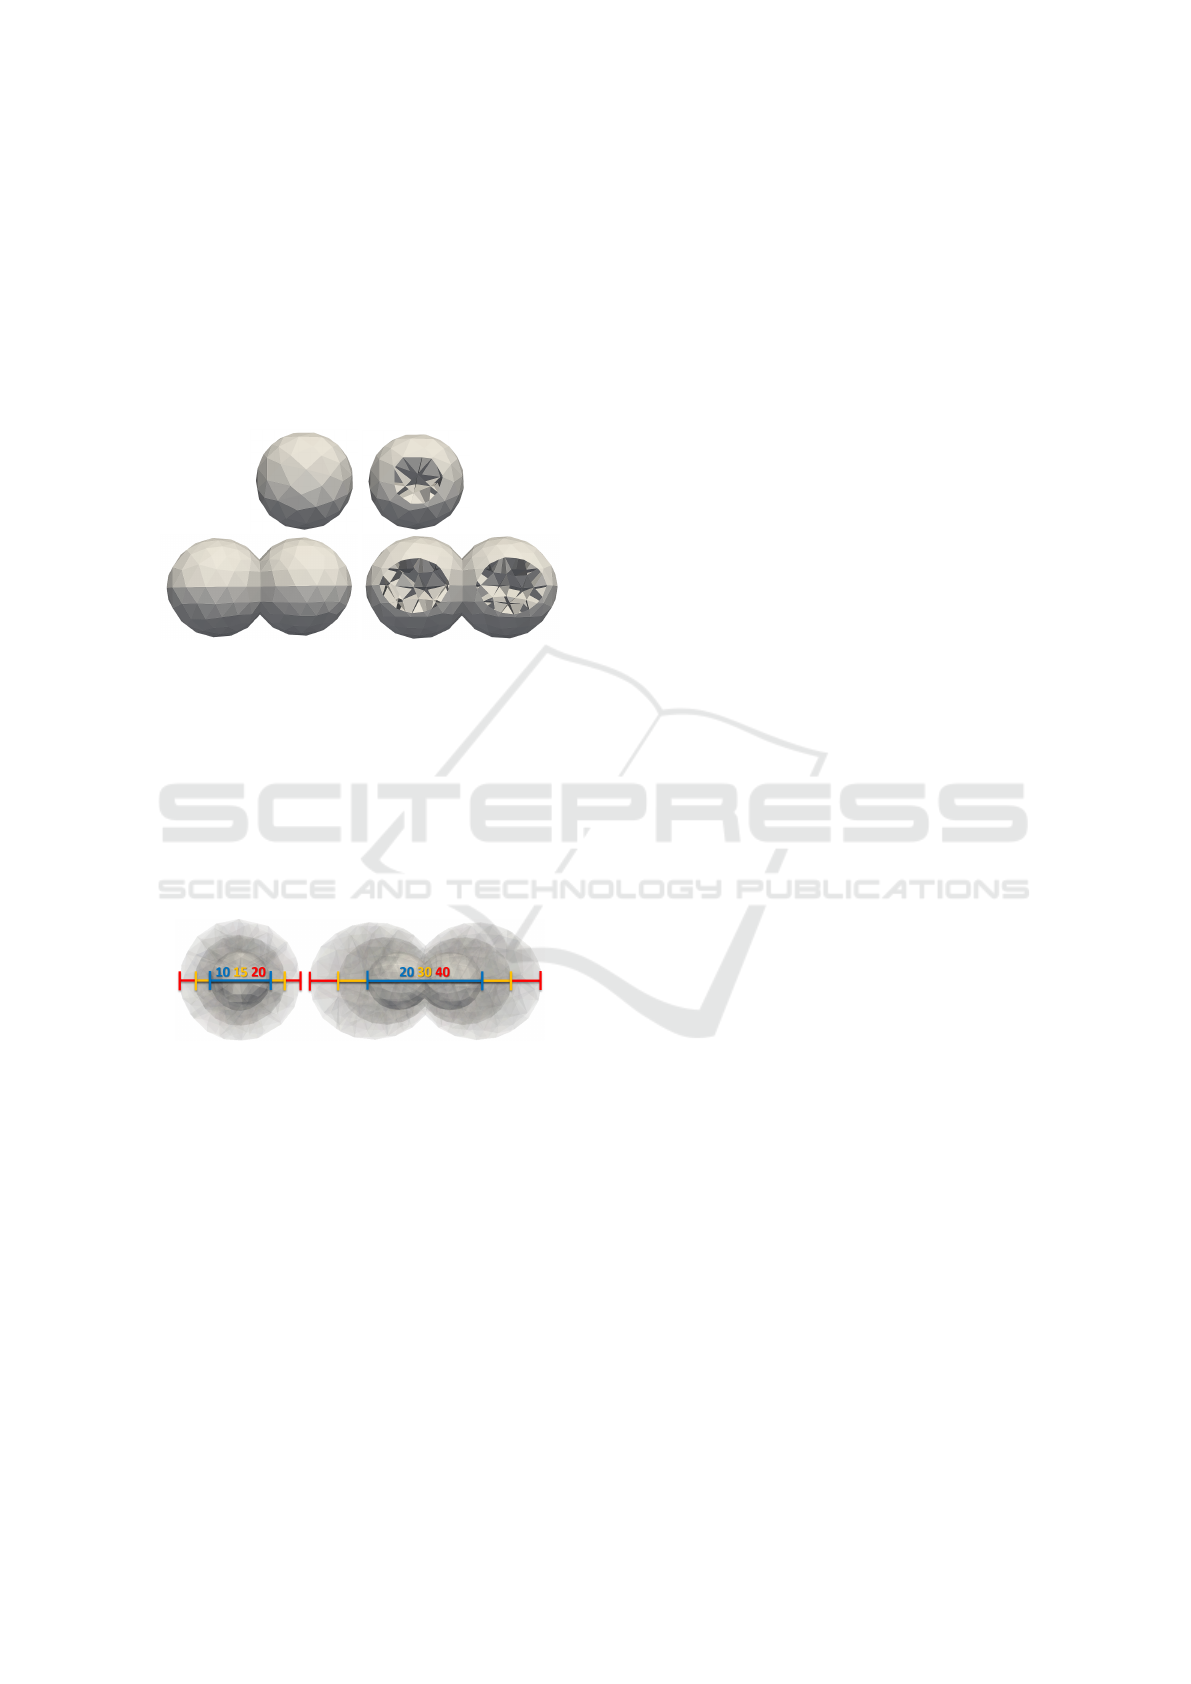
edge stiffness was used. In Figure 5, the interiors of a
single cell and a cluster are depicted, respectively.
As a model for cancer cells, we opted for a spher-
ical shape as it closely approximates the morphology
of most real types of cancer cells within the body. The
length of tetrahedral edges was primarily determined
by the size of the object, as the number of points in
the tetrahedral network remained constant.
Figure 5: The entire cell (top left), cutaway of the cell (top
right), the entire cluster (bottom left) and a cutaway of the
cluster (bottom right). The cuts reveal the interiors filled
with walls.
Based on the actual sizes of cancer cell clusters,
we determined three basic sizes for a cluster with a
single cell and three for a cluster with two cells. On
closer inspection, in one case, the size of a single cell
is even equal to that of two cells placed side by side.
A comparison of sizes for clusters containing one or
two cells is illustrated in Figure 6.
Figure 6: The cluster containing a single cell (left), and the
cluster with two cells (right). Sizes are given in microme-
ters.
The cell adhesion in a cluster can be simulated in
two different ways. One way is to use an attractive-
repulsive Lennard-Jones or Morse-type interaction,
where two separate cells are attracted to each other
when they are far apart and repelled when they are
too close. This approach ensures that cells can slide
past each other, and at high fluid velocities, it may
lead to their separation. However, the fluid velocity
we use almost always separates these cells, making it
an unsuitable method.
Another way for cells to be connected in a cluster
is by such a strong bond that cells do not slide over
each other and the bond is fixed. To simulate this
behavior, we used the second method of connecting
cells through a shared membrane. In this case, the en-
tire cluster behaves as one object. As seen in Figure 6
on the right, the cluster contains two connected cells.
These methods that help us simulate the cell adhesion
in a cluster are described in more detail in the article
(Jan
ˇ
cigov
´
a et al., 2022).
4 COMPUTATIONAL RESULTS
In this section, we will delve into the results of sim-
ulations in an S-shaped curved channel. In this case,
we utilized a single basic cluster of two cells (here-
inafter referred to as the ”two-in-line” cluster). How-
ever, technically, we will also treat a single cell as
a cluster of cells composed of only one cell, which
we now refer to as ”CTC”, an acronym for ”circu-
lating tumour cell”. For each cluster type, we will
distinguish three different sizes concerning the diam-
eter. For the two-in-line cluster we used diameters of
20, 30, and 40 µm, meaning that one cell in the two-
in-line cluster had a diameter of 10, 15, and 20 µm.
For the single-cell cluster, we aimed to approach its
largest size to the smallest two-in-line cluster, so we
chose the same diameters of 10, 15, and 20 µm. The
sizes of clusters were chosen based on the article (An-
derson et al., 2017).
In addition to the cluster type and size, we incor-
porated the elasticity of the cell. Clusters were di-
vided into more and less elastic ones under the names
”solid” and ”elastic”. Solid clusters represented the
stiffest cells that had almost no possibility of defor-
mation during flow in the channels, while elastic ones
had the ability to deform. It should be noted that both
types of clusters had an internal fill, so we will talk
about one important and only used elastic parameter
called k
s
, which represents the edge stiffness. The dif-
ference between elastic cluster with k
s
= 0.5 and solid
cluster with k
s
= 1.0 can be seen in Figure 7. Top
row depicts clusters close to the channel center with
low shear rates. This implies minimal deformation of
the clusters. The second row depicts clusters at po-
sitions near the wall with high shear rates, leading to
significant deformation of more elastic cluster while
the solid one remains fairly rigid. The simulations in
Figure 7 were conducted at Re = 64.
As mentioned before, we conducted simulations
with four fluid velocities corresponding to four values
of Reynolds number, as indicated in Table 1. For com-
pleteness, it should be noted that we used two differ-
ent channel sizes with cross-sections of 160 × 80µm
and 200 × 64µm. Further details about individual
channel geometries are already described in Section
3.2.
BIOINFORMATICS 2024 - 15th International Conference on Bioinformatics Models, Methods and Algorithms
556

Figure 7: The deformation of a two-in-line cluster with k
s
=
0.5 (left column) and k
s
= 1.0 (right column). Deformation
at low shear rates depicted in top row and at high shear rates
in bottom row.
The initial seeding line for generating cluster posi-
tions is delineated in Figures 2 and 3. Distinct random
positions for clusters were generated for each geom-
etry. Additionally, the initial rotation of clusters was
randomized for each geometry, given the absence of
a clear explanation regarding whether the initial ro-
tation significantly influences simulation outcomes.
As these are simple clusters composed of one or two
cells, we did not attribute significant emphasis to this
aspect.
All numerical results were subsequently repre-
sented by graphs, facilitating comparisons. In the fol-
lowing Subsections 4.1 and 4.2, we will present the
most useful comparisons.
4.1 Quantitative Analysis of Flow
Patterns
From a quantitative perspective, we focused on ana-
lyzing data obtained from simulations, categorizing
it into five parts for better clarity: channel geome-
try, fluid velocity, cluster type, cluster size, and clus-
ter elasticity, in that order. All results were primarily
compared in terms of the separation of different clus-
ters, where the main role was played by inertial flow,
specifically the Dean effect.
For a general overview, each simulation included
28 clusters of cells. The simulation ran until each
cluster crossed the observation line 40 times. How-
ever, it should be noted that especially at the highest
fluid velocity Re = 64 and channel size of 160 × 80µm
with CTCs, we concluded that they did not have
enough time to stabilize within 40 passes. Therefore,
we increased the number of passes to 80 for them to
stabilize more effectively within the flow. For com-
parison, you can refer to Figure 8, where a signifi-
cant difference between 40 and 80 passes is evident.
For all subsequent comparisons in graph form, results
from 80 passes were used.
For quantitative analysis, Figure 9 serves us the
most, where it is clearly visible that in some cases,
clusters can linger near the channel walls, creating
space in the middle of the channel for other clusters
that can be separated from the other lateral clusters.
4.1.1 Analysis of CTCs
At first glance, CTCs in graphs (C), (D), (G), and (H)
seem to linger the most on the sides of the channel.
The only differences are the solid and elastic CTCs in
graphs (C) and (D) for the geometry of 160 × 80µm,
fluid velocity Re = 64, and a diameter of 20µm, which
linger more in the middle of the channel. Based on the
obtained information, we can infer that they can be
separated from the smallest CTCs with a diameter of
10µm. It should be mentioned that in the (H) graph,
the largest CTCs at the slowest speed are scattered
across the entire width. This result is due to the small
number of passes, as the cells have not yet had time
to settle. For a better understanding, we can observe
the changes in the ongoing settling in Figure 10.
4.1.2 Analysis of Two-in-Line Clusters
In the case of two-in-line clusters, the behavior in
the flow is not that straightforward. The trend for
the largest clusters remains consistent with single-cell
clusters, settling in the center of the channel. The only
instances where they concentrate at the channel edges
occur at the highest velocity, Re = 64, and a geom-
etry of 160 × 80µm, as seen in graphs (A) and (B)
in the last columns marked in red. Conversely, the
smallest two-in-line clusters marked in blue tended to
settle regularly at the channel edges. Exceptions are
specific cases, as observed in graphs (B) and (C) at
Re = 48 and graph (F) at Re = 19.2.
Medium-sized two-in-line clusters marked in yel-
low generally behaved similarly to two-in-line clus-
ters, except for isolated cases observed in graphs (A)
and (E), where the settling level coincided with the
smallest two-in-line clusters. From the analysis, it
can be inferred that there is a possibility of separat-
ing two-in-line clusters from other two-in-line clus-
ters based on their sizes, as seen in the mentioned
graph (E) at all fluid velocities or at specific fluid ve-
locities in graphs (A), (B), or (F).
An interesting aspect is that for two-in-line clus-
ters, elasticity plays a role for the first time, as we
could potentially separate clusters with diameters 20
Particle and Cell Cluster Separation Based on Inertial Effects in Rectangular Serpentine Channels
557
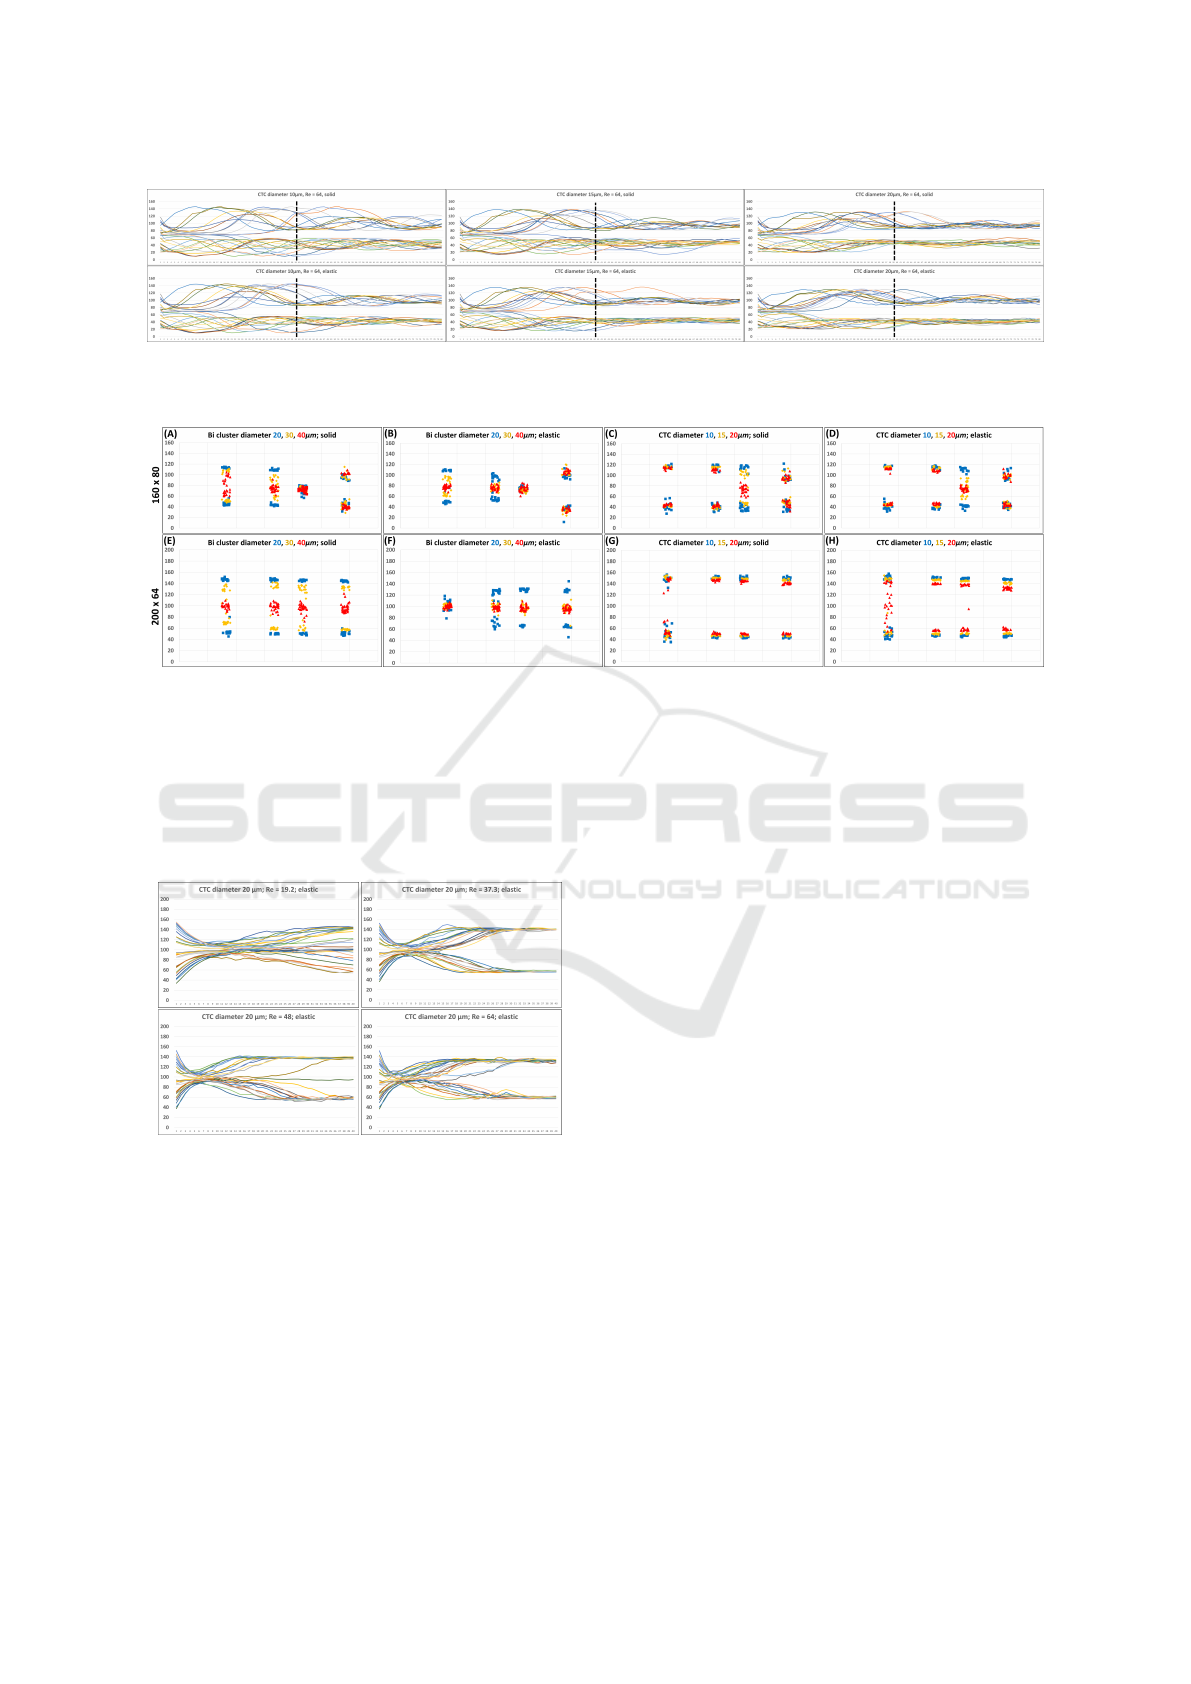
Figure 8: Examples of a cluster formed by CTCs with a diameter of 10, 15 and 20µm, solid and elastic type, at a cross-section
of 160 × 80µm.The Y-axis represents the channel width, and the X-axis represents the number of passes. The dashed line
indicates the state after 40 passes through the channel.
Figure 9: Complete set of 96 simulations, where each graph contains exactly 12 of them. Each graph has 4 columns for 4
values of Reynolds number mentioned in Table 1 from the smallest to the largest from left to right. Each column has results
from three simulations, differing in the cluster size. Regarding the legends, blue squares represent the smallest clusters, yellow
diamonds represent medium-sized clusters, and red triangles represent the largest clusters. In general, these are analogously
transformed graphs from 8 into a concise form for better visualization, where data were taken only from the last passage of all
cells in the simulation. All graphs indicate the locations where cell clusters stabilized. The first row of graphs A-D denotes the
last passage of cells from channels with cross-section 160 × 80µm, and the second row E-H with cross-section 200 × 64µm.
Graphs (A), (B), (E), and (F) represent the stabilization of two-in-line clusters, and graphs (C), (D), (G), and (H) of CTCs.
Regarding the elasticity of clusters, graphs (A), (C), (E), (G) are solid, and (B), (D), (F), and (H) are elastic.
Figure 10: The graphs represent the settling of elastic CTCs
over 40 passes, ranging from the slowest fluid speed, where
Re = 19.2, to the fastest, where Re = 64. In this case, a
cross-section of 200 × 64µm was used, and the cells were
elastic.
and 30µm, that have different elasticity. This phe-
nomenon can be observed, for example, by comparing
graphs (E) and (F) at the lowest velocity Re = 19.2 in
case of the smallest clusters, and at all velocities in
case of medium-sized clusters, where solid clusters
concentrate on the sides of the channel, and elastic
clusters in its center.
4.1.3 Comparison Between CTC and
Two-in-Line Cluster
When comparing the same geometries but different
clusters, namely CTC and two-in-line clusters, we
come to the conclusion that separation is also possi-
ble under certain conditions. Considering the first row
of graphs with the 160 × 80µm geometry, the smallest
two-in-line clusters with a diameter of 20µm in graphs
(A) and (B) could be separated from CTC in graphs
(C) and (D) with a diameter of 10µm, for example,
at a fluid velocity of Re = 48. This is because CTC
would again stabilize at the sides of the channel, while
two-in-line clusters would stabilize in the center.
The same case applies to medium-sized and the
largest two-in-line clusters with diameters of 30 and
40µm. However, the largest two-in-line clusters at a
fluid velocity of Re = 37.3 could be separated from
any size of CTC. The same applies to Re = 19.2 and
elastic two-in-line clusters. However, the geometry
200 × 64µm, which provides more space for cell sta-
bilization at the sides of the channel due to its wider
width, offers a more obvious separation possibility.
For the smallest elastic two-in-line cluster in graph
(F), there is an opportunity for separation at the slow-
BIOINFORMATICS 2024 - 15th International Conference on Bioinformatics Models, Methods and Algorithms
558

est fluid velocity of Re = 19.2 from any size of CTC in
graphs (G) and (H). In this case, the separation possi-
bility for elastic CTC would depend on the number of
passes. The same applies when considering medium-
sized and elastic two-in-line clusters in graph (F),
where the separation is possible regardless of the fluid
velocity Re chosen. However, the largest two-in-line
clusters could probably be separated most effectively
from any size of CTC, as it is independent of both
elasticity and fluid velocity.
4.2 Qualitative Analysis of Flow
Patterns
From a qualitative perspective, we observed the flow
of CTC and two-in-line clusters in the 160 × 80µm
channel. The movement of a single solid two-in-line
cluster can be seen at the highest velocity in Figure
11, depicting the cluster’s movement in three consec-
utive S-sections. The cluster’s motion was recorded
after approximately 20 passes, indicating a steady
flow.
At first glance, collisions with the wall can be ob-
served at each upper right turn. Two-in-line clusters,
in general, do not have a reason to rotate around their
center. Nevertheless, during gentle shear flow gener-
ated by collisions and movement along the wall, the
cluster tends to rotate around its own center a few
times in succession. This rotation involves a change
in the order of cells, with the most pronounced ro-
tations occurring during the first two upper turns, as
the cluster is aligned longitudinally along the X-axis.
In the third turn, where the cluster is aligned width-
wise, this rotation type does not occur. In this case,
the cluster appears to rotate like a wheel.
It is important to note that collisions of CTC and
clusters with walls are not entirely safe from a hu-
man health perspective. Further information on the
interactions of clusters with walls can be found in the
article (Jan
ˇ
cigov
´
a et al., 2022).
Figure 11: Three S-shaped channel passes of the largest
solid two-in-line cluster in the geometry of 160 × 80µm at
the highest velocity of Re = 64. One cell out of two is
marked in red to better observe the movement, especially
the rotation of each cell in the cluster.
5 CONCLUSION
The basis of the work was derived from the princi-
ples of inertial flows, namely Dean flows. Thanks
to them, we could observe how clusters, after several
passes through the channel, slowly stabilized either
in the center or at the edges of the channel. This
phenomenon allowed us to study the separation of
cell clusters, which depended on their properties or
the properties of the surrounding environment in the
model in which we released them.
Initially, we worked on a model of a microflu-
idic channel in an S shape, which had rounded edges
for simpler fluid flow. As a next step, we created
new channel geometry sizes with dimensions of 160×
80µm and 200 × 64µm to provide more space for the
stabilization of cell clusters.
We focused mainly on studying a simple cluster
formed from a single cell, also known as CTC, and
a two-in-line cluster formed from two cells. Fluid
was released at four different velocities expressed by
the Reynolds number Re = 19.2,37.3,48, and 64, in
which we released clusters with three different cell
diameters, 10, 15, and 20µm. These clusters also had
two different elasticities, so some were solid, where
k
s
= 1.0, and others were elastic, for which k
s
= 0.5,
meaning they had more opportunity to deform during
the simulation than solid ones.
As for the computational complexity of each sim-
ulation, each one ran for 3 to 7 days until each clus-
ter in the simulation had a certain number of passes.
Mostly, it was 40 passes. In a specific case where it
took longer for the clusters to stabilize, we increased
the number of passes to 80.
The obtained numerical data of cluster positions
were analyzed from each simulation using appropri-
ate graphs. We summarized and combined all the
graphs, where it was very well visible which clusters
stabilized at the edges of the channel and which, on
the contrary, more in its central part with respect to
the channel height, i.e., the Y-axis. For some combi-
nations of sizes and elasticity of CTC and clusters, we
found that separation would be highly probable.
ACKNOWLEDGEMENTS
This research was supported by the Ministry of Ed-
ucation, Science, Research and Sport of the Slovak
Republic under the contract No. VEGA 1/0369/22.
Particle and Cell Cluster Separation Based on Inertial Effects in Rectangular Serpentine Channels
559

REFERENCES
Anderson, K. J., de Guillebon, A., Hughes, A. D., Wang,
W., and King, M. R. (2017). Effect of circulating
tumor cell aggregate configuration on hemodynamic
transport and wall contact. Mathematical biosciences,
294:181–194.
Arnold, A., Lenz, O., Kesselheim, S., Weeber, R., Fahren-
berger, F., Roehm, D., Ko
ˇ
sovan, P., and Holm, C.
(2013). ESPResSo 3.1: Molecular dynamics soft-
ware for coarse-grained models. In Meshfree Methods
for Partial Differential Equations VI, Lecture notes in
computational science and engineering, pages 1–23.
Springer Berlin Heidelberg, Berlin, Heidelberg.
Bachrat
´
y, H., Bachrat
´
a, K., Chovanec, M., Kaj
´
anek, F.,
Smie
ˇ
skov
´
a, M., and Slav
´
ık, M. (2018). Simulation
of blood flow in microfluidic devices for analysing of
video from real experiments. In Bioinformatics and
Biomedical Engineering, Lecture notes in computer
science, pages 279–289. Springer International Pub-
lishing, Cham.
Bug
´
a
ˇ
nov
´
a, A. and Cimr
´
ak, I. (2023). Computational study
of particle separation based on inertial effects in rect-
angular serpentine channels with different aspect ra-
tios. In Proceedings of the 16th International Joint
Conference on Biomedical Engineering Systems and
Technologies (BIOSTEC 2023) - Volume 3: BIOIN-
FORMATICS, pages 284–291. INSTICC, SciTePress.
Gossett, D. R., Tse, H. T. K., Lee, S. A., Ying, Y., Lindgren,
A. G., Yang, O. O., Rao, J., Clark, A. T., and Di Carlo,
D. (2012). Hydrodynamic stretching of single cells for
large population mechanical phenotyping. Proc. Natl.
Acad. Sci. U. S. A., 109(20):7630–7635.
Hood, K., Lee, S., and Roper, M. (2015). Inertial migration
of a rigid sphere in three-dimensional poiseuille flow.
J. Fluid Mech., 765:452–479.
Jan
ˇ
cigov
´
a, I. (2020). Computational modeling of blood
flow with rare cell in a microbifurcation. In Lec-
ture Notes in Computational Vision and Biomechan-
ics, Lecture notes in computational vision and biome-
chanics, pages 518–525. Springer International Pub-
lishing, Cham.
Jan
ˇ
cigov
´
a, I., Koval
ˇ
c
´
ıkov
´
a, K., Bohinikov
´
a, A., and
Cimr
´
ak, I. (2020). Spring-network model of red blood
cell: From membrane mechanics to validation. Int. J.
Numer. Methods Fluids, 92(10):1368–1393.
Jancigova, I. and Tothova, R. (2014). Scalability of forces in
mesh-based models of elastic objects. In 2014 ELEK-
TRO. IEEE.
Jan
ˇ
cigov
´
a, I., Koval
ˇ
c
´
ıkov
´
a, K., Weeber, R., and Cimr
´
ak, I.
(2020). Pyoif: Computational tool for modelling of
multi-cell flows in complex geometries. PLoS Com-
putational Biology, 16:e1008249.
Jan
ˇ
cigov
´
a, I., Mul
´
ık, M., and Cimr
´
ak, I. (2022). Contact
area of cell cluster in a simple bifurcation. In 2022
ELEKTRO (ELEKTRO), pages 1–5.
Liu, N., Petchakup, C., Tay, H. M., Li, K. H. H., and Hou,
H. W. (2019). Spiral inertial microfluidics for cell sep-
aration and biomedical applications. Applications of
Microfluidic Systems in Biology and Medicine, pages
99–150.
Martel, J. M. and Toner, M. (2014). Inertial focusing in
microfluidics. Annu. Rev. Biomed. Eng., 16(1):371–
396.
Matas, J.-P., Morris, J. F., and Guazzelli,
´
E. (2009). Lateral
force on a rigid sphere in large-inertia laminar pipe
flow. J. Fluid Mech., 621:59–67.
Nivedita, N., Ligrani, P., and Papautsky, I. (2017). Dean
flow dynamics in low-aspect ratio spiral microchan-
nels. Scientific Reports, 7(1):44072.
Tanaka, T., Ishikawa, T., Numayama-Tsuruta, K., Imai, Y.,
Ueno, H., Matsuki, N., and Yamaguchi, T. (2012).
Separation of cancer cells from a red blood cell sus-
pension using inertial force. Lab Chip, 12(21):4336–
4343.
Tothova, R., Jancigova, I., and Busik, M. (2015). Calibra-
tion of elastic coefficients for spring-network model
of red blood cell. In 2015 International Conference
on Information and Digital Technologies. IEEE.
Tripathi, S., Kumar, A., Bala Varun Kumar, Y., and
Agrawal, A. (2016). Three-dimensional hydrody-
namic flow focusing of dye, particles and cells in a
microfluidic device by employing two bends of oppo-
site curvature. Microfluidics and Nanofluidics, 20:1–
14.
Warkiani, M. E., Guan, G., Luan, K. B., Lee, W. C., Bhagat,
A. A. S., Chaudhuri, P. K., Tan, D. S.-W., Lim, W. T.,
Lee, S. C., Chen, P. C., et al. (2014). Slanted spiral
microfluidics for the ultra-fast, label-free isolation of
circulating tumor cells. Lab on a Chip, 14(1):128–
137.
Xiang, N. and Ni, Z. (2022). Inertial microfluidics: current
status, challenges, and future opportunities. Lab on a
Chip, 22(24):4792–4804.
Xu, X., Huang, X., Sun, J., Wang, R., Yao, J., Han, W., Wei,
M., Chen, J., Guo, J., Sun, L., et al. (2021). Recent
progress of inertial microfluidic-based cell separation.
Analyst, 146(23):7070–7086.
Ying, Y. and Lina, Y. (2020). Inertial focusing and separa-
tion of particles in similar curved channels. Scientific
reports, natureresearch, 391:123570.
Zhang, J., Yan, S., Li, W., Alici, G., and Nguyen, N.-T.
(2014). High throughput extraction of plasma using
a secondary flow-aided inertial microfluidic device.
RSC Adv., 4:33149–33159.
BIOINFORMATICS 2024 - 15th International Conference on Bioinformatics Models, Methods and Algorithms
560
