
Evaluation of K-Means Time Series Clustering Based on
Z-Normalization and NP-Free
Ming-Chang Lee
1 a
, Jia-Chun Lin
2 b
and Volker Stolz
1 c
1
Department of Computer Science, Electrical Engineering and Mathematical Sciences, Høgskulen p
˚
a Vestlandet (HVL),
Bergen, Norway
2
Department of Information Security and Communication Technology, Norwegian University of Science and Technology
(NTNU), Gjøvik, Norway
Keywords:
Time Series, Clustering, K-Means Time Series Clustering, Z-Normalization, NP-Free,
Performance Evaluation.
Abstract:
Despite the widespread use of k-means time series clustering in various domains, there exists a gap in the
literature regarding its comprehensive evaluation with different time series preprocessing approaches. This
paper seeks to fill this gap by conducting a thorough performance evaluation of k-means time series clus-
tering on real-world open-source time series datasets. The evaluation focuses on two distinct techniques:
z-normalization and NP-Free. The former is one of the most commonly used approaches for normalizing time
series, and the latter is a real-time time series representation approach. The primary objective of this paper is
to assess the impact of these two techniques on k-means time series clustering in terms of its clustering quality.
The experiments employ the silhouette score, a well-established metric for evaluating the quality of clusters
in a dataset. By systematically investigating the performance of k-means time series clustering with these two
preprocessing techniques, this paper addresses the current gap in k-means time series clustering evaluation
and contributes valuable insights to the development of time series clustering.
1 INTRODUCTION
Time series clustering is a data mining technique that
involves grouping similar time series into clusters
without prior knowledge of these cluster definitions.
To elaborate, clusters are established by aggregating
time series with significant similarity to other time
series within the same cluster while maintaining min-
imal similarity with time series in different clusters
(Aghabozorgi et al., 2015).
In recent years, there has been an increasing need
for time series clustering due to the explosion of
the Internet of Things (IoT) in diverse areas. Vast
amounts of time series data are continuously mea-
sured and collected from connected devices and sen-
sors, and they often require clustering and analy-
sis. Various clustering approaches have been intro-
duced and employed to address this demand, includ-
ing k-means (MacQueen et al., 1967) , hierarchi-
cal clustering (Kaufman and Rousseeuw, 2009), k-
a
https://orcid.org/0000-0003-2484-4366
b
https://orcid.org/0000-0003-3374-8536
c
https://orcid.org/0000-0002-1031-6936
Shape (Paparrizos and Gravano, 2015), Kernel K-
means (Dhillon et al., 2004), etc. Among these, k-
means is one of the most popular and widely used
techniques, known for its simplicity and efficiency
in partitioning time series data into distinct clusters
(Ruiz et al., 2020). However, clustering raw time se-
ries can be challenging because the scales and magni-
tudes of different time series may vary significantly.
Hence, it becomes necessary to apply preprocessing
techniques before clustering the raw time series data.
Z-normalization is one of the most commonly
used approach for preprocessing time series (Dau
et al., 2019), and it is widely employed by many rep-
resentation approaches and clustering approaches be-
cause of its simplicity and effectiveness. However,
z-normalization may cause certain distinct time series
to become indistinguishable (Lee et al., 2023a), which
might mislead clustering approaches and negatively
impact on the performance of clustering results.
NP-Free is a real-time time series representation
approach introduced by Lee et al. (Lee et al., 2023b).
NP-Free possesses the unique capability to dynam-
ically transform any raw time series into a root-
mean-square error (RMSE) series in real time. This
Lee, M., Lin, J. and Stolz, V.
Evaluation of K-Means Time Series Clustering Based on Z-Normalization and NP-Free.
DOI: 10.5220/0012547200003654
In Proceedings of the 13th International Conference on Pattern Recognition Applications and Methods (ICPRAM 2024), pages 469-477
ISBN: 978-989-758-684-2; ISSN: 2184-4313
Copyright © 2024 by Paper published under CC license (CC BY-NC-ND 4.0)
469

transformation ensures that the resulting RMSE se-
ries serves as an effective representation of the orig-
inal raw series. NP-Free stands out from conven-
tional representation approaches by eliminating pre-
processing steps like z-normalization. This character-
istic enables NP-Free to be an alternative to replace
z-normalization in time series clustering applications.
Considering these two distinct options for time se-
ries preprocessing, the impact of z-normalization and
NP-Free on the performance of k-means time series
clustering, especially concerning its clustering qual-
ity, remains unknown in the literature. Therefore, in
this paper, we aims to fill this gap. Our goal is to an-
alyze and compare the performance of k-means time
series clustering when applied with z-normalization
and NP-Free, providing insights into how each tech-
nique influences the quality of clusters generated by
k-means time series clustering.
Two experiments, utilizing real-world open-
source time series datasets from the UEA&UCR
archive (Dau et al., 2019), were conducted. The clus-
ters generated by the two variants of k-means time
series clustering were assessed using the silhouettes
score, which is a metric used to evaluate the quality
of clusters in a dataset (Rousseeuw, 1987). The ex-
periment results shows that the cluster quality is sig-
nificantly influenced by z-normalization and NP-Free.
Our evaluation analysis valuable insights to the devel-
opment of time series clustering.
The rest of the paper is organized as follows: Sec-
tion 2 covers background on k-means time series clus-
tering, z-normalization, and NP-Free. Section 3 dis-
cusses related work. Section 4 provides evaluation
details and discusses the experiments along with the
corresponding results. Finally, Section 5 concludes
this paper and outlines future work.
2 BACKGROUND
This section introduces k-means time series cluster-
ing, z-normalization, and NP-Free.
2.1 K-Means Time Series Clustering
k-means time series clustering is a unsupervised ma-
chine learning approach designed to group time series
into distinct clusters. The method, its initial formu-
lation, was first introduced by Mac Queen in 1967
(MacQueen et al., 1967), and the approximation de-
veloped by Lloyd in 1982 (Lloyd, 1982) has proven
to be more popular in application. It is widely used
due to its ease of implementation, simplicity, and ef-
ficiency.
k-means minimizes the distance between each
time series and the centroid of its assigned clus-
ter, with distances computed using various metrics
such as Euclidean distance or dynamic time warping
(DTW) distance. Before initiating k-means cluster-
ing, two parameters must be determined: the num-
ber of clusters (k) and the initial centroids. While
a fixed parameter configuration yields a consistent
clustering result, it is important to note that differ-
ent configurations typically lead to varying outcomes.
Consequently, a common approach is to execute k-
means multiple times with different parameter con-
figurations and subsequently select the best clustering
outcome.
2.2 Z-Normalization
z-normalization (also known as z-score normaliza-
tion) is a statistical technique used in data process-
ing and analysis. It transforms data into a standard
scale with a mean of 0 and a standard deviation of
1 (Senin, 2016). The purpose of z-normalization is
to simplify the interpretation and comparison of dif-
ferent datasets, making them directly comparable. z-
normalization is typically applied to individual data
points within a dataset by subtracting the mean of the
dataset from each data point and then dividing the
result by the standard deviation. The formula of z-
normalization is shown below.
z
i
=
z
i
− µ
σ
(1)
where z
i
is the i-th data point in a time series, µ is
the mean of all data points in the time series, σ is the
standard deviation of all the data points, and z
i
is the
z-normalized value (i.e., z-score) of the the i-th data
point derived from the formula.
z-normalization is considered an essential pre-
processing step for time series representation ap-
proaches because it allows these approaches to focus
on the structural similarities/dissimilarities of time
series rather than on the original data point values
(Senin, 2016). However, z-normalization has some
limitations and drawbacks, including sensitivity to
outliers, loss of the original data scale, lack of invari-
ance. Additionally, when applied to flat time series, it
can amplify fluctuations, such as noises, resulting in
an negative impact on data mining techniques, such
as Matrix Profile (Paepe et al., 2019).
2.3 NP-Free
NP-Free (Lee et al., 2023a) is a real-time time series
representation approach. It eliminates the need for
preprocessing input time series with z-normalization
ICPRAM 2024 - 13th International Conference on Pattern Recognition Applications and Methods
470

and requires no advance parameter tuning by users.
NP-Free directly generates a representation for a raw
time series by transforming the time series into a root-
mean-square error (RMSE) series in real time.
NP-Free, using Long Short-Term Memory
(LSTM) and the Look-Back and Predict-Forward
strategy from RePAD (Lee et al., 2020), generates
representations for time series. Specifically, NP-Free
continuously predicts the next data point in the target
time series using three historical data points and
calculates the RMSE (Root Mean Square Error) value
between the observed and predicted data points.
This process converts the target time series into an
RMSE series. With its preprocessing-free approach,
NP-Free presents an alternative to z-normalization in
time series clustering applications.
3 RELATED WORK
Kapil and Chawla (Kapil and Chawla, 2016) inves-
tigated the impact of different distance functions, in-
cluding the Euclidean and Manhattan distance func-
tions, on the performance of k-means. Ahmed et al.
(Ahmed et al., 2020) conducted a review to address
the shortcomings of the k-means algorithm, specifi-
cally focusing on the issues of initialization and its
inability to handle data with mixed types of features.
The authors performed an experimental analysis to in-
vestigate different versions of the k-means algorithms
for different datasets.
Kuncheva and Vetrov (Kuncheva and Vetrov,
2006) investigated the stability of clustering algo-
rithms, particularly cluster ensembles relying on k-
means clusters, in the presence of random elements
such as the target number of clusters (k) and random
initialization. Using a diverse set of 10 artificial and
10 real datasets with a modest number of clusters and
data points, the research assessed pairwise and non-
pairwise stability metrics. The study explored the re-
lationship between stability and accuracy concerning
the number of clusters (k) and proposed a new com-
bined stability index, incorporating both pairwise in-
dividual and ensemble stabilities, which shows im-
proved correlation with ensemble accuracy.
Gupta and Chandra (Gupta and Chandra, 2020)
aims to find out the possibility of different dis-
tance/similarity metrics to be used with k-means al-
gorithm by conducting an empirical evaluation. The
study compares the accuracy, performance, and reli-
ability of 13 diverse distance or similarity measures
across six variations of data using the k-means algo-
rithm.
Vats and Sagar (Vats and Sagar, 2019) investigated
the performance of the k-means algorithm through
various implementations, including k-mean simple
(utilizing Java codes on MapReduce), k-means with
Initial Equidistant Centres (IEC), k-mean on Mahout
(leveraging a machine learning library), and k-mean
on Spark (utilizing another machine learning library).
Additionally, the study explores the behavior of k-
means algorithms concerning centroids and various
iteration levels, providing insights into their perfor-
mance across different infrastructures.
The work by Ikotun et al. (Ikotun et al., 2023)
presents a comprehensive review focused on four key
aspects: a systematic examination of the k-means
clustering algorithm and its variants, the introduction
of a novel taxonomy, in-depth analyses to validate
findings, and identification of open issues. The review
provides a detailed examination of k-means, identi-
fies research gaps, and outlines future directions to
address challenges in k-means clustering and its vari-
ants.
According to our investigation, there exists a gap
in the literature concerning the evaluation of k-means
time series clustering with different normalization
techniques. This gap highlights the need for compre-
hensive studies that compare the performance of k-
means clustering using different preprocessing tech-
niques. Such investigations could provide valuable
insights into the strengths and limitations of different
preprocessing techniques, contributing to the devel-
opment of more effective and robust clustering algo-
rithms for time series data.
4 EVALUATION
To evaluate the impact of z-normalization and NP-
Free on k-means time series clustering in terms of its
clustering quality, we conducted two experiments us-
ing two real-world open-source time series datasets
from the UEA&UCR archive (Dau et al., 2019). In
the rest of this paper, we refer to k-means time series
clustering based on z-normalization as z-kmeans, and
refer to k-means time series clustering based on NP-
Free as NPF-kmeans.
We implemented these two variants using the
k-means time series algorithm provided by tslearn
(Tavenard et al., 2020), which is a Python package
that provides machine learning tools for time series
analysis. Furthermore, the NP-Free in NPF-kmeans
was implemented in DeepLearning4J (Deeplearn-
ing4j, 2023). To ensure a fair comparison, identical
initial centroids were utilized for both z-kmeans and
NPF-kmeans. All the experiments were performed on
a laptop running MacOS Ventura 13.4 with 2.6 GHz
6-Core Intel Core i7 and 16GB DDR4 SDRAM.
In the first experiment, we selected all time se-
Evaluation of K-Means Time Series Clustering Based on Z-Normalization and NP-Free
471

ries belonging to a class named ”class 2: Point
(FP03, MP03, FP18, and MP18)” from the
GunPointAgeSpan TRAIN.txt of the GunPointAgeS-
pan dataset
1
. There are 67 raw time series in this
class, each with 150 data points representing an ac-
tion performed by a person. We refer to this dataset as
GunPointPointTrain in this paper. As per the dataset
description, the time series can be categorized into
various types. However, it is important to note that
there is no label information indicating the specific
type to which each time series belongs.
In the second experiment, we selected all
time series from a class named ”class 2:
Male (MG03, MP03, MG18, MP18)” from the
GunPointMaleVersusFemale TRAIN.txt of the Gun-
PointMaleVersusFemale dataset
2
. In this class, there
are 64 raw time series, each comprising 150 data
points. We call this dataset GunPointMaleTrain.
Similarly, despite the dataset description suggesting
that these time series can be further divided into
different types, there is no label information in the
dateset. The reason we chose these two datasets is
that they are in a raw form, making them suitable for
conducting our evaluation.
The hyperparameter and parameter settings in
NPF-kmeans are identical to those used in NP-Free
(Lee et al., 2023a). This settings were originally sug-
gested and employed in prior studies by (Lee et al.,
2023b), (Lee et al., 2020), and (Lee et al., 2021). We
adopted these settings for our two experiments. Re-
garding the sliding window parameter w, it is recom-
mended to use a large value (Lee and Lin, 2023). In
this paper, w was set to 150, as each time series in
GunPointPointTrain and GunPointMaleTrain consists
of only 150 data points.
In order to evaluate the performance of z-kmeans
and NPF-kmeans, Silhouettes (Rousseeuw, 1987) was
used in this paper. Silhouettes is a well-known mea-
sure to evaluate the quality of clusters in unsupervised
machine learning. Silhouettes quantifies how similar
each object is to its own cluster compared to other
clusters. A Silhouettes score ranges from -1 to 1. A
value near 1 indicates that each object is well matched
to its own cluster and poorly matched to neighboring
clusters, a value of 0 indicates that each object is on or
very close to the boundary between two neighboring
clusters, and a value near -1 suggests that objects may
have been assigned to the wrong cluster.
The process for calculating the Silhouettes score
1
The GunPointAgeSpan dataset, http://www.timeseries
classification.com/description.php?Dataset=GunPointAg
eSpan
2
The GunPointMaleVersusFemale dataset, http://www.
timeseriesclassification.com/description.php?Dataset=Gu
nPointMaleVersusFemale
to represent the overall clustering quality of a time
series clustering approach is shown as follows:
1. Select a time series i. Choose one time series from
a cluster for which we would like to calculate its
Silhouettes score.
2. Calculate a(i). Calculate the average distance of
i to all the other time series within the same clus-
ter. A smaller value indicates a better assignment
within the cluster.
3. Identify the nearest cluster to i. Compute the aver-
age distance between i and all time series in each
of the other clusters. Find the cluster that has the
minimum average distance to i. This cluster is
considered the nearest neighboring cluster to i.
4. Calculate b(i). Calculate the average distance of i
to all series in the nearest neighboring cluster.
5. Calculate s(i). Calculate the Silhouettes score of
i using (b(i) − a(i))/max{a(i), b(i)}. This result-
ing s(i) ranges from -1 to 1, where higher values
indicate better clustering.
6. Repeat steps 1 to 5 to calculate a Silhouettes score
for each time series in the dataset. Afterward,
calculate the average Silhouettes score for all the
time series. This provides an overall measure of
the clustering quality.
In this paper, we used the Silhouettes function pro-
vided by tslearn (Tavenard et al., 2020) to evaluate
z-kmeans and NPF-kmeans. Note that the random
state in tslearn is fixed at a value of 1 to avoid ran-
dom execution results. Additionally, the metric for
calculating the distance between time series is set to
euclidean. It is worth mentioning that when eval-
uating NPF-kmeans, we mapped each RMSE series
back to its original raw time series and calculated the
average Silhouettes score using these raw time se-
ries. Similarly, we used the raw time series to com-
pute the average Silhouettes score of z-kmeans. This
is because using z-normalized time series to calcu-
late the average Silhouettes score for z-kmeans un-
fairly favors z-kmeans over NPF-kmeans. Recall that
z-normalization can make distinct time series seem
similar, leading to them being assigned to the same
cluster. Consequently, the overall Silhouettes score
for z-kmeans might falsely appear higher than that
of NPF-kmeans, giving the impression that z-kmeans
provides better clustering quality.
Due to the mentioned reason, we evaluated the
overall Silhouettes score of NPF-kmeans and z-
kmeans using raw time series, which resulted in
somewhat lower overall Silhouettes score. However,
this approach ensures a fair basis for comparing NPF-
kmeans and z-kmeans.
ICPRAM 2024 - 13th International Conference on Pattern Recognition Applications and Methods
472

4.1 Experiment 1
In this experiment, we evaluated the individual per-
formance of NPF-kmeans and z-kmeans on the Gun-
PointPointTrain dataset. Figure 1(a) illustrates all the
raw time series in this dataset. When NPF-kmeans
was evaluated, it first converted each raw time series
into a RMSE series using NP-Free. Figure 1(b) shows
all the corresponding RMSE time series. On the other
hand, when z-kmeans was evaluated, it first prepro-
cessed each raw time series by translating it into a
z-normalized series. The results can be seen in Fig-
ure 1(c). We then randomly chose 12 different values
between 13 and 33 for the parameter k in both NPF-
kmeans and z-kmeans, with the aim of evaluating the
overall Silhouettes score of the two approaches across
different settings for k. As the results listed in Table 1,
NPF-kmeans achieves a higher Silhouettes score than
z-kmeans in all the cases. Note that all the scores were
calculated based on raw time series, rather than nor-
malized ones.
Table 1: The overall Silhouettes scores of NPF-kmeans and
z-kmeans on GunPointPointTrain.
The value of k NPF-kmeans z-kmeans
13 0.4110 0.3327
14 0.4093 0.3654
15 0.5035 0.3766
17 0.4326 0.3594
19 0.3696 0.2853
20 0.3404 0.2845
21 0.3484 0.3129
22 0.3599 0.2787
26 0.3388 0.2345
28 0.3257 0.2004
29 0.3077 0.2332
33 0.2935 0.2294
We further elaborate the clustering results of NPF-
kmeans and z-kmeans when the GunPointPointTrain
dataset was partitioned into 15 clusters, as both vari-
ants achieve the highest Silhouettes score under this
setting. Figure 2 illustrates all the 15 clusters gener-
ated by NPF-kmeans where the left part of the figure
shows all the RMSE series in each cluster, whereas
the right part of the figure shows all the corresponding
raw time series in each cluster. It is clear that NPF-
kmeans effectively clustered all the raw time series,
as each time series within the same cluster is similar
to every other but less similar to any time series in
other clusters. It is important to note that this good
performance cannot be reflected in the overall Silhou-
ettes score of NPF-kmeans because the score was cal-
culated based on raw time series rather than RMSE
series. These scores were intended for the purpose of
comparing NPF-kmeans and z-kmeans.
Table 2 further lists the detailed clustering results
of NPF-kmeans. NPF-kmeans identified two time se-
ries as outliers (i.e., time series No. 11 and No. 21)
and therefore assigned each of them to a separated
cluster because their RMSE series are very different
from those of the rest time series, which can be ob-
served from the left part of Figure 2.
Table 2: The clustering results of NPF-kmeans on Gun-
PointPointTrain with k set to 15.
Cluster ID # of time series Time series No.
1 11 17,22,30,31,32,39,45,52,53,56,57
2 8 6,12,13,14,27,37,49,65
3 7 4,15,24,35,40,54,61
4 6 34,36,47,50,59,62
5 5 16,19,33,44,60
6 5 10,18,28,64,66
7 5 5,8,26,42,55
8 4 1,2,7,29
9 4 20,38,41,63
10 3 3,43,67
11 3 46,48,58
12 2 9,23
13 2 25,60
14 1 11
15 1 21
On the other hand, Figure 3 depicts all the 15 clus-
ters produced by z-kmeans. The left part of the figure
shows all the z-normalized time series in each cluster,
while the right part shows all the corresponding raw
time series. Detailed clustering results of z-kmeans
are presented in Table 3. It is interesting and surpris-
ing to observe that, although the z-normalized time
series in each cluster appear similar (as shown in the
left part of Figure 3), not all corresponding raw time
series within these clusters exhibit the same level of
similarity (see the the right part of Figure 3). For
instance, we can see that all z-normalized time se-
ries in cluster 2 appear significantly similar, but the
corresponding raw time series in cluster 2 do not ex-
hibit the same phenomenon. Apparently, raw time
series No.42 and No.55 have a similar pattern with
each other, but they have a much flatter pattern and
much smaller y-axis values than the rest of the raw
time series within cluster 2. Similar observations can
be made in cluster 8.
The observed phenomena were attributed to the
effects of z-normalization, which has the potential to
make distinct time series indistinguishable. This find-
ing is consistent with studies (H
¨
oppner, 2014) and
(Lee et al., 2023a), suggesting that z-normalization
might compromise potentially relevant properties that
differentiate time series. Consequently, this could
negatively impact subsequent data mining tasks (Dau
et al., 2019; Senin, 2016; Codecademy-Team, 2022).
Evaluation of K-Means Time Series Clustering Based on Z-Normalization and NP-Free
473
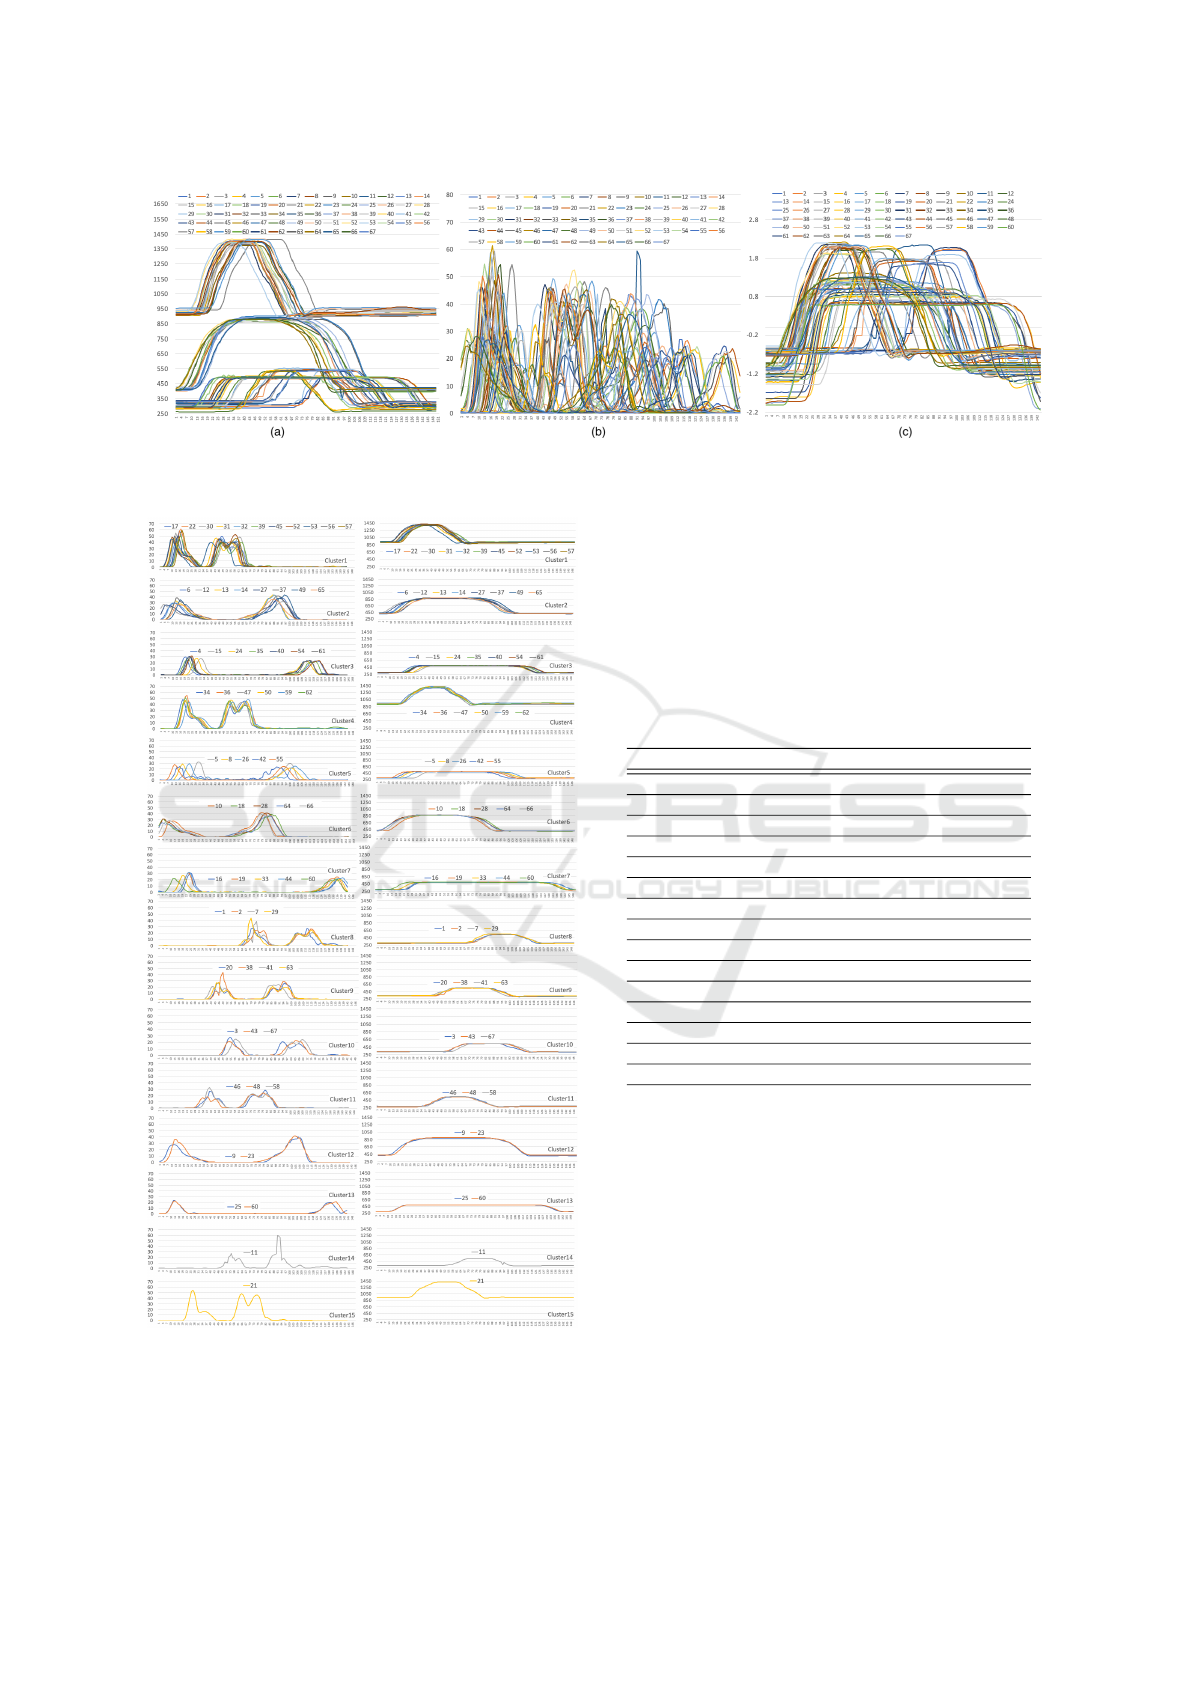
Figure 1: (a) Original raw time series in the GunPointPointTrain dataset, (b) The RMSE series of each raw time series, and
(c) The z-normalized series of each raw time series.
Figure 2: The clustering results of NPF-kmeans on the Gun-
PointPointTrain dataset. The left part displays RMSE series
in each cluster, while the right part shows the corresponding
raw time series.
In this experiment, z-normalization misled time
series to be wrongly clustered together into the same
cluster. This is also why we chose not to use all the z-
normalized time series for calculating the overall Sil-
houettes score of z-kmeans. The score, in this case, is
unable to accurately reflect the true clustering quality
of z-kmeans.
Table 3: The clustering results of z-kmeans on GunPoint-
PointTrain wiht k set to 15.
Cluster ID # of time series Time series No.
1 11 17,22,30,31,32,39,45,52,53,56,57
2 9 6,12,13,14,27,37,42,55,65
3 7 21,34,36,47,50,59,62
4 5 10,18,28,64,66
5 5 16,19,33,44,51
6 4 1,2,7,29
7 4 3,11,43,67
8 4 8,9,23,49
9 4 20,38,41,63
10 3 4,35,54
11 3 26,40,61
12 3 46,48,58
13 2 15, 24
14 2 25,60
15 1 5
In terms of time consumption for NPF-kmeans
and z-kmeans, we exclusively evaluated both variants
for their preprocessing stages, as this is the only dif-
ference between them. The average time consumption
and standard deviation for NPF-kmeans are 5.575 sec
and 1.545 sec, respectively. On the other hand, the
average time consumption and standard deviation for
z-kmeans are 0.002 sec and 0.001 sec, respectively.
Since NP-Free is based on LSTM to generate a RMSE
series for each time series, it took more time than z-
normalization.
ICPRAM 2024 - 13th International Conference on Pattern Recognition Applications and Methods
474
Figure 3: The clustering results of z-kmeans on the Gun-
PointPointTrain dataset. The left part shows z-normalized
time series in each cluster, while the right part shows the
corresponding raw time series.
4.2 Experiment 2
In this experiment, we further evaluated the cluster-
ing performance of NPF-kmeans and z-kmeans on the
GunPointMaleTrain dataset. Figure 4(a) illustrates all
the raw time series in this dataset, Figure 4(b) shows
the corresponding RMSE time series generated by
NP-Free, and Figure 4(c) depicts the corresponding
time series generated by z-normalization.
Here we randomly selected 9 different values for
parameter k, ranging from 13 to 29, for both NPF-
kmeans and z-kmeans. This was conducted for the
same purpose outlined in the first experiment: to
evaluate the overall Silhouettes scores of the two ap-
proaches across various settings of k. As the results
shown in Table 4, NPF-kmeans provides a higher
overall Silhouettes score than z-kmeans in all the
cases. Please note that all the Silhouettes scores
shown in Table 4 might appear low, as they were
calculated using the raw time series. As mentioned
earlier, although the scores are intended to compare
NPF-kmeans and z-kmeans, they cannot be used to
accurately represent the true clustering performance
of both variants. It is evident from Table 4 that NPF-
kmeans offers better clustering quality than z-kmeans,
regardless of the value of k.
Table 4: The overall Silhouettes score of NPF-kmeans and
z-kmeans on GunPointMaleTrain.
The value of k NPF-kmeans z-kmeans
13 0.2240 0.1512
15 0.2590 0.1986
16 0.3659 0.2231
18 0.3335 0.2284
20 0.3422 0.2108
23 0.2873 0.1858
26 0.2969 0.1339
28 0.2734 0.2085
29 0.2423 0.1991
To understand why z-kmeans performed worse
than NPF-kmeans, we closely examined the cluster-
ing results of z-kmeans on the GunPointMaleTrain
dataset, taking k =16 as an example. The left part
of Figure 5 illustrates all the z-normalized time series
in clusters 2, 5, and 6, while the right part of the same
figure depicts all the corresponding raw time series in
these clusters. It is evident that all the z-normalized
time series within each of these clusters are close
to each other. This is why z-kmeans assigned these
z-normalized time series to their respective clusters.
However, if mapping these z-normalized time series
back to their original raw time series reveals that not
all the time series within each of these three clusters
were appropriately grouped together (refer to the right
part of Figure 5). In other words, z-kmeans was mis-
led by z-normalization.
Regarding time consumption for preprocessing
GunPointMaleTrain, the average time consumption
and standard deviation for NPF-kmeans are 5.515 sec
and 1.378 sec, respectively. However, for z-kmeans,
they are 0.002 sec and 0.001 sec, respectively. Simi-
lar to the result shown in the first experiment, NPF-
kmeans required more preprocessing time than z-
kmeans due to the adoption of NP-Free.
Evaluation of K-Means Time Series Clustering Based on Z-Normalization and NP-Free
475
Figure 4: (a) Original raw time series in the GunPointMaleTrain dataset, (b) The RMSE series of each raw time series
generated by NP-Free, and (c) The z-normalized series of each raw time series generated by z-normalization.
Figure 5: The clustering results of z-kmeans on the GunPointMaleTrain dataset. The left part shows all the z-normalized time
series in clusters 2, 5, and 6, while the right part shows all the corresponding raw time series.
5 CONCLUSIONS AND FUTURE
WORK
In this study, we assessed the impact of utilizing
z-normalization and NP-Free as preprocessing tech-
niques on the performance of k-means time series
clustering. Two experiments were conducted us-
ing two real-world open-source time series datasets.
Our findings indicate that NPF-kmeans (k-means
based on NP-Free) exhibited superior clustering re-
sults compared to z-kmeans (k-means based on z-
normalization). The distinct advantage of NPF-
kmeans lies in its ability to provide a more faithful
representation of time series, which addresses con-
cerns associated with the potential misguidance of z-
normalization observed in z-kmeans.
However, our findings also indicate that the pre-
processing part in NPF-kmeans requires a longer time
due to the adoption of NP-Free, compared to z-
kmeans. Therefore, to enhance the efficiency of NPF-
kmeans when handling a large set of time series, it
is recommended to integrate NPF-kmeans with paral-
lelization in a multi-core environment or distributed
computing clusters. This integration facilitates the
acceleration of the preprocessing step, making NPF-
kmeans more scalable. Furthermore, it is recom-
mended to further enhance the performance of NP-
Free, with the goal of reducing the time required to
convert a time series into an RMSE series.
In our future work, we plan to expand our evalua-
tion by considering more time series clustering algo-
rithms, normalization techniques, datasets, and per-
formance metrics to provide a more holistic and com-
prehensive evaluation.
ACKNOWLEDGEMENTS
This work was partially conducted within the SFI-
NORCICS (https://www.ntnu.edu/norcics). This
project has received funding from the Research Coun-
cil of Norway under grant no. 310105 “Norwegian
Centre for Cybersecurity in Critical Sectors.”
REFERENCES
Aghabozorgi, S., Shirkhorshidi, A. S., and Wah, T. Y.
(2015). Time-series clustering–a decade review. In-
formation systems, 53:16–38.
ICPRAM 2024 - 13th International Conference on Pattern Recognition Applications and Methods
476

Ahmed, M., Seraj, R., and Islam, S. M. S. (2020). The
k-means algorithm: A comprehensive survey and per-
formance evaluation. Electronics, 9(8):1295.
Codecademy-Team (2022). Normalization. https://www.
codecademy.com/article/normalization. [Online;
accessed 14-September-2023].
Dau, H. A., Bagnall, A., Kamgar, K., Yeh, C.-C. M., Zhu,
Y., Gharghabi, S., Ratanamahatana, C. A., and Keogh,
E. (2019). The UCR time series archive. IEEE/CAA
Journal of Automatica Sinica, 6(6):1293–1305.
Deeplearning4j (2023). Introduction to core deeplearning4j
concepts. https://deeplearning4j.konduit.ai/. [Online;
accessed 14-September-2023].
Dhillon, I. S., Guan, Y., and Kulis, B. (2004). Kernel k-
means: spectral clustering and normalized cuts. In
Proceedings of the tenth ACM SIGKDD international
conference on Knowledge discovery and data mining,
pages 551–556.
Gupta, M. K. and Chandra, P. (2020). An empirical evalu-
ation of k-means clustering algorithm using different
distance/similarity metrics. In Proceedings of ICETIT
2019: Emerging Trends in Information Technology,
pages 884–892. Springer.
H
¨
oppner, F. (2014). Less is more: similarity of time series
under linear transformations. In Proceedings of the
2014 SIAM International Conference on Data Mining,
pages 560–568. SIAM.
Ikotun, A. M., Ezugwu, A. E., Abualigah, L., Abuhaija,
B., and Heming, J. (2023). K-means clustering al-
gorithms: A comprehensive review, variants analysis,
and advances in the era of big data. Information Sci-
ences, 622:178–210.
Kapil, S. and Chawla, M. (2016). Performance evaluation
of k-means clustering algorithm with various distance
metrics. In 2016 IEEE 1st international conference
on power electronics, intelligent control and energy
systems (ICPEICES), pages 1–4. IEEE.
Kaufman, L. and Rousseeuw, P. J. (2009). Finding groups in
data: an introduction to cluster analysis. John Wiley
& Sons.
Kuncheva, L. I. and Vetrov, D. P. (2006). Evaluation of
stability of k-means cluster ensembles with respect
to random initialization. IEEE transactions on pat-
tern analysis and machine intelligence, 28(11):1798–
1808.
Lee, M.-C. and Lin, J.-C. (2023). RePAD2: Real-time,
lightweight, and adaptive anomaly detection for open-
ended time series. In Proceedings of the 8th Inter-
national Conference on Internet of Things, Big Data
and Security - IoTBDS, pages 208–217. INSTICC,
SciTePress. arXiv preprint arXiv:2303.00409.
Lee, M.-C., Lin, J.-C., and Gran, E. G. (2020). RePAD:
real-time proactive anomaly detection for time series.
In Advanced Information Networking and Applica-
tions: Proceedings of the 34th International Confer-
ence on Advanced Information Networking and Ap-
plications (AINA-2020), pages 1291–1302. Springer.
arXiv preprint arXiv:2001.08922.
Lee, M.-C., Lin, J.-C., and Gran, E. G. (2021). How far
should we look back to achieve effective real-time
time-series anomaly detection? In Advanced Infor-
mation Networking and Applications: Proceedings of
the 35th International Conference on Advanced In-
formation Networking and Applications (AINA-2021),
Volume 1, pages 136–148. Springer. arXiv preprint
arXiv:2102.06560.
Lee, M.-C., Lin, J.-C., and Stolz, V. (2023a). NP-Free:
A real-time normalization-free and parameter-tuning-
free representation approach for open-ended time se-
ries. https://arxiv.org/pdf/2304.06168.pdf. [Online;
accessed 14-September-2023].
Lee, M.-C., Lin, J.-C., and Stolz, V. (2023b). NP-
Free: A real-time normalization-free and parameter-
tuning-free representation approach for open-ended
time series. In 2023 IEEE 47th Annual Computers,
Software, and Applications Conference (COMPSAC),
pages 334–339.
Lloyd, S. (1982). Least squares quantization in pcm. IEEE
transactions on information theory, 28(2):129–137.
MacQueen, J. et al. (1967). Some methods for classification
and analysis of multivariate observations. In Proceed-
ings of the fifth Berkeley symposium on mathematical
statistics and probability, volume 1, pages 281–297.
Oakland, CA, USA.
Paepe, D. D., Avendano, D. N., and Hoecke, S. V. (2019).
Implications of z-normalization in the matrix profile.
In International Conference on Pattern Recognition
Applications and Methods, pages 95–118. Springer.
Paparrizos, J. and Gravano, L. (2015). k-shape: Efficient
and accurate clustering of time series. In Proceedings
of the 2015 ACM SIGMOD international conference
on management of data, pages 1855–1870.
Rousseeuw, P. J. (1987). Silhouettes: a graphical aid to
the interpretation and validation of cluster analysis.
Journal of computational and applied mathematics,
20:53–65.
Ruiz, L. G. B., Pegalajar, M., Arcucci, R., and Molina-
Solana, M. (2020). A time-series clustering methodol-
ogy for knowledge extraction in energy consumption
data. Expert Systems with Applications, 160:113731.
Senin, P. (2016). Z-normalization of time series. https:
//jmotif.github.io/sax-vsm site/morea/algorithm/znor
m.html. [Online; accessed 14-September-2023].
Tavenard, R., Faouzi, J., Vandewiele, G., Divo, F., Androz,
G., Holtz, C., Payne, M., Yurchak, R., Rußwurm, M.,
Kolar, K., and Woods, E. (2020). Tslearn, a machine
learning toolkit for time series data. Journal of Ma-
chine Learning Research, 21(118):1–6.
Vats, S. and Sagar, B. (2019). Performance evaluation of
k-means clustering on hadoop infrastructure. Journal
of Discrete Mathematical Sciences and Cryptography,
22(8):1349–1363.
Evaluation of K-Means Time Series Clustering Based on Z-Normalization and NP-Free
477
