
Evaluating the Usability of a 3D Map Visualizer Augmented Reality
Application
Franklin L. N. Fracaro
1 a
, Fabiana F. F. Peres
1 b
, Claudio R. M. Mauricio
1 c
and Jo
˜
ao Marcelo X. N. Teixeira
2 d
1
Centro de Engenharias e Ci
ˆ
encias Exatas, Universidade Estadual do Oeste do Paran
´
a, Foz do Iguac¸u 85870-650, Brazil
2
Departamento de Eletr
ˆ
onica e Sistemas, Universidade Federal de Pernambuco, Recife 50670-901, Brazil
Keywords:
Usability Testing, Augmented Reality, User Experience, Human-Computer Interaction.
Abstract:
This study focuses on evaluating the usability of a 3D map visualizer augmented reality application through
informal, remote, and synchronous usability tests, utilizing the Think Aloud process and the System Usability
Scale questionnaire. The aim is to identify potential usability issues in the prototype and develop an action
plan for future iterations of the application’s development. The challenges of integrating end-users in the
application development process is addressed and emphasizes the significance of early usability testing to
uncover and address potential issues. The findings from the usability tests provide valuable insights into user
experience, highlighting key usability issues and user feedback. A comprehensive action plan for addressing
the identified usability issues is presented and implications for future research in the domain of augmented
reality applications is discussed.
1 INTRODUCTION
Usability testing is a process that allows learning
about the users of a product by observing how they
interact with the product to achieve specific goals that
interest them (Barnum, 2020). Usability tests can be
divided into two types: formative tests, conducted
while a product is still in development; and sum-
mative tests, applied when the product is finished or
nearly finished. The latter needs to be applied to a
large number of users to have statistical validity (Bar-
num, 2020).
Various testing methods can be employed sepa-
rately or in combination to assess usability (Bruun
et al., 2009; Ghasemifard et al., 2015; Gupta, 2015).
A commonly used method is remote testing, where
participants and the analyst/moderator are separated
in space and/or time, making them either asyn-
chronous or synchronous. The Think Aloud process
and Performance Measurement are other methods that
can be employed in usability testing.
The overall goal of this work is to identify usabil-
a
https://orcid.org/0009-0004-1274-8224
b
https://orcid.org/0000-0002-3937-3432
c
https://orcid.org/0000-0003-2783-3988
d
https://orcid.org/0000-0001-7180-512X
ity problems in an AR application for displaying 3D
maps through usability testing. Based on the general
goal, the following specific objectives can be high-
lighted: I) Explore the current methods used for iden-
tifying usability problems in AR applications; II) Un-
derstand, plan, and conduct usability tests; III) Ana-
lyze the results obtained from the application of us-
ability tests; IV) Use the knowledge gained from the
analysis of usability test results to propose solutions
for future development iterations.
2 USABILITY DATA
COLLECTION IN AR
Developing and applying assessments that examine
AR is a challenge, especially when design guidelines
and how to conduct these assessments are not yet con-
solidated in the literature (Merino et al., 2020).
Despite the various methods that can be adopted
to evaluate AR approaches, such as heuristic evalua-
tions, usability tests, cognitive walkthroughs, among
others, most of these practices end up being adapted
for specific use cases, making their reuse difficult, or
they are applied in a standardized format without ad-
dressing the specificities of AR. Other issues in as-
Fracaro, F., Peres, F., Mauricio, C. and Teixeira, J.
Evaluating the Usability of a 3D Map Visualizer Augmented Reality Application.
DOI: 10.5220/0012547000003660
Paper published under CC license (CC BY-NC-ND 4.0)
In Proceedings of the 19th International Joint Conference on Computer Vision, Imaging and Computer Graphics Theory and Applications (VISIGRAPP 2024) - Volume 4: VISAPP, pages
621-628
ISBN: 978-989-758-679-8; ISSN: 2184-4321
Proceedings Copyright © 2024 by SCITEPRESS – Science and Technology Publications, Lda.
621

sessments include their execution, which is often not
done with the target audience, and the failure to use
established Software Engineering techniques that en-
sure the proper functioning and code quality of appli-
cations (Tori and Hounsell, 2020).
3 MATERIALS AND METHODS
This section presents the research methodology used
for the planning and execution of this work, address-
ing the tools used, the study target, usability test plan-
ning, and data collection and analysis.
3.1 Development Tools
For the development of the application, Unity 3D with
the AR Foundation framework, Blender, Krita, and
OBS Studio were used. It should be noted that the ap-
plication used for testing was developed prior to the
construction of this work; thus, these tools and the
development process described serve only for demon-
strative purposes of its state during the testing appli-
cation.
3.2 Study Methodology
This work can be characterized as a case study with
the aim of exploring the issues of an AR applica-
tion for mobile devices by applying informal usabil-
ity tests with the collection and analysis of qualitative
data.
The introduction of usability evaluation processes
during the development cycle allowed the discovery
of UX problems early on through the observation of
users interacting with a functional prototype, along
with the analysis of pre-test and post-test question-
naire data. This approach is indicated by various au-
thors such as (Barnum, 2020; Rubin et al., 2008; Stull,
2018; Lewis, 2012), among others.
Usability tests were conducted online with vol-
unteers using two UX research techniques: remote
evaluation and the Think Aloud process. On the
other hand, the Think Aloud process prompted volun-
teers to verbally describe all the actions they intended
to perform in the application before executing them,
allowing the moderator to understand the decision-
making process of these volunteers. The planning
of the format and the decision on which techniques
would be used in the tests can be seen in Section 5.
Before selecting participants for the study, user
profiles were created, with the aim of assisting in the
selection process of users representative of the appli-
cation’s target audience. One critical factor allowed
dividing users into two subgroups: one with prior
knowledge related to Augmented Reality (AR) or Vir-
tual Reality (VR), and another without prior knowl-
edge of these technologies.
The first testing phase involved five volunteers
from a subgroup identified by user profiles as individ-
uals with prior knowledge related to AR or VR, with
sessions lasting between 25 and 35 minutes. Com-
prised of 4 males and 1 female, all of them were un-
dergrad students, with a mean age of 25.4 years. One
of them worked as a professor.
Before the data from the first test was analyzed,
there was an expansion of the application’s target au-
dience, which is explained in greater detail in Sec-
tion 5.5 and 5.6. Thus, the study sample had to be
increased to accommodate a second subgroup, repre-
senting individuals with no previous experience with
AR or VR. Due to the rigid nature of usability tests,
where maximum effort is made to ensure that a partic-
ipant’s experience in a test is the same as that of other
participants (Barnum, 2020). Sessions were sched-
uled in advance, lasting between 35 to 55 minutes,
using the same format as the previous test. Comprised
of 2 males and 3 females, three of them were still un-
dergrad students, with a mean age of 33 years (min
age 24, max age 52). Their main occupations were
secretary, marketing assistant and professor.
The steps followed during these usability tests
were five: initial briefing, download and installation
of the application, usability test, questionnaire and de-
briefing. Initially, the moderator contextualized the
process for the volunteer, explaining what and how it
would be executed, making it clear that only the ap-
plication would be evaluated.
The moderator presented a pre-test questionnaire
which aimed to collect specific data about the volun-
teer, such as their mobile device usage rate and possi-
ble prior knowledge about AR applications. When in-
dicating that the questionnaire was filled out, the mod-
erator provided a link to download the application to
be tested, so the volunteer could install it on their mo-
bile device. After the installation was completed, the
volunteer was asked to run the application and share
the mobile device screen on the online meeting soft-
ware, as shown in Figure 1.
Before starting the test, an explanation of how the
Think Aloud process worked was provided, includ-
ing the types of descriptions expected from the volun-
teer when performing the various scenarios presented.
The first scenario was read aloud by the moderator,
with a copy of the text pasted in the chat of the on-
line meeting software. The volunteer then navigated
through the application and attempted to perform the
task required by the scenario. When the volunteer in-
VISAPP 2024 - 19th International Conference on Computer Vision Theory and Applications
622
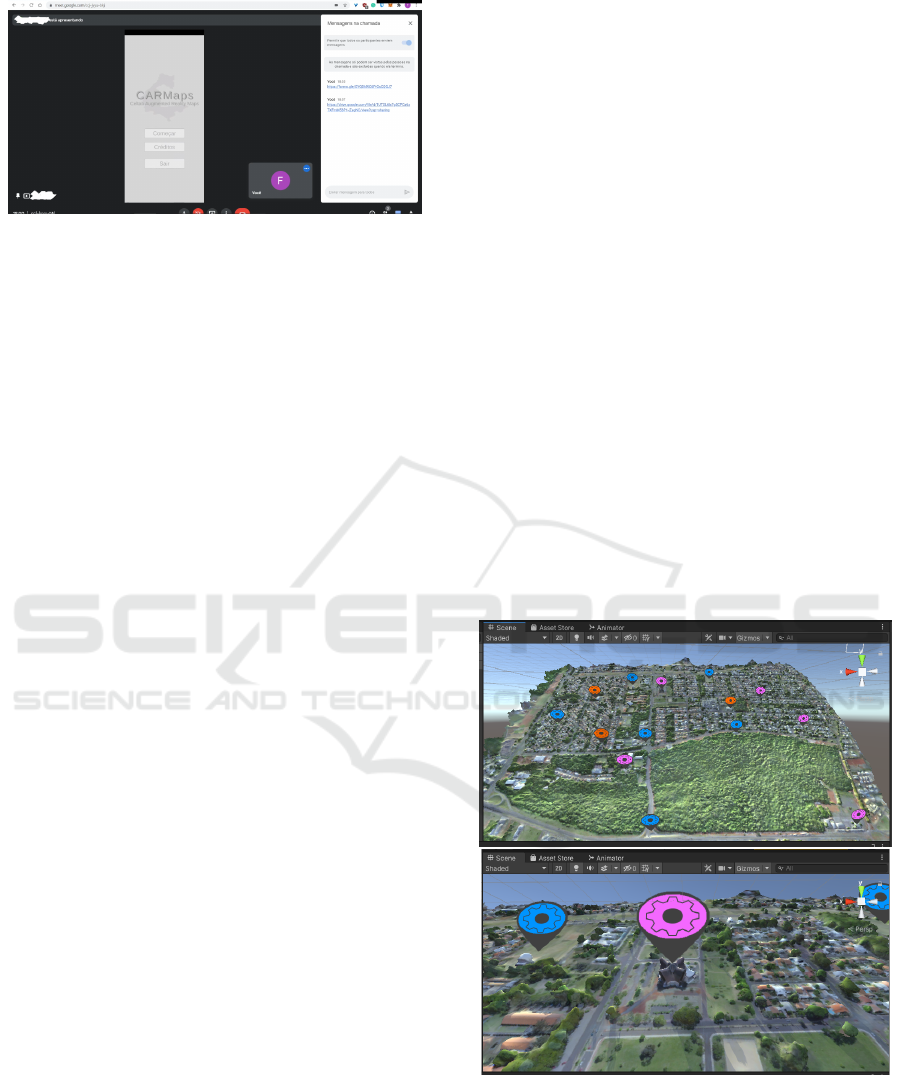
Figure 1: Screen shared by one of the participants (partici-
pant data hidden).
dicated that a scenario was completed, the moderator
was alerted, allowing the next one to be presented.
While executing the scenarios, the moderator ob-
served the volunteer’s screen, making notes of pos-
sible interaction problems that may have arisen or
points that should be addressed with the volunteer in
the form of questions asked after completing a task.
Upon completion of all scenarios, the moderator pre-
sented the post-test System Usability Scale question-
naire (SUS) to the volunteer, which helped understand
how usable the volunteer considered the application
used. The justification for choosing this form can be
observed in Section 5.2.
As a final step, a debriefing process was initi-
ated, with the moderator reinforcing various topics
discussed before, during, and after the test, and pro-
viding an opportunity for any questions and curiosi-
ties the volunteer might have about the process.
3.3 Data Analysis
The recorded interviews were watched, allowing for
the supplementation of notes made during the online
synchronous process. These data were organized in
the format of a report, taking into account two main
factors: the severity of the problem and the number
of volunteers who encountered the same difficulties
during the use of the application.
The obtained results were transformed into adjec-
tive ratings and acceptance categories. This transfor-
mation aided in the interpretation of the results pre-
sented in Section 6.3.2.
4 DEVELOPMENT
A functional prototype of an application for display-
ing 3D maps generated by drones using AR was re-
quested by the Latin American Center for Open Tech-
nologies (b), one of the research centers at the Itaipu
Technological Park (PTI). The initial goal was to
use this application in meetings related to smart city
projects, where participants could freely navigate the
map and add markers to points of interest. Based on
these requirements, it was possible to develop a func-
tional prototype with the following features: I) Selec-
tion of a map for display; II) Addition of the selected
map to the real environment; III) Adding, editing, re-
moving, and moving points of interest on the map;
IV) Functionality on mobile devices, preferably An-
droid; V) Use of 3D maps generated by drones.
Since it was requested that the application be de-
veloped for mobile devices, using Unity’s AR Foun-
dation was a natural choice, as it functions as middle-
ware between Google’s AR Core and Apple’s ARKit
(Oufqir et al., 2020).
The first map provided by Celtab was created us-
ing the senseFly eBee Plus drone (SenseFly, 2021),
flying over the Vila A region in Foz do Iguac¸u. This
region serves as the pilot neighborhood for the im-
plementation of the Smart Cities project. It was nec-
essary to open and edit some basic settings of this
map, such as the textures that came separated from
the mesh and to centralize the map at the origin.
After the adjustments to the map, small tests were
possible using AR Foundation, including the proto-
typing of some buttons. Among these tests was the
addition of markers on the map, as shown in Figure 2.
Figure 2: Test of markers on the map.
Having obtained positive results with the tests, the
last stage involved building a basic screen flow, wich
was used as a guide for implementation in the Unity
3D game engine using the C# programming language.
The result of the implementation can be seen in Figure
3.
Evaluating the Usability of a 3D Map Visualizer Augmented Reality Application
623
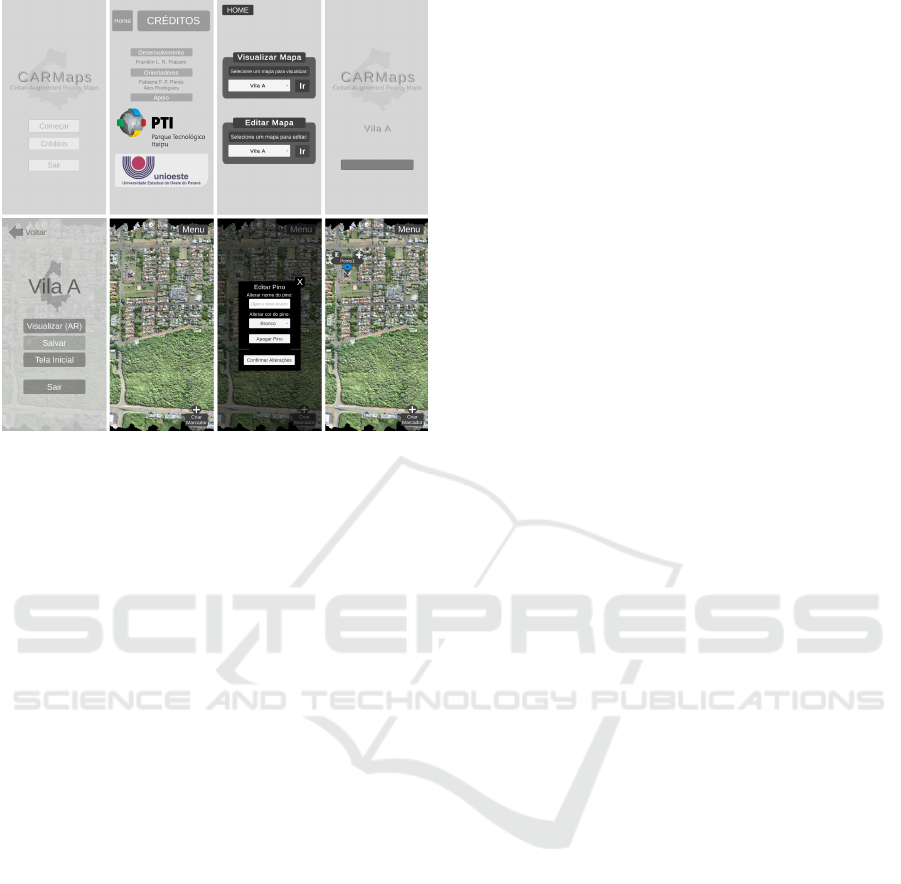
Figure 3: Implemented screens.
4.1 Issues Encountered
The implemented prototype worked as expected for
Celtab stakeholders. However, several new features
were requested. This presented some problems. The
first problem arose because the inicial intention was
only to create a functional prototype and, based on it,
conduct a feasibility analysis and a more in-depth re-
quirements gathering to eventually initiate the project.
Therefore, continuing development without a defined
plan could result in an application that does not meet
the needs of its users. A second problem was related
to the usability of the application. Despite approval
from the stakeholders, no end users participated in
the design decisions, which were made unilaterally.
Continuing the development of the prototype without
feedback from these users could result in an applica-
tion with all implemented features but none of them
being actually usable.
To address these problems, firstly, a development
plan based on some parts of the unified process was
adopted (Pressman and Maxim, 2020) . This allowed
organizing the project requirements, prioritizing the
next features to be implemented and placing the ap-
plication development in an iterative and incremental
cycle. With a defined development methodology, a
solution was found for the usability issue. As men-
tioned by (Barnum, 2020; Nielsen, 1993; Rubin et al.,
2008), one of the best approaches to quickly discover
usability issues from user feedback is the application
of informal iterative usability tests.
5 USABILITY TESTS
The process moved directly to the creation of user
profiles and the definition of which techniques would
be used to conduct informal usability tests to discover
problems.
It is common to conduct tests in person. However,
due to the continued social isolation during the Covid
pandemic, any type of in-person testing would put
participants at risk. Synchronous remote tests were
favored over asynchronous due to the possible need
to ask additional questions to a participant after the
execution of a scenario.
As recommended by various authors (Barnum,
2020; Lewis, 2012; Rubin et al., 2008), it was de-
cided that the Think-Aloud process would be used
during remote tests because it allows the moderator
to understand the participants’ decision-making pro-
cess, which aids in the discovery of potential errors.
5.1 User Profiles
The following characteristics formed the profile of
the application user that was tested: I) Previous
knowledge related to AR or VR; II) Own mobile de-
vice compatible with Google Play Services for AR;
III) Mobile device used for tasks related to their
work/activity; IV) Stable internet connection; V)
Users over the age of 18.
5.2 Questionnaires
The next step in usability test planning was to de-
fine which questionnaires would be applied at which
stages. First, a pre-test questionnaire was necessary to
collect participant information relevant to the study.
Following the question standards present in a pre-test
questionnaire proposed by (Barnum, 2020), it was
possible to develop a questionnaire that would collect
specific participant data.
A post-task questionnaire was not used due to the
test configuration allowing questions to be posed to
participants after the completion of each task.
For the post-test questionnaire, it was decided to
apply the SUS questionnaire (Brooke, 1995), as it al-
lows the collection of qualitative data related to the
user’s opinion (Lewis, 2018). It is also a powerful
tool for understanding the evolution of user opinions
regarding apparent usability between iterations. As a
technology-agnostic questionnaire, there was no need
to adapt its questions, applying a translated version
provided by (Geraldes et al., 2019; da Costa et al.,
2021).
VISAPP 2024 - 19th International Conference on Computer Vision Theory and Applications
624
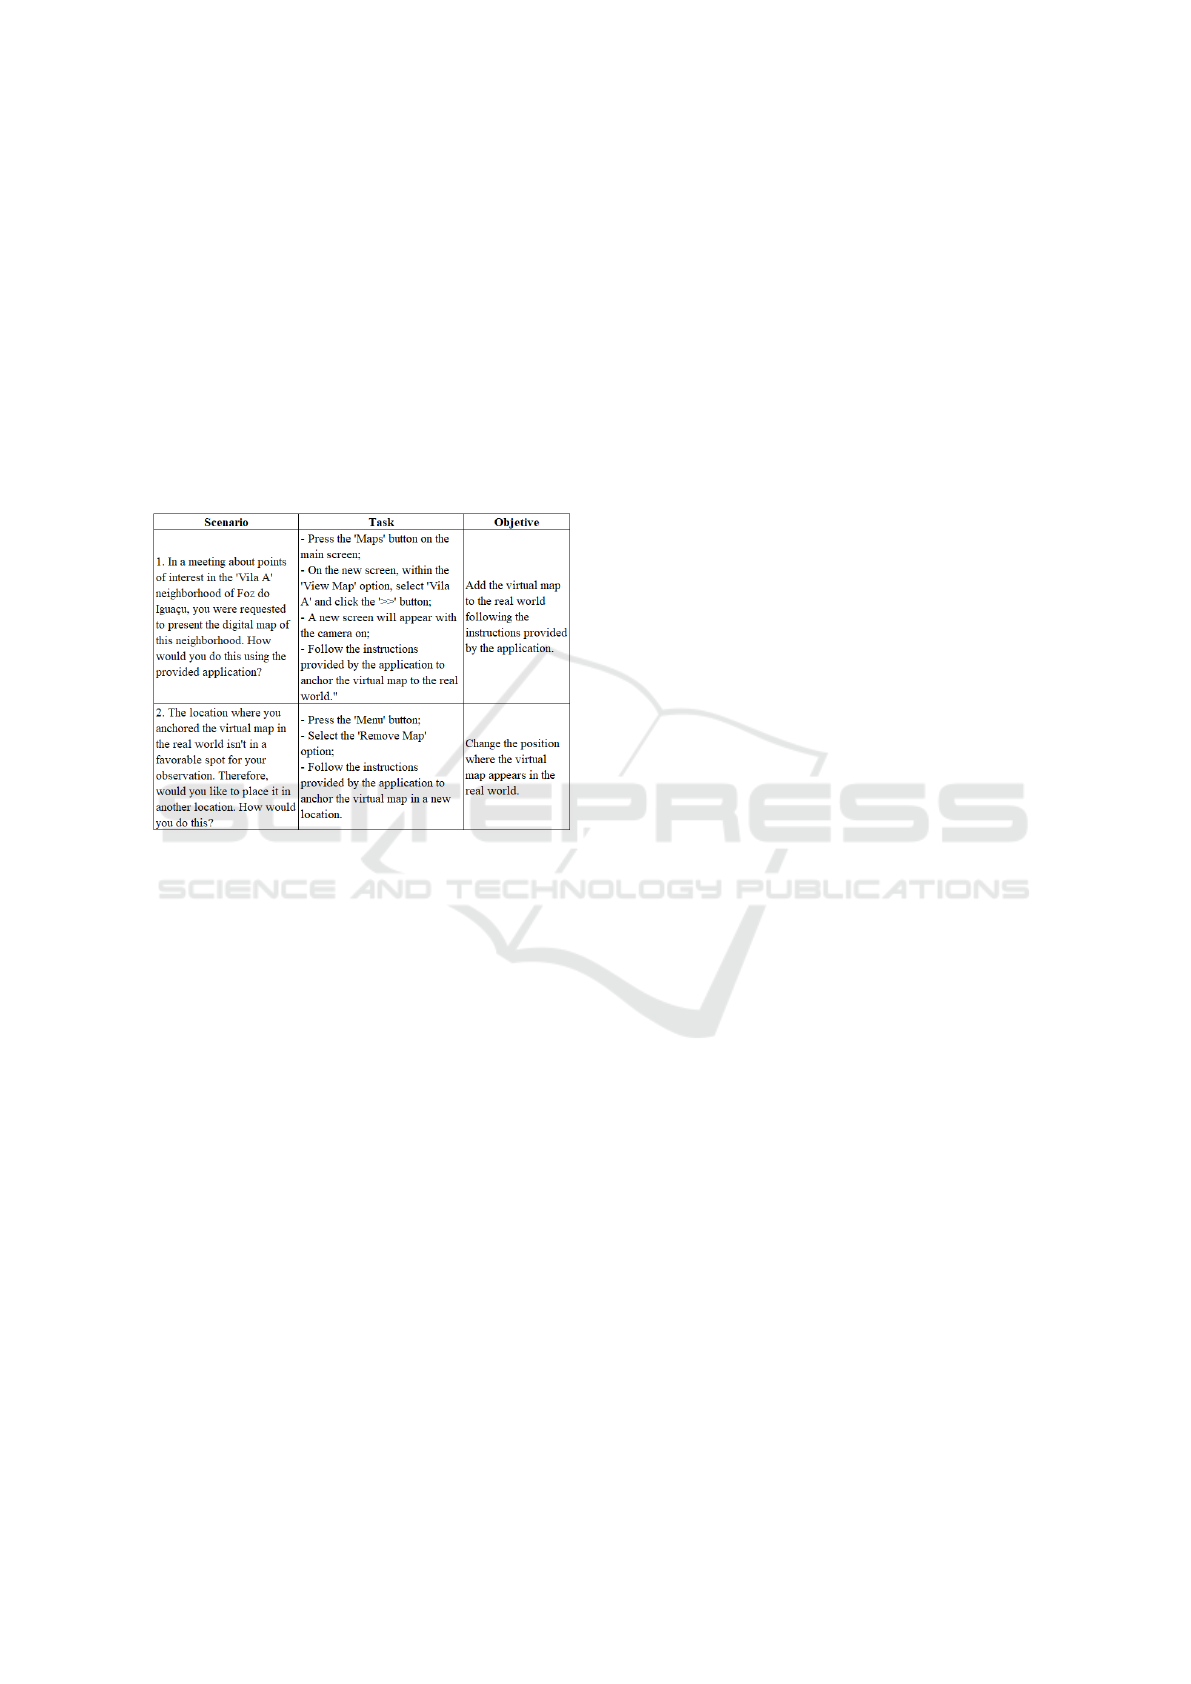
5.3 Scenarios and Tasks
Based on the prototype used in the tests and the imple-
mented features, a list of various scenarios that partic-
ipants executed during the tests was created. This list
includes a description of tasks and the objective of
each scenario, totaling eight scenarios. Examples of
these scenarios can be observed in Figure 4. Despite
the numbering, the first scenario was not number one
but a scenario consisting of the following question:
”What do you think you can do here?” This allowed
capturing participants’ initial impressions of the ap-
plication.
Figure 4: Example of scenarios, tasks, and objectives.
5.4 Tests in Development Cycle I
All previous steps helped plan the insertion of three
usability tests, after each of the three development cy-
cles. Iteration I corresponded to the functional proto-
type already developed with the prototype being used
in Usability Tests I, and the feedback from this test
stage was used to correct application problems in It-
eration II, leading to Usability Tests II, and so on until
the three test stages were completed.
5.5 Recruitment of Participants
The final step before executing any test consisted of
recruiting participants. At this stage, it should be con-
sidered that the target audience of the application was
still people with experience in AR/VR applications.
Therefore, only five participants were chosen.
There was a change in the target audience of the
application shortly after the execution of the first iter-
ation of usability tests, resulting in the modification of
the original test plan (Section 5.6). This change was
prompted by the presentation of the functional proto-
type to one managers. Thus, it was considered ideal
for the application not to be restricted only to peo-
ple with experience in AR/VR applications but to be
usable by anyone participating in meetings requiring
the sharing of information on a map. To meet this de-
mand, a new recruitment process had to be executed.
This way, five more participants were selected.
5.6 Modified Test Plan
The decision to conduct the first usability test with
two user subgroups resulted in changes in the inser-
tion of usability tests into the development cycle.
With the increase in the sample from five to ten
participants, it was necessary to recruit five more vol-
unteers. The application has been updated to cater
to these two subgroups, which would require more
time than was available for this study. Thus, the study
was concluded with only one iteration of tests in the
development cycle, where the results of the first and
second usability tests conducted were combined, al-
lowing coverage of the two subgroups present in the
study.
6 TESTS AND ANALYSIS
6.1 Application of the First Test
The first test took place with five volunteers represent-
ing the subgroup with experience in AR or VR. It is
worth noting that of the five participants in this stage,
only one identified as female.
Four of the tests occurred without major issues;
however, one participant’s device proved to be incom-
patible with the application. Fortunately, they could
borrow a compatible mobile device from a family
member.
Regarding the first conducted test, the following
issues were identified:
• Moderate Problems Found: I) Zoom speed in
the point of interest editing module is too fast for
three out of the five participants; II) Movement
speed in the X and Y axes in the point of inter-
est editing module is considered too fast for three
out of the five participants; III) First interaction
with the add markers button in the point of interest
editing module is not intuitive. IV) Font used on
the marker editing button is not intuitive enough;
some participants took too long to find the option
to edit a marker. Two participants had difficulty
finding the marker editing button, and one partici-
pant could not complete the scenario that included
the task of editing a marker without the help of the
Evaluating the Usability of a 3D Map Visualizer Augmented Reality Application
625

moderator; V) Difficulty displaying the name of
the marker in the AR module of the application;
two participants had to click two or three times on
a marker for their touch to be registered.
• Minor Problems Found: I) In the prototype, an-
imations that guide the user on what to do to add
a map to the real world contain English words,
making it difficult for one participant to under-
stand. This error was considered minor because
these animations are temporary and would not be
used in the final version of the application in any
way. However, it is worth noting that the use of
English terms can complicate the use of the appli-
cation; II) Some windows use a black color, which
contrasts with the gray used in other screens. This
problem is quite noticeable in the marker editing
window. One participant pointed out this issue;
III) The animation indicating that the mobile de-
vice has started the process of tracking the par-
ticipant’s environment tends to disappear quickly
on some devices, a problem related to process-
ing speed. Two participants drew attention to this
rapid disappearance.
No severe errors were reported by the participants
during the test execution.
6.2 Application of the Second Test
The second part of the tests took place with five vol-
unteers representing the subgroup with low or no fa-
miliarity with AR or VR.
An initial problem before the start of the test, as
reported by three participants, was the initial diffi-
culty in installing the application, running it, and si-
multaneously starting the screen sharing. After a few
minutes of assistance with these configurations, it was
possible to proceed with the test plan.
Regarding the second conducted test, the follow-
ing problems were identified:
• Serious Problems Found: I)Lack of an inte-
grated tutorial in the application’s features, mean-
ing, the first time a user uses any part of the ap-
plication, it should be possible to provide a tuto-
rial that guides and teaches them practically how
to add a map to the real world and how to add
markers in the map editing module. All partici-
pants in this test had difficulties following the pro-
vided scenarios because they lacked knowledge of
how certain AR concepts and the application it-
self worked; II)Lack of an FAQ that allows the
user to better understand how relevant AR con-
cepts work and addresses frequently asked ques-
tions that were not resolved during the guided tu-
torial. Four participants mentioned that some ap-
plications have a section of questions and answers
where various doubts can be clarified, and having
a similar functionality might help them solve their
doubts with greater autonomy; III) Similar to par-
ticipants in the first usability test, participants in
this subgroup also had difficulty adding a marker
to the map in the map editing module. Two partic-
ipants managed to understand the button’s opera-
tion after a few attempts, one participant couldn’t
complete this task and had to ask the moderator
for help, and two participants ended up repeatedly
clicking the add marker button until a consider-
able number of buttons appeared around it, requir-
ing the application to be restarted. IV) Unlike par-
ticipants in the first group, this group had greater
difficulty performing actions that allowed them to
manipulate the map in the marker editing module.
One participant even accidentally discovered that
trying to force movement on the x-axis beyond the
maximum allowed made the map jump for a brief
moment.
• Moderate Problems Found: i) Similar to par-
ticipants in the first group, three participants had
difficulty understanding the instructions given by
the animations indicating to the user what needs
to be done to add a map to the real world in En-
glish. This time, this error was considered mod-
erate because the number of affected users in-
creased; therefore, this error should be prioritized
for fixing right after addressing the serious errors;
II) There was difficulty displaying the name of the
marker in the AR module of the application, sim-
ilarly to what happened in the initial tests. How-
ever, this time, three participants had to click two
or three times on a marker for their touch to be
registered on the 3D object anchored in the real
world.
• Minor Problems Found: I) Two participants
raised the issue that the amount of zoom available
in the marker editing module should be greater,
or a magnifying glass functionality should be of-
fered; II) The chosen location for one of the par-
ticipants to perform the test did not have sufficient
size to display the 3D map that is anchored. III)
Two participants experienced some performance
issues on their mobile devices. Due to the AR
Foundation’s plane tracking never being able to be
fully deactivated, even with the object anchored,
the framework continued to update and expand the
detected planes.
VISAPP 2024 - 19th International Conference on Computer Vision Theory and Applications
626

6.3 Analysis of Questionnaires
With the conclusion of the tests, it was possible to be-
gin the data analysis phase, including, in some cases,
the need to watch the test recordings to complement
the notes taken during the tests and ensure that no
problems went unnoticed.
Part of the analysis of the questionnaires was car-
ried out considering the tests with the two subgroups
as just one group representing the target audience of
the application. However, in some instances, it was
considered relevant to point out the differences in the
results found between the two subgroups.
6.3.1 Pre-Test Questionnaire
The first data collected with the pre-test questionnaire
was the age of the participants. Despite some outliers,
most participants have a very similar age. Future stud-
ies could attempt to recruit participants of older age,
allowing for greater diversity of opinions.
The second piece of data obtained from the pre-
test questionnaire is the gender of the participants. Al-
though the study did not achieve an equal number of
male and female participants, it came close, with 40%
female and 60% Male.
The educational level reported by the participants
also shows a concerning result in the overrepresen-
tation of students with incomplete higher education
(70% had incomplete higher education, 20% had
completed higher education and 10% completed high
school). This occurred because of the ease of recruit-
ing users with this characteristic, although they are
part of the target audience of the application, a more
diverse group could have resulted in different issues
being discovered.
All study participants used their mobile device for
communication (32%) and social media (32%), with
the third most frequently reported usage being for
leisure (26%). All participants indicated that they use
or have used their mobile device for work.
6.3.2 Post-Test Questionnaire - SUS
Calculating the results of the SUS questionnaire, it
was evident that Subgroup I (SD 8.4039 and Mean
89) obtained higher results compared to Subgroup II
(SD 5.7009 and Mean 69.5).
Using different ways to present the SUS results,
the results were transformed into adjectives and opin-
ions of acceptance. The two most prevalent opin-
ions indicate that the apparent usability of the applica-
tion is excellent (four participants from the first sub-
group) and reasonable (four participants from the sec-
ond subgroup), with a minority (one participant from
each subgroup) indicating it is good.
Regarding acceptance, the system’s apparent us-
ability was deemed acceptable by 60% of the partici-
pants, while 40% considered it marginally acceptable,
meaning it was deemed acceptable but with reserva-
tions or areas identified for correction. These out-
comes underscore the severity of the issues encoun-
tered during the tests involving Subgroup II.
By employing the SUS assessment for adjec-
tives and acceptance across the average outcomes of
each subgroup and their combined data, a perception
emerges that the apparent usability is deemed good
and acceptable when both subgroups are treated as a
single entity. However, this overall impression over-
looks the challenges encountered specifically by Sub-
group II during the testing phase. Consequently, it is
advised that the forthcoming iterations of the product
prioritize the resolution or reduction of these issues.
This strategic focus is likely to lead to an improved
perception of the product’s usability.
6.3.3 Action Plan
Based on the results obtained, it was possible to de-
velop an action plan that should be executed in the
next development iteration of the application. Consid-
ering the problems affecting Subgroup II, there should
be a focus on resolving two of the severe issues af-
fecting them: the lack of a guided tutorial and a FAQ
section. The following steps are recommended:
• Guided Tutorial: I) Analyze the need for creat-
ing a specific module for the guided tutorial or if
it can be integrated into the already implemented
modules. This analysis will help understand the
time and effort required to complete the integra-
tion of this functionality. II) Low-fidelity screen
prototypes based on the analysis results should be
constructed, i.e., prototype modifications to exist-
ing modules or the entire new module. III)
• FAQ: I) Integrating an FAQ will require modi-
fying the existing menus by adding a button that
opens a window with available questions and an-
swers. II) A low-fidelity screen prototype should
be built for the FAQ screen. In it, the need for a
search field and its placement should be analyzed.
III) Develop possible questions and answers for
issues that users may encounter during the appli-
cation’s use. Avoid delving into extremely techni-
cal details, striving to present answers simply and
concisely. If it is genuinely necessary to provide
more details, indicate links to websites/articles.
This action plan does not consider possible new
functionalities that may be integrated simultaneously
with the corrections. However, by focusing on the
Evaluating the Usability of a 3D Map Visualizer Augmented Reality Application
627

problems presented by Subgroup II, it is expected to
equalize the perceived usability between the two sub-
groups in future usability tests. This equalization can
be observed by comparing the SUS results from the
tests conducted in this iteration with those conducted
after the implementation of the modifications.
7 CONCLUSION
Throughout this study, numerous adaptations were
made to overcome challenges, ultimately highlight-
ing the profound impact of user feedback on project
success. While some identified issues were already
known, confirming their significance to users under-
scored the need for consideration and prioritization.
With the completion of the initial usability test, the
development process advanced addressing the prob-
lems identified. Subsequent tests, involving partici-
pants from the two main subgroups, enabled a com-
parative analysis of SUS questionnaire results. This
approach provided valuable insights into the evolving
perception of application usability and revealed latent
issues overshadowed by severe problems.
The positive response from usability test partic-
ipants towards AR highlight its value, demonstrating
its potential to generate interest and engagement. This
aligns with the broader importance of immersive tech-
nologies in capturing user attention. The effectiveness
of usability evaluation tools like the SUS was evident
in uncovering valuable insights, emphasizing the piv-
otal role of systematic testing methodologies in refin-
ing applications.
Considering questions about the necessity of AR
in this context, a future study could explore an ap-
plication with similar objectives but without the AR
component. A comparative analysis between the orig-
inal app and the AR-free version could elucidate user
preferences, guiding decisions on the inclusion of AR
modules.
ACKNOWLEDGEMENTS
We express our gratitude to PTI for their contribution
in providing the drone-generated 3D map data. We
appreciate their commitment to fostering research and
innovation in technology.
REFERENCES
Barnum, C. (2020). Usability Testing Essentials: Ready,
Set. . . Test!
Brooke, J. (1995). Sus: A quick and dirty usability scale.
Usability Eval. Ind., 189.
Bruun, A., Gull, P., Hofmeister, L., and Stage, J. (2009). Let
your users do the testing: A comparison of three re-
mote asynchronous usability testing methods. In Pro-
ceedings of the SIGCHI Conference on Human Fac-
tors in Computing Systems, CHI ’09, page 1619–1628,
New York, NY, USA. Association for Computing Ma-
chinery.
da Costa, R. P., dos Santos, A. F. S., and Santiago,
C. P. (2021). An
´
alise de usabilidade do sistema q-
acad
ˆ
emico utilizando o m
´
etodo system usability scale
(sus): Um estudo de caso. In Anais do XIV Encontro
Unificado de Computac¸
˜
ao do Piau
´
ı e XI Simp
´
osio de
Sistemas de Informac¸
˜
ao, pages 231–238. SBC.
Geraldes, W. B., Martins, E. R., and Afonseca, U. R.
(2019). Avaliac¸
˜
ao da usabilidade do scratch utilizando
o m
´
etodo system usability scale (sus). In Anais da
X Escola Regional de Inform
´
atica de Mato Grosso,
pages 25–30. SBC.
Ghasemifard, N., Shamsi, M., Kenar, A., and Ahmadi, V.
(2015). A new view at usability test methods of inter-
faces for human computer interaction. Global Journal
of Computer Science and Technology, 15(1).
Gupta, S. (2015). A comparative study of usability eval-
uation methods. International Journal of Computer
Trends and Technology, 22(3).
Lewis, J. (2012). Usability Testing.
Lewis, J. R. (2018). The system usability scale: Past,
present, and future. International Journal of Hu-
man–Computer Interaction, 34(7):577–590.
Merino, L., Schwarzl, M., Kraus, M., Sedlmair, M.,
Schmalstieg, D., and Weiskopf, D. (2020). Evaluat-
ing mixed and augmented reality: A systematic lit-
erature review (2009-2019). In 2020 IEEE Interna-
tional Symposium on Mixed and Augmented Reality
(ISMAR), pages 438–451.
Nielsen, J. (1993). Usability Engineering.
Oufqir, Z., El Abderrahmani, A., and Satori, K. (2020).
Arkit and arcore in serve to augmented reality. In 2020
International Conference on Intelligent Systems and
Computer Vision (ISCV), pages 1–7.
Pressman, R. S. and Maxim, B. (2020). Software engineer-
ing: a practitioner’s approach. McGraw-Hill Educa-
tion.
Rubin, J., Chisnell, D., and Spool, J. (2008). Handbook of
Usability Testing - How to Plan, Design, and Conduct
Effective Tests.
SenseFly (2021). senseFly – The Professional’s Mapping
Drone. D
´
ıspon
´
ıvel em: https://www.sensefly.com/.
Acesso em: 05 de mar. de 2021.
Stull, E. (2018). UX Fundamentals for Non-UX Profession-
als: User Experience Principles for Managers, Writ-
ers, Designers, and Developers.
Tori, R. and Hounsell, M. d. S. (2020). Introduc¸ao a reali-
dade virtual e aumentada. Porto Alegre: Editora SBC.
VISAPP 2024 - 19th International Conference on Computer Vision Theory and Applications
628
