SMT: A High-Performance Approach for Counting Kmers
Jader M. C. Garbelini
1 a
, Danilo Sipoli Sanches
2 b
, Andr
´
e Yoshiaki Kashiwabara
2 c
and Aurora T. R. Pozo
1 d
1
Federal University of Paran
´
a, Curitiba, Brazil
2
Federal University of Technology, Corn
´
elio Proc
´
opio, Brazil
Keywords:
Kmers, Motifs, Sequence Analysis, Optimization.
Abstract:
Motivation: Finding conserved motifs in DNA sequences is a key problem in bioinformatics. The growing
availability of large-scale genomic data poses significant challenges for computational biology, particularly
in terms of efficiency in analysis, kmer identification, and noise presence. The detection of conserved motifs
and patterns in DNA sequences is determinant for understanding gene functions and regulations. Therefore,
it is essential to develop a novel approaches and methods that can handle these large volumes of information
and provide accurate and fast results. Results: We present SMT, an innovative tool designed to efficiently
store and count kmers, optimizing memory usage and computation time. The application of SMT has also
proven effective in discovering motifs in CHIP-SEQ data, allowing the identification of conserved regions in
sequences. Furthermore, SMT allows exact searches in constant time proportional to the size of k and retrieves
the most abundant kmers through a frequency table. This approach facilitates large-scale data analysis and
provides important insights into the conserved properties of biological sequences. The application of SMT in
motif discovery demonstrates its potential to drive research in bioinformatics and genomics. Availability and
implementation: Supplementary data and results are available to provide additional information and support
the conclusions. SMT and source code can be found at the following address: https://github.com/jadermcg/smt.
1 BACKGROUND
In recent years, there has been an exponential increase
in the amount of available genomic data, thanks to
advances in DNA and RNA sequencing technologies.
The detection of motifs and conserved patterns in se-
quences is important for understanding gene func-
tions and regulations, as well as for identifying func-
tional and structural elements of the genome (Good-
win et al., 2016). To date, various data structures and
algorithms have been proposed to deal with the in-
creasing demand for efficient large-scale kmer anal-
ysis. However, many of these solutions are not
sufficiently fast or require significant computational
resources, which limits their applicability to ever-
growing genomic datasets (Deorowicz et al., 2019)
(Marchet et al., 2019).
In this context, we introduce the Sparse Motif
Tree (SMT), an innovative tool specifically designed
a
https://orcid.org/0000-0003-2289-882X
b
https://orcid.org/0000-0002-8972-5221
c
https://orcid.org/0000-0003-3280-2035
d
https://orcid.org/0000-0001-5808-3919
to store and count kmers efficiently. SMT optimizes
memory usage and computation time, allowing for
the rapid and accurate analysis of large volumes of
genomic data. SMT also allows histograms in hash
table format to be extracted from your database ef-
ficiently. These features enable researchers to iden-
tify recurring patterns and conserved regions within
sequences, as well as analyze variations within DNA
and RNA sequences.
Therefore, SMT is particularly useful in the prob-
lem of motif discovery, a central challenge in bioin-
formatics and genomics (Bailey et al., 2015). De-
tecting conserved sequences and recurring patterns in
DNA and RNA sequences is a key task for identifying
functional elements and understanding gene regula-
tion in different organisms. The efficiency and versa-
tility of the SMT allows researchers to quickly analyze
large genomic datasets and accurately identify biolog-
ically relevant regions with precision and reliability.
The results obtained suggest that SMT and the
developed algorithms have great potential to count
kmers efficiently and facilitate the analysis of CHIP-
SEQ and others types of massive data. This work con-
Garbelini, J., Sanches, D., Kashiwabara, A. and Pozo, A.
SMT: A High-Performance Approach for Counting Kmers.
DOI: 10.5220/0012546500003657
Paper published under CC license (CC BY-NC-ND 4.0)
In Proceedings of the 17th International Joint Conference on Biomedical Engineering Systems and Technologies (BIOSTEC 2024) - Volume 1, pages 545-552
ISBN: 978-989-758-688-0; ISSN: 2184-4305
Proceedings Copyright © 2024 by SCITEPRESS – Science and Technology Publications, Lda.
545

tributes to the development of new tools and methods
to address the challenge of finding conserved regions
and opens new perspectives for the analysis of molec-
ular biology data. In addition to its application in mo-
tif discovery, SMT can also be used in several other
contexts within bioinformatics and genomics, such as
comparative genome analysis, identification of func-
tional elements in sequences, study of genetic varia-
tions and metagenomics (Wood et al., 2019), (Chais-
son et al., 2019). SMT’s versatility and efficiency
make it a valuable tool for researchers looking for
scalable, high-performance solutions to handle large-
scale genomic data analysis.
In this paper, we described the architecture and
implementation of SMT. In addition, we discussed the
potential of SMT to boost research in bioinformatics
and genomics, helping researchers to explore and un-
derstand the complexity and diversity of genomes of
different organisms. In the supplementary materials,
we provide the pseudocode of the algorithms, some
complexity analysis and also demonstrate a practical
application of SMT in discovering biological motifs.
The remainder of this paper is organized as follows:
In Section 2, we delineate the workings and software
implementation of SMT, along with the description of
its key satellite algorithms. In Section 3, we present
the outcomes of comparing SMT with other state-of-
the-art algorithms. Finally, in Section 5, we draw final
considerations regarding the paper.
2 IMPLEMENTATION
SMT was developed with the primary objective of
minimizing RAM memory consumption, thereby en-
abling the process execution on computers with mod-
est specifications. The optimization of memory usage
is achieved through efficient compression strategies
and a high-performance sparse data structure, which
together provide a robust solution without requiring
high-capacity hardware. This approach democratizes
access to genomic data analysis, allowing researchers
and professionals with limited hardware resources to
perform complex analyses without the need for sig-
nificant investments in IT infrastructure.
Our method employs the divide and conquer strat-
egy to efficiently handle large genomic datasets. This
approach breaks down the original data into smaller
subsets, allowing the parallel and independent analy-
sis of each segment. By dividing the initial problem
into more manageable parts, the divide and conquer
strategy facilitates the identification and counting of
kmers in a more effective and scalable manner.
SMT is represented through a two-dimensional
data structure, implemented from text fragments of
the same width. It was lightly inspired by the the-
ory of ROOM squares(Archbold and Johnson, 1958),
in which each element M
i, j
is either empty or holds
a set value between 1 and ν. In this manner, each
row of M represents a node 1, 2, 3, . . . , ν of the tree,
columns 1 to 4 represent the nucleotides A, C, G, T,
and the last column stores the count of the fragments.
SMT support different types of efficient queries, such
as KSEARCH, HMAP and, KDIVE. The KSEARCH was
designed to perform exact searches in the SMT, re-
turning the existence of a specific kmer as well as its
respective count. This algorithm is optimized to cap-
italize on the hierarchical tree structure, allowing an
efficient and precise search, with the execution time
complexity being linear in relation to the size of the
k-mer (O(k)).
HMAP was devised to swiftly extract a map con-
taining all the kmers and their respective frequencies
from the SMT. The efficiency and speed of HMAP are
attributed to its direct execution on the SMT tree struc-
ture, which facilitates organized access and recovery
of kmers and their counts. This approach leverages
the hierarchical and organized nature of the SMT, al-
lowing for efficient traversal of the tree to compile
the kmer map. Furthermore, HMAP employs libraries
to parallelize the reads and insertions into the shared
hash structure, contributing to faster execution. The
synergy between the tree structure of the SMT and the
efficient execution of HMAP results in a powerful tool
that provides quick and precise extraction of the kmer
map, thus facilitating subsequent genomic analyses.
SMT is especially notable when compared to other
structures, such as JELLYFISH (Marc¸ais and Kings-
ford, 2011) and KANALYZE (Audano and Vannberg,
2014). It is important to highlight that although the
first version of Jellyfish was released in 2011, its de-
velopment is constant and the last update of this algo-
rithm corresponding to version 2.3.1 was carried out
in December 2023. Among the algorithms operating
on the SMT, KDIVE stands out primarily from the per-
spective of motif analysis. This algorithm was de-
signed with the purpose of performing agile searches
for text fragments in the SMT, even when these con-
tain up to d mutations. In other words, KDIVE was
developed to return a positive search result even if the
search string exhibits up to d mismatches. An impor-
tant aspect to highlight is that the algorithm is predi-
cated on the assumption that the probability of a mis-
match is uniform for any point of the sequence.
BIOINFORMATICS 2024 - 15th International Conference on Bioinformatics Models, Methods and Algorithms
546

3 RESULTS AND DISCUSSION
In this section, we will present the results obtained
from the evaluation and analysis of SMT, in compar-
ison with the JELLYFISH and KANALIZE algorithms.
These comparisons were important to validate the ef-
ficacy and efficiency of SMT in the context of genomic
data processing and analysis. The comparative anal-
ysis allows corroborating the superior performance
of SMT in various scenarios and also highlighting its
distinctive features that contribute to its high perfor-
mance and flexibility in handling kmers. Throughout
this section, we will discuss the methodological as-
pects of the tests carried out, as well as the metrics
employed for the evaluation of the data structures and
algorithms under study. The insights derived from
this analysis provide a deep understanding of the po-
tential of SMT as a robust and effective data structure
for analyzing large genomic data sets.
To evaluate the algorithms, all .bed files from the
JASPAR 2022 (Castro-Mondragon et al., 2022) repos-
itory were selected, relevant to CHIP-SEQ data with
more than 10.000 sequences, totaling 131 distinct data
sets. The algorithms were executed with values of k
ranging between 5 and 30. The monitoring of exe-
cution times and RAM consumption was carried out
through the command /usr/bin/time -v, available
in practically all LINUX/UNIX operating systems. All
tests on the Linux Ubuntu 22.04.3 LTS operating sys-
tem, with equipment equipped with AMD EPYC 7B12
processors, 8 GB of RAM, and an internal clock of ap-
proximately 2250 GHz. For reproducibility purposes,
the following command line instructions were used:
1. SMT: smt -i <fasta file> -k <size of
kmer> -s 500
2. JELLYFISH: jellyfish count -m <size of
kmer> -s 500M
3. KANALYZE: kanalyze count -k <size of
kmer> -f fasta <fasta file>
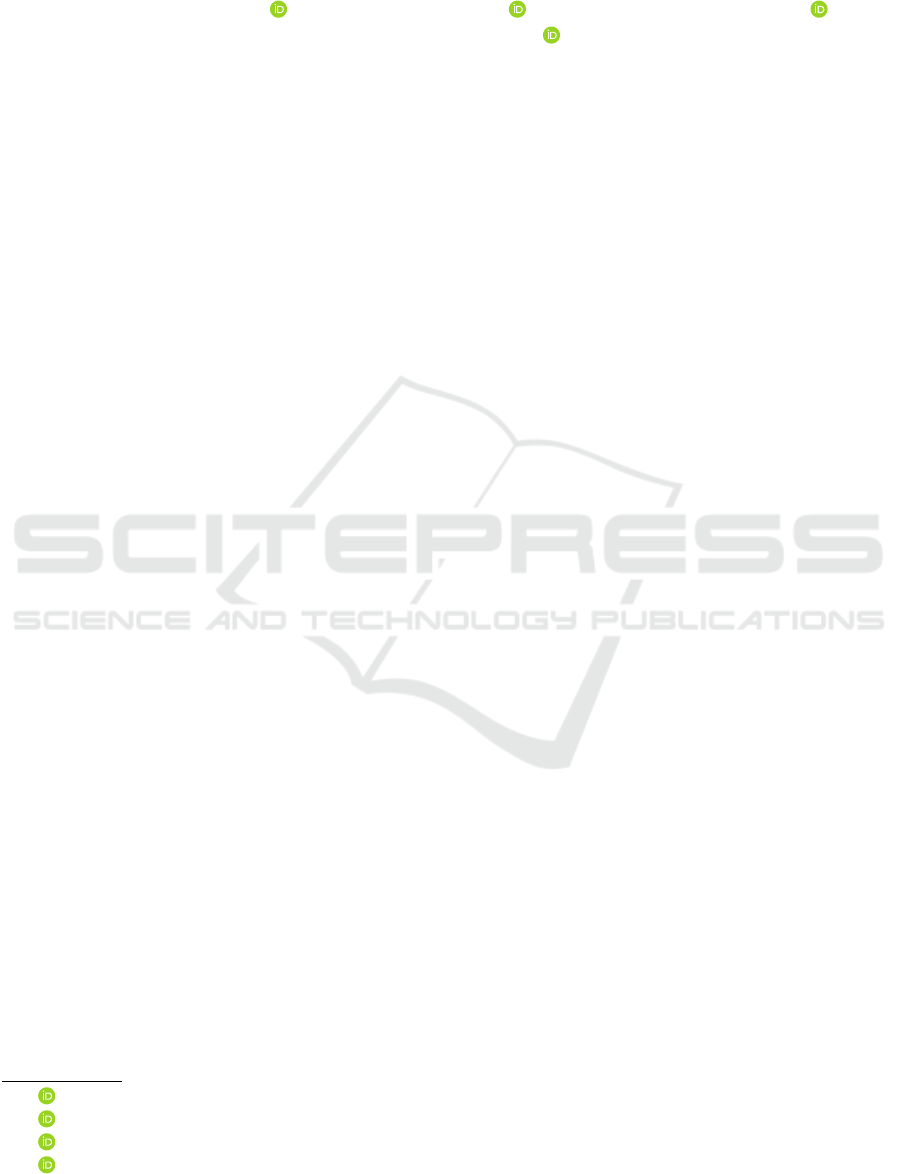
Figure 1 displays the average performance of the
algorithms considering all datasets and all values of k.
In the upper left part of this figure, illustrating RAM
consumption, it is observed that the JELLYFISH algo-
rithm requires considerably more memory compared
to the other two. Specifically, it consumes about 1000
Mb, while KANALYZE consumes approximately 250
Mb and SMT uses about 50 Mb. In the upper right
graph, depicting time (in seconds), KANALYZE shows
the longest execution time, reaching about 8 seconds.
JELLYFISH, in turn, takes approximately 2 seconds,
while SMT shows the shortest time, close to 0.5 sec-
onds.
Continuing with Figure 1, observing the bottom-
left graph, we note that JELLYFISH has a median close
to 1400 Mb with outliers exceeding 3000 Mb. KAN-
ALYZE has its median around 300 Mb, with peaks
reaching almost 2000 Mb. Conversely, SMT main-
tains lower consumption, with a median near 150 Mb
and outliers close to 3000 Mb. In the bottom-right
graph, JELLYFISH shows low dispersion with its me-
dian surpassing 4 seconds. KANALYZE exhibits high
dispersion, with a median close to 7 seconds and out-
liers going beyond 55 seconds. SMT remains with the
best performance, with a median close to 0.5 seconds
and outliers nearing 18 seconds.
The analysis of the interquartile range (IIQ) for the
RAM consumption of the three algorithms reveals im-
portant insights about their dispersion. The JELLY-
FISH algorithm has the highest IIQ, with 2284 Mb,
indicating a significant variation in its RAM consump-
tion in the central half of the data. In contrast, KAN-
ALYZE and SMT have much lower IIQs, with 133 Mb
and 115 Mb, respectively. This suggests that while
JELLYFISH has a significant dispersion of RAM con-
sumption, KANALYZE and SMT show efficiency in
this aspect, at least in the central half of their distribu-
tions. These observations complement the analysis of
the execution time, where SMT stands out with a con-
siderably lower median time compared to the others.
Upon analyzing the interquartile range (IIQ) for
the execution time of the three algorithms, we can ex-
tract significant information regarding the variability
of each method. JELLYFISH displayed an IIQ of 4.19
seconds, indicating that the central half of its execu-
tion times varies around this range. KANALYZE has
a slightly higher IIQ, with 4.73 seconds, suggesting a
slightly larger variation in its central times compared
to JELLYFISH. SMT, on the other hand, exhibited an
IIQ of only 0.5 seconds, reflecting good consistency
in execution time.
Figure 2 illustrates the relationship between k-mer
size and two performance metrics: RAM consump-
tion and execution time for the algorithms JELLYFISH,
KANALYZE, and SMT. Regarding RAM consumption,
we observe that JELLYFISH shows an increasing con-
sumption relative to k-mer size, with a sharp increase
after 20 mers. Surprisingly, KANALYZE exhibits a
slight decrease in RAM consumption relative to k-mer
size. SMT, in turn, maintains an almost constant and
low consumption profile, irrespective of the k-mer
size.
Figure 3 displays the behavior of the algorithms
concerning RAM memory consumption, grouped by
k values. Generally, it’s observed that the SMT algo-
rithm tends to have a more compact distribution of
RAM usage, while JELLYFISH and KANALYZE exhibit
SMT: A High-Performance Approach for Counting Kmers
547
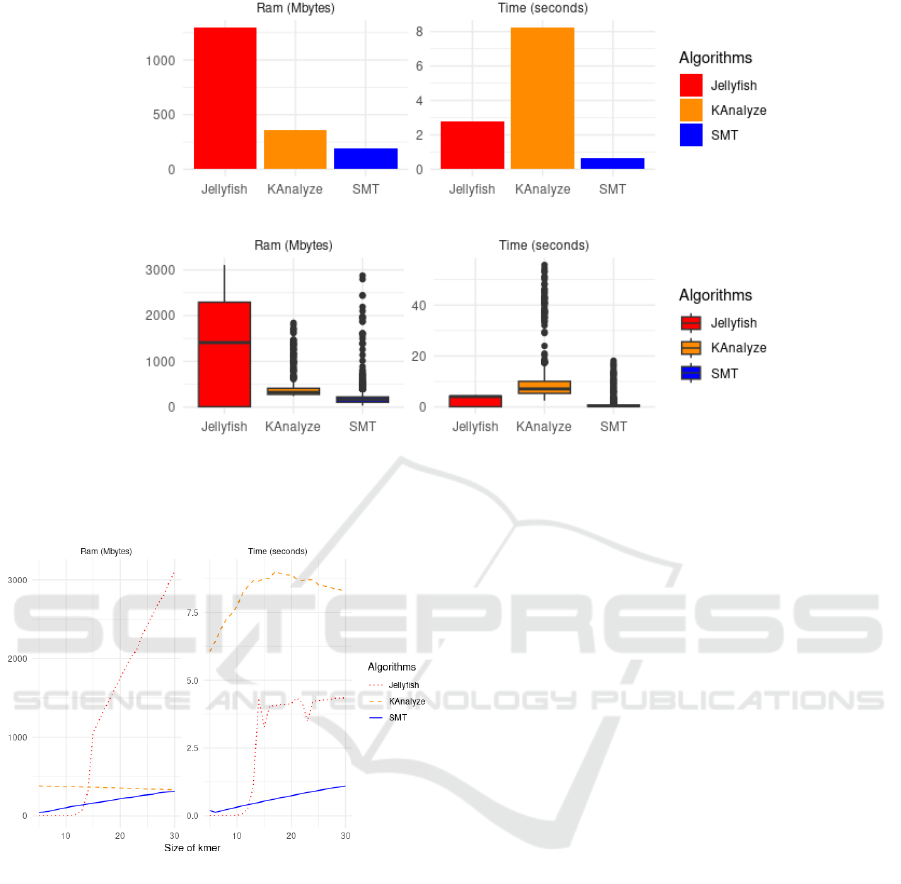
Figure 1: Comparative analysis among the algorithms SMT, JELLYFISH, and KANALYZE regarding RAM consumption (in
megabytes) and execution time (in seconds). (a) Average RAM consumption. (b) Average execution time. (c) Distribution of
RAM consumption, with median and outliers. (d) Distribution of execution time, with median and outliers. SMT proves to be
more efficient in both aspects compared to the other two algorithms.
Figure 2: Comparative analysis among the algorithms SMT,
JELLYFISH, and KANALYZE regarding RAM consumption
(in megabytes) and execution time (in seconds) for various
k sizes.
more pronounced variations. In particular, JELLYFISH
showed some peaks in RAM usage, especially in con-
figurations 8, 12, 15, and 26. In many scenarios, it
tends to use more RAM than the other two algorithms.
KANALYZE appears to have a more uniform varia-
tion of RAM usage compared to JELLYFISH, although
it still shows some oscillations. In some cases (such as
in configurations 11, 12, and 15), KANALYZE’s RAM
usage surpasses that of JELLYFISH and SMT. SMT
generally has the lowest RAM usage in almost all con-
figurations. However, in some situations (like 18 and
29), its RAM usage approaches or even surpasses the
other two algorithms.
Some configurations, like 7, 13, 21, and 25, show
a convergence in RAM usage among the three algo-
rithms, while others, like 8, 12, 15, and 26, exhibit
significant divergences between them. The SMT al-
gorithm, generally presented the lowest RAM usage
and displayed a more consistent and compact distri-
bution, while JELLYFISH and KANALYZE tend to be
more volatile.
Lastly, Figure 4 illustrates the temporal perfor-
mance of the algorithms across different k sizes, rang-
ing from 5 to 30. According to this figure, the algo-
rithms JELLYFISH and SMT display more consistent
temporal performance, with lesser variation. In most
cases, both showed execution times below 10 sec-
onds, with a slight advantage for JELLYFISH, as for
some k values, SMT exhibited times that surpassed
15 seconds. On the other hand, KANALIZE presents
higher execution times, which frequently approach or
reach the upper limit of 40 seconds. In almost all test
sets, KANALIZE has the longest execution time among
the three algorithms.
Table 1 provides a comparative analysis of aver-
age time and RAM memory consumption among three
tools: JELLYFISH, KANALYZE, and SMT, varying the
value of k from 5 to 30. It is evident that SMT per-
forms significantly better in terms of RAM memory
consumption compared to the other algorithms, while
maintaining a much lower execution time compared
to JELLYFISH as the size of k increases. The incre-
ment in execution time and RAM memory consump-
tion with the increase in k is more gradual in SMT,
BIOINFORMATICS 2024 - 15th International Conference on Bioinformatics Models, Methods and Algorithms
548
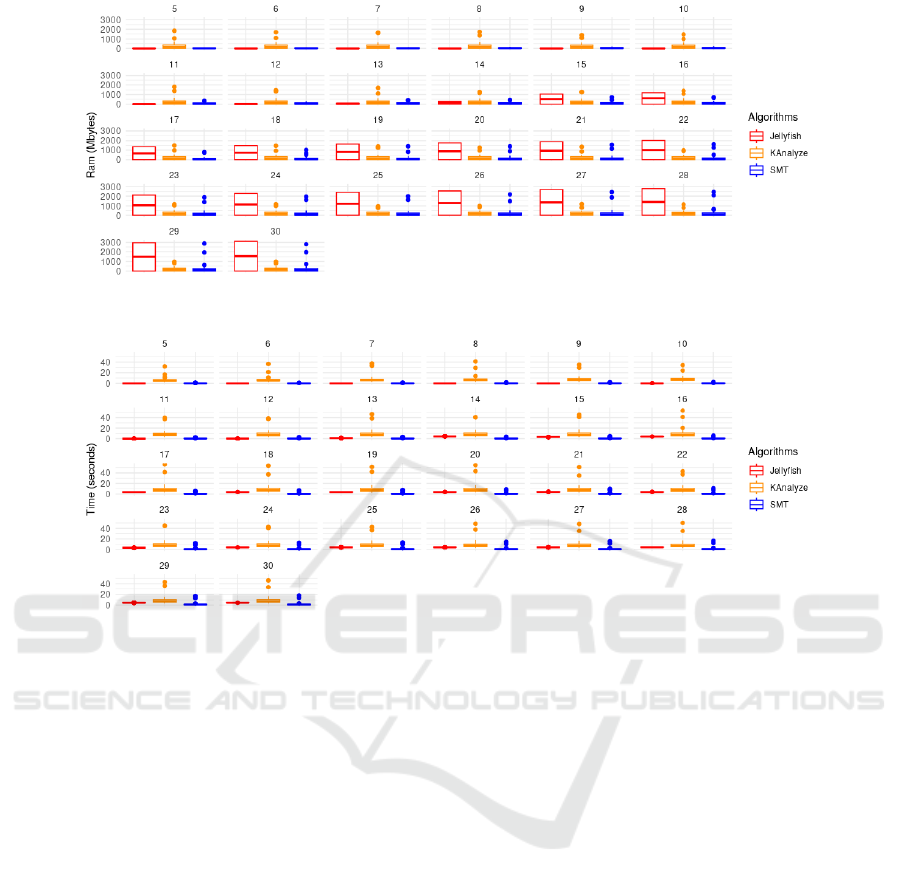
Figure 3: Comparative analysis among the boxplot graphs of the algorithms SMT, JELLYFISH, and KANALYZE concerning
RAM consumption (in megabytes), grouped by k values.
Figure 4: Comparative analysis between the boxplot graphs of the algorithms SMT, JELLYFISH, and KANALYZE regarding
time consumption (in seconds), grouped by k values.
highlighting its efficiency, especially at higher values
of k.
Furthermore, Table 1 shows that, starting from
k = 13, the execution time of SMT remains consis-
tently lower than that of JELLYFISH. This is an in-
teresting point, as it demonstrates the efficiency of
SMT in maintaining a low execution time even with
increasing k. Additionally, KANALYZE exhibits a sig-
nificantly higher execution time compared to the other
two tools across all values of k, highlighting the effi-
ciency of both SMT and JELLYFISH in terms of execu-
tion time.
In summary, while JELLYFISH and SMT exhibit
greater consistency in their time consumption, KAN-
ALYZE displays higher variability. Depending on the
context and specific needs of a project, the selection
of the ideal algorithm may vary. For instance, for
projects with stringent memory constraints, SMT may
be the ideal choice due to its efficiency. In contexts
where variability in RAM consumption is not an issue
and performance is a priority, both SMT and JELLY-
FISH are viable options. On the other hand, despite its
higher execution times, KANALYZE has the advantage
of being a Java-based tool, making it a versatile option
for systems that do not depend on specific hardware
and software.
4 STATISTICAL ANALYSIS
In this section, we will employ a rigorous statistical
approach to discern significant differences in perfor-
mance among the algorithms in terms of execution
time and RAM memory consumption for each value
of k. Initially, we will conduct the Friedman test to
check for the existence of differences between the al-
gorithms. If a significant difference is identified, we
will proceed with post-hoc Nemenyi analysis, with
Bonferroni correction, to determine which algorithm
stands out as the most efficient for each value of k.
This analysis will enable us to draw robust conclu-
sions regarding the relative performance of the algo-
rithms under study.
The Table 2 contains comparative results for the
three tested algorithms: KANALIZE, JELLYFISH, and
SMT. The comparison was made using the Friedman
test with Nemenyi post-hoc for the variable time,
and the results were categorized according to differ-
SMT: A High-Performance Approach for Counting Kmers
549
Table 1: Comparative analysis of average time and RAM memory consumption grouped by k.
k Jellyfish (time) KAnalyze(time) SMT (time) Jellyfish (Ram) KAnalyze (Ram) SMT (Ram)
5 0.01 6.06 0.19 5.12 383.39 44.51
6 0.01 6.45 0.13 5.15 377.63 50.06
7 0.01 6.87 0.18 5.13 380.32 61.39
8 0.01 7.24 0.23 5.14 378.42 77.83
9 0.01 7.46 0.28 5.18 371.73 94.32
10 0.02 7.74 0.32 6.02 371.51 106.11
11 0.08 8.20 0.37 9.53 376.00 121.10
12 0.28 8.46 0.41 23.58 370.78 129.10
13 1.09 8.68 0.45 79.76 370.00 140.45
14 4.35 8.66 0.49 304.45 367.68 153.74
15 3.27 8.76 0.54 1054.17 367.40 164.43
16 4.05 8.76 0.58 1203.98 365.46 173.34
17 4.07 9.01 0.62 1347.63 360.25 183.47
18 4.11 8.95 0.67 1473.61 359.49 194.03
19 4.12 8.89 0.70 1618.81 358.23 206.14
20 4.14 8.88 0.75 1753.24 354.65 220.10
21 4.35 8.75 0.78 1885.82 352.14 231.02
22 4.18 8.68 0.83 2025.08 348.31 236.46
23 3.49 8.72 0.87 2102.76 348.49 249.19
24 4.23 8.70 0.90 2293.25 347.14 262.14
25 4.25 8.53 0.94 2425.23 340.15 269.82
26 4.28 8.48 0.97 2558.67 339.98 275.51
27 4.29 8.44 1.01 2701.95 341.64 293.82
28 4.34 8.36 1.04 2801.81 337.39 302.62
29 4.34 8.35 1.07 2966.11 334.86 308.54
30 4.36 8.26 1.10 3105.75 335.34 310.63
ent values of the variable k.
We can observe that the values of χ
2
are sub-
stantially high for all values of k, oscillating mainly
around 262 and gradually lowering to 229.481.
The associated p-values are extremely low, often
on the order of 10
−50
or smaller. This indi-
cates that the differences between the compared
groups are statistically significant. The columns for
paired comparisons (KAN VS JELLY, SMT VS JELLY,
SMT VS KAN) show that, for many values of k, the p-
values are so low that they almost reach zero, indicat-
ing that the differences between the methods are sta-
tistically significant. However, a p-value of 0.967 for
k = 12 in the comparison between SMT and JELLY
stands out as an exception, indicating that there is no
significant difference between these two methods in
this specific case. The RESULT column summarizes
the efficacy of the SMT method in relation to the oth-
ers. For values of k from 5 to 11, the SMT underper-
forms, as indicated by the − sign in the Result col-
umn. For values of k from 13 to 30, the SMT outper-
forms the other methods, as indicated by the + sign.
The analysis suggests that the performance of the
SMT method is strongly dependent on the value of the
k variable. The algorithm appears to be less effective
for smaller values of k and more effective for higher
values. Such observation may be important for the
selection of the most suitable method depending on
the application context and the considered value of k.
Finally, Table 3 contains comparative results for
the three tested algorithms: KANALIZE, JELLYFISH,
and SMT in relation to the RAM variable. Similar to
the previous test, this comparison was conducted us-
ing the Friedman test with Nemenyi post-hoc, and the
results were categorized according to different values
of the k variable.
Analyzing the obtained values, we observe that
they are consistently high, often close to 262 and
gradually reducing to 226.733 at the end of the ta-
ble. The corresponding p-values are extremely low,
often in the order of 10
−50
or lower, indicating
that the differences between the compared groups
are statistically significant. The p-values for the
paired comparisons (KAN VS JELLY, SMT VS JELLY,
SMT VS KAN) are, in most cases, extremely low, sug-
gesting a significant difference between the compared
methods. It is noted that for all comparisons the p-
values are practically zero, reinforcing the idea of sig-
nificant differences.
In the RESULT column, the efficacy of the SMT
method is summarized in relation to other algorithms.
For the k values from 5 to 12, the SMT algorithm
shows inferior performance, as indicated by the ”-”
sign in the RESULT column. For the k values from
13 to 30, the SMT algorithm demonstrates superiority,
represented by the ”+” sign. The data suggests that
BIOINFORMATICS 2024 - 15th International Conference on Bioinformatics Models, Methods and Algorithms
550

Table 2: Results of the Friedman test with Nemenyi post-hoc for the time variable grouped by k. Caption: (+) SMT won. (-)
SMT lost. (=) there was no significant difference between first place and the others.
k χ
2
P-VALUE KAN VS JELLY SMT VS JELLY SMT VS KAN RESULT
5 262 1.28e-57 < 2e − 16 3.94e-14 3.94e-14 -
6 262 1.28e-57 < 2e − 16 3.94e-14 3.94e-14 -
7 262 1.28e-57 < 2e − 16 3.94e-14 3.94e-14 -
8 262 1.28e-57 < 2e − 16 3.94e-14 3.94e-14 -
9 262 1.28e-57 < 2e − 16 3.94e-14 3.94e-14 -
10 262 1.28e-57 < 2e − 16 3.94e-14 3.94e-14 -
11 259.53 4.4e-57 < 2e − 16 5.04e-14 3.59e-14 -
12 196.937 1.72e-43 < 2e − 16 0.967 < 2e − 16 =
13 254.244 6.19e-56 3.22e-14 1.08e-13 < 2e − 16 +
14 243.527 1.31e-53 2.1e-11 2.42e-14 < 2e − 16 +
15 258.061 9.18e-57 3.52e-14 5.73e-14 < 2e − 16 +
16 246.427 3.08e-54 2.5e-13 3.52e-14 < 2e − 16 +
17 248.29 1.21e-54 1.08e-13 3.72e-14 < 2e − 16 +
18 250.183 4.71e-55 5.21e-14 3.94e-14 < 2e − 16 +
19 242.794 1.9e-53 1.49e-12 3.22e-14 < 2e − 16 +
20 248.29 1.21e-54 1.08e-13 3.72e-14 < 2e − 16 +
21 239.282 1.1e-52 8.81e-12 2.94e-14 < 2e − 16 +
22 244.595 7.71e-54 6.07e-13 3.32e-14 < 2e − 16 +
23 256.046 2.51e-56 3.94e-14 5.04e-14 < 2e − 16 +
24 244.157 9.59e-54 9.5e-13 3.25e-14 < 2e − 16 +
25 241.023 4.6e-53 3.64e-12 3.04e-14 < 2e − 16 +
26 232.626 3.06e-51 2.63e-10 2.42e-14 < 2e − 16 +
27 235.893 5.98e-52 4.95e-11 2.7e-14 < 2e − 16 +
28 234.244 1.36e-51 1.15e-10 2.58e-14 < 2e − 16 +
29 235.142 8.7e-52 1.15e-10 2.58e-14 < 2e − 16 +
30 229.481 1.48e-50 1.31e-09 2.25e-14 < 2e − 16 +
Table 3: Results of the Friedman test with Nemenyi post-hoc for the variable RAM grouped by k values. Caption: (+) SMT
won. (-) SMT lost. (=) there was no significant difference between first place and the others.
k χ
2
P-VALUE KAN VS JELLY SMT VS JELLY SMT VS KAN RESULT
5 262 1.28e-57 < 2e − 16 3.94e-14 3.94e-14 -
6 262 1.28e-57 < 2e − 16 3.94e-14 3.94e-14 -
7 262 1.28e-57 < 2e − 16 3.94e-14 3.94e-14 -
8 262 1.28e-57 < 2e − 16 3.94e-14 3.94e-14 -
9 262 1.28e-57 < 2e − 16 3.94e-14 3.94e-14 -
10 262 1.28e-57 < 2e − 16 3.94e-14 3.94e-14 -
11 262 1.28e-57 < 2e − 16 3.94e-14 3.94e-14 -
12 262 1.28e-57 < 2e − 16 3.94e-14 3.94e-14 -
13 262 1.28e-57 < 2e − 16 3.94e-14 3.94e-14 +
14 193.115 1.16e-42 0.0495 2.89e-14 < 2e − 16 +
15 258.061 9.18e-57 5.73e-14 < 2e − 16 3.52e-14 +
16 260.015 3.45e-57 4.59e-14 < 2e − 16 3.72e-14 +
17 260.015 3.45e-57 4.59e-14 < 2e − 16 3.72e-14 +
18 262 1.28e-57 3.94e-14 < 2e − 16 3.94e-14 +
19 260.015 3.45e-57 3.72e-14 < 2e − 16 4.59e-14 +
20 260.015 3.45e-57 3.72e-14 < 2e − 16 4.59e-14 +
21 256.137 2.4e-56 3.32e-14 < 2e − 16 5.21e-14 +
22 256.137 2.4e-56 3.32e-14 < 2e − 16 5.21e-14 +
23 258.061 9.18e-57 3.52e-14 < 2e − 16 5.73e-14 +
24 250.55 3.93e-55 2.94e-14 < 2e − 16 6.07e-13 +
25 245.237 5.59e-54 2.58e-14 < 2e − 16 8.81e-12 +
26 245.237 5.59e-54 2.58e-14 < 2e − 16 8.81e-12 +
27 238.58 1.56e-52 2.14e-14 < 2e − 16 2.63e-10 +
28 229.511 1.45e-50 3.2e-14 < 2e − 16 2.75e-08 +
29 229.511 1.45e-50 3.2e-14 < 2e − 16 2.75e-08 +
30 226.733 5.83e-50 2.83e-14 < 2e − 16 1.15e-07 +
SMT: A High-Performance Approach for Counting Kmers
551

the performance of the SMT method is strongly de-
pendent on the value of the k variable, similar to the
observation made in the time analysis. The algorithm
is less effective for lower k values and more effective
for higher k values. This information may be crucial
when choosing the most appropriate method, depend-
ing on the considered value of k and the system re-
source in question.
5 CONCLUSIONS
The performance of algorithms in bioinformatics are
of utmost importance, given that datasets in compu-
tational biology are often vast and complex. In our
comparative analysis among the algorithms JELLY-
FISH, KANALYZE, and SMT, we observed significant
differences in terms of temporal and spatial perfor-
mance. The SMT algorithm stood out for its supe-
rior efficiency, demonstrating consistently low execu-
tion times and RAM consumption across all test sets.
This performance suggests that for projects with strin-
gent time and space constraints, SMT may be an ideal
choice. It is noteworthy that SMT is a data structure
recognized for its efficiency in processing and query-
ing strings. As a result, it benefits greatly from non-
uniform distributions, a feature often observed in real-
world data. The non-uniformity frequently arises due
to various biological phenomena, and SMT’s ability to
capitalize on these irregularities further underscores
its suitability and robustness for handling biological
datasets. On the flip side, JELLYFISH, although ex-
hibiting elevated variability in some cases, remains
a robust option, especially in contexts where consis-
tency in time consumption is important. KANALYZE,
despite its higher execution times, offers the flexibil-
ity of being a Java-based tool, fitting well into systems
seeking versatility in terms of hardware and software.
It is imperative to consider the specific context and
needs of each project when selecting an algorithm.
While efficiency is an important metric, adaptability
and versatility are also fundamental, especially in a
rapidly evolving field like bioinformatics.
ACKNOWLEDGEMENTS
The authors would like to thank Coordenac¸
˜
ao de
Aperfeic¸oamento de Pessoal de N
´
ıvel Superior -
Brasil (CAPES) - Finance Code 001 - for the finan-
cial support given to this research.
REFERENCES
Archbold, J. and Johnson, N. (1958). A construction
for room’s squares and an application in experimen-
tal design. The Annals of Mathematical Statistics,
29(1):219–225.
Audano, P. and Vannberg, F. (2014). Kanalyze: a fast
versatile pipelined k-mer toolkit. Bioinformatics,
30(14):2070–2072.
Bailey, T. L., Johnson, J., Grant, C. E., and Noble, W. S.
(2015). The meme suite. Nucleic acids research,
43(W1):W39–W49.
Castro-Mondragon, J. A., Riudavets-Puig, R., Raulusevi-
ciute, I., Berhanu Lemma, R., Turchi, L., Blanc-
Mathieu, R., Lucas, J., Boddie, P., Khan, A., Manos-
alva P
´
erez, N., et al. (2022). Jaspar 2022: the
9th release of the open-access database of transcrip-
tion factor binding profiles. Nucleic acids research,
50(D1):D165–D173.
Chaisson, M. J., Sanders, A. D., Zhao, X., Malhotra, A.,
Porubsky, D., Rausch, T., Gardner, E. J., Rodriguez,
O. L., Guo, L., Collins, R. L., et al. (2019). Multi-
platform discovery of haplotype-resolved structural
variation in human genomes. Nature communications,
10(1):1784.
Deorowicz, S., Gudy
´
s, A., Długosz, M., Kokot, M., and
Danek, A. (2019). Kmer-db: instant evolutionary dis-
tance estimation. Bioinformatics, 35(1):133–136.
Goodwin, S., McPherson, J. D., and McCombie, W. R.
(2016). Coming of age: ten years of next-generation
sequencing technologies. Nature Reviews Genetics,
17(6):333–351.
Marc¸ais, G. and Kingsford, C. (2011). A fast, lock-free
approach for efficient parallel counting of occurrences
of k-mers. Bioinformatics, 27(6):764–770.
Marchet, C., Lecompte, L., Silva, C. D., Cruaud, C., Aury,
J.-M., Nicolas, J., and Peterlongo, P. (2019). De novo
clustering of long reads by gene from transcriptomics
data. Nucleic Acids Research, 47(1):e2–e2.
Wood, D. E., Lu, J., and Langmead, B. (2019). Improved
metagenomic analysis with kraken 2. Genome biol-
ogy, 20:1–13.
BIOINFORMATICS 2024 - 15th International Conference on Bioinformatics Models, Methods and Algorithms
552
