
Deep Learning in Breast Calcifications Classification: Analysis of
Cross-Database Knowledge Transferability
Adam Mra
ˇ
cko
1 a
, Ivan Cimr
´
ak
1 b
, Lucia Vanov
ˇ
canov
´
a
2,3 c
and Viera Lehotsk
´
a
2,3 d
1
Faculty of Management Science and Informatics, University of
ˇ
Zilina, 010 26
ˇ
Zilina, Slovakia
2
2nd Radiology Department, Faculty of Medicine, Comenius University in Bratislava, 813 72 Bratislava, Slovakia
3
St. Elizabeth Cancer Institute, 812 50 Bratislava, Slovakia
Keywords:
Convolutional Neural Networks, Artificial Intelligence, Mammography, Machine Learning, Breast
Calcifications.
Abstract:
Study delves into the application of deep learning models for the classification of breast calcifications in mam-
mography images. Initial objective was to investigate various convolutional neural network (CNN) architec-
tures and their influence on model accuracy. ResNet101 emerged as the most effective architecture, although
other models exhibited comparable performances. The insights gained were subsequently applied to the main
goal, which focused on examining the transferability of knowledge between models trained on digitalized
films (Curated Breast Imaging Subset of Digital Database for Screening Mammograph) and those trained on
digital mammography images (Optimam Database). Results confirmed the lack of seamless transferability,
prompting the creation of a combined dataset for training, significantly improving overall model accuracy to
76.2%. The study also scrutinized instances of incorrect predictions across different models, particularly those
posing challenges even for medical professionals. Visualizations using Grad-Cam aided in understanding the
models’ decision-making process.
1 INTRODUCTION
Breast cancer is the most common type of cancer
among women (Sung et al., 2021). Early detection
through mammographic screening leads to prompt
treatment and better patient prognosis. Many coun-
tries have implemented mammographic screening to
detect individuals with carcinoma before the onset
of symptoms, starting from the age of 45. Common
findings in mammography include masses, calcifica-
tions (macro- and micro-), architectural distortions,
and asymmetries. Mammography excels in detect-
ing pathological microcalcifications, with their detec-
tion often leading to the discovery of ductal carci-
noma in situ (DCIS), a pre-invasive type of breast
cancer that can progress to a more dangerous inva-
sive type. Approximately 80%-90% of DCIS cases
are diagnosed through mammography (Grimm et al.,
2022), accounting for about 20-30% of all breast can-
a
https://orcid.org/0009-0004-6538-6896
b
https://orcid.org/0000-0002-0389-7891
c
https://orcid.org/0000-0003-2363-1238
d
https://orcid.org/0000-0003-4083-8097
cer types (Allred, 2010).
Diagnosing microcalcifications is complex due to
variations in shape, density, size, number, and dis-
tribution—either diffuse or clustered. The challeng-
ing diagnosis of suspicious findings results in a high
number of false positives, with only about 15%-
45% (Chhatwal et al., 2010) of biopsy cases turn-
ing out positive. Waiting for biopsy results nega-
tively impacts patients’ health due to increased stress.
Mammographic examinations undergo double read-
ing, where two independent radiologists assess pa-
tient images and must agree on the final evaluation.
The high patient volume, demanding diagnostics, and
double reading contribute to a heavy workload for
medical personnel.
Introducing artificial intelligence models into the
examination process could potentially expedite the
entire procedure and, with high accuracy in classifi-
cation tasks, even emulate the second doctor in dou-
ble reading. Convolutional Neural Networks (CNN)
are the most suitable models, currently unparalleled
in image data processing tasks. CNNs can handle
classification, detection, and segmentation tasks. This
study focuses on the classification of findings with
Mra
ˇ
cko, A., Cimrák, I., Vanov
ˇ
canová, L. and Lehotská, V.
Deep Learning in Breast Calcifications Classification: Analysis of Cross-Database Knowledge Transferability.
DOI: 10.5220/0012535200003657
Paper published under CC license (CC BY-NC-ND 4.0)
In Proceedings of the 17th International Joint Conference on Biomedical Engineering Systems and Technologies (BIOSTEC 2024) - Volume 1, pages 527-535
ISBN: 978-989-758-688-0; ISSN: 2184-4305
Proceedings Copyright © 2024 by SCITEPRESS – Science and Technology Publications, Lda.
527
microcalcifications, specifically binary classifiers de-
termining whether a given finding belongs to the ma-
lignant or benign class. It will utilize two databases
with mammography images obtained through differ-
ent technologies. The analysis will focus on the trans-
ferability of knowledge between models trained on
older technology (digitalized films) and modern tech-
nology (digital mammography, also known as full-
field digital mammography). Additionally, it ad-
dresses how to manage high-resolution mammogra-
phy images and interpret models to ensure they make
decisions based on crucial radiological features.
2 MAMMOGRAPHY DATA
The mammography images used were obtained
from the Curated Breast Imaging Subset of Digi-
tal Database for Screening Mammography (CBIS-
DDSM) (Lee et al., 2017) and the Optimam database
(OMI-DB) (Halling-Brown et al., 2021).
CBIS-DDSM is a subset of the Digital Database
for Screening Mammography (DDSM), which has
been updated and standardized. DDSM contains
digitalized screen films (indirect digital mammogra-
phy). In CBIS-DDSM, these images were converted
to the DICOM format, which is the current standard
in medicine. The database is divided into two main
groups based on the type of findings: masses and
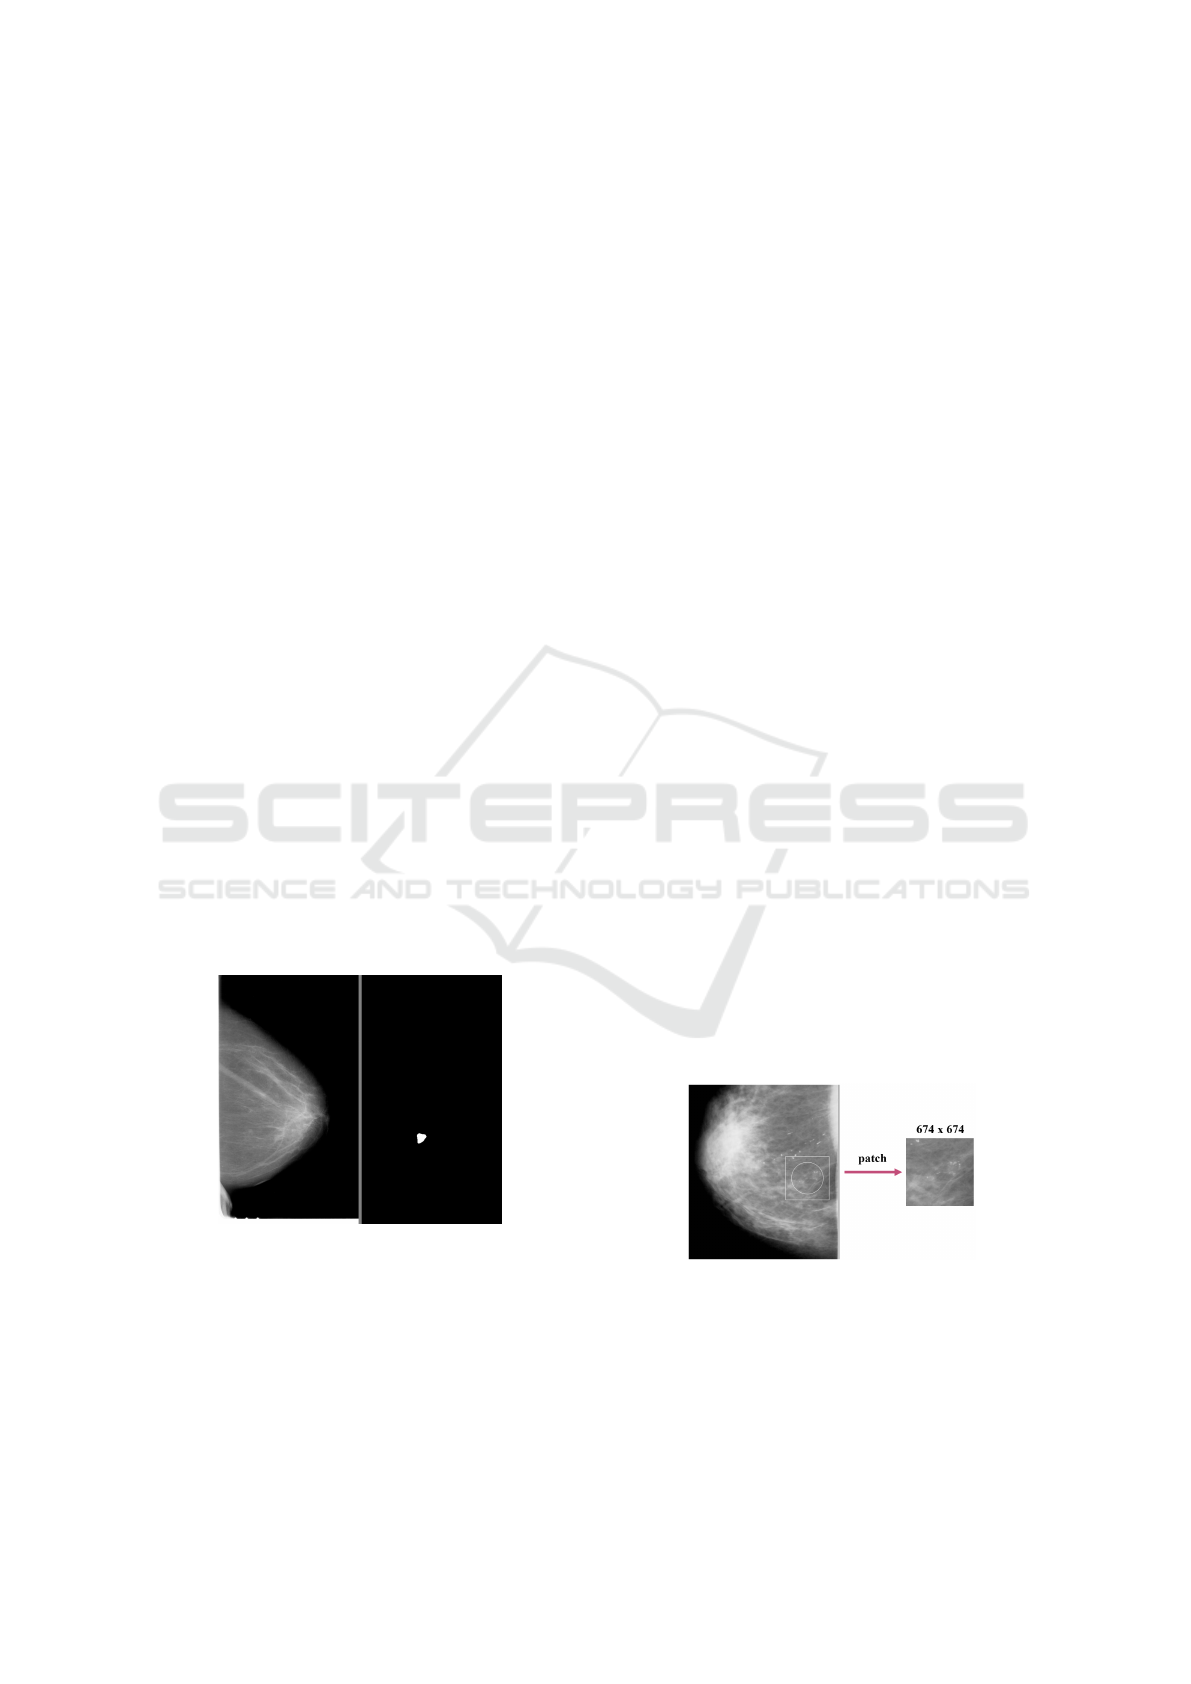
calcifications. Each finding includes a segmentation
mask (Figure 1) and a histopathological result. The
database also includes a split into training and testing
sets.
Figure 1: Mammogram (left) and binary mask (right).
OMI-DB is a comprehensive database that con-
tinuously collects images with associated data
(histopathology results) from several oncology insti-
tutes in the United Kingdom. Unlike CBIS-DDSM, it
is not freely available, and access requires affiliation
with a commercial, academic, or non-profit organiza-
tion. Mammographic images come from direct digital
mammography, which is a significant advantage com-
pared to CBIS-DDSM. OMI-DB includes all types of
findings (masses, calcifications, architectural distor-
tions, asymmetries, and their combinations), as well
as images of patients without a record of the biopsy
performed. Findings can be localized with rectangle
bounding boxes (coordinates of the top left corner and
bottom right corner).
2.1 Data Preprocessing
The study focused on patches with findings of cal-
cifications. The first step in data preprocessing was
to filter the correct data from the used databases.
CBIS-DDSM provided a direct distribution contain-
ing only calcification findings. For OMI-DB, data
needed more complex filtering. The filter included
the following conditions:
• Only images with a single bounding box (had to
be present on the image and have a non-zero area).
• Only calcification findings (without various com-
binations with other findings).
• We accepted only the findings with which the
histopathological result could be unambiguously
associated.
• Accepted histopathological result values were
only Malignant or Benign.
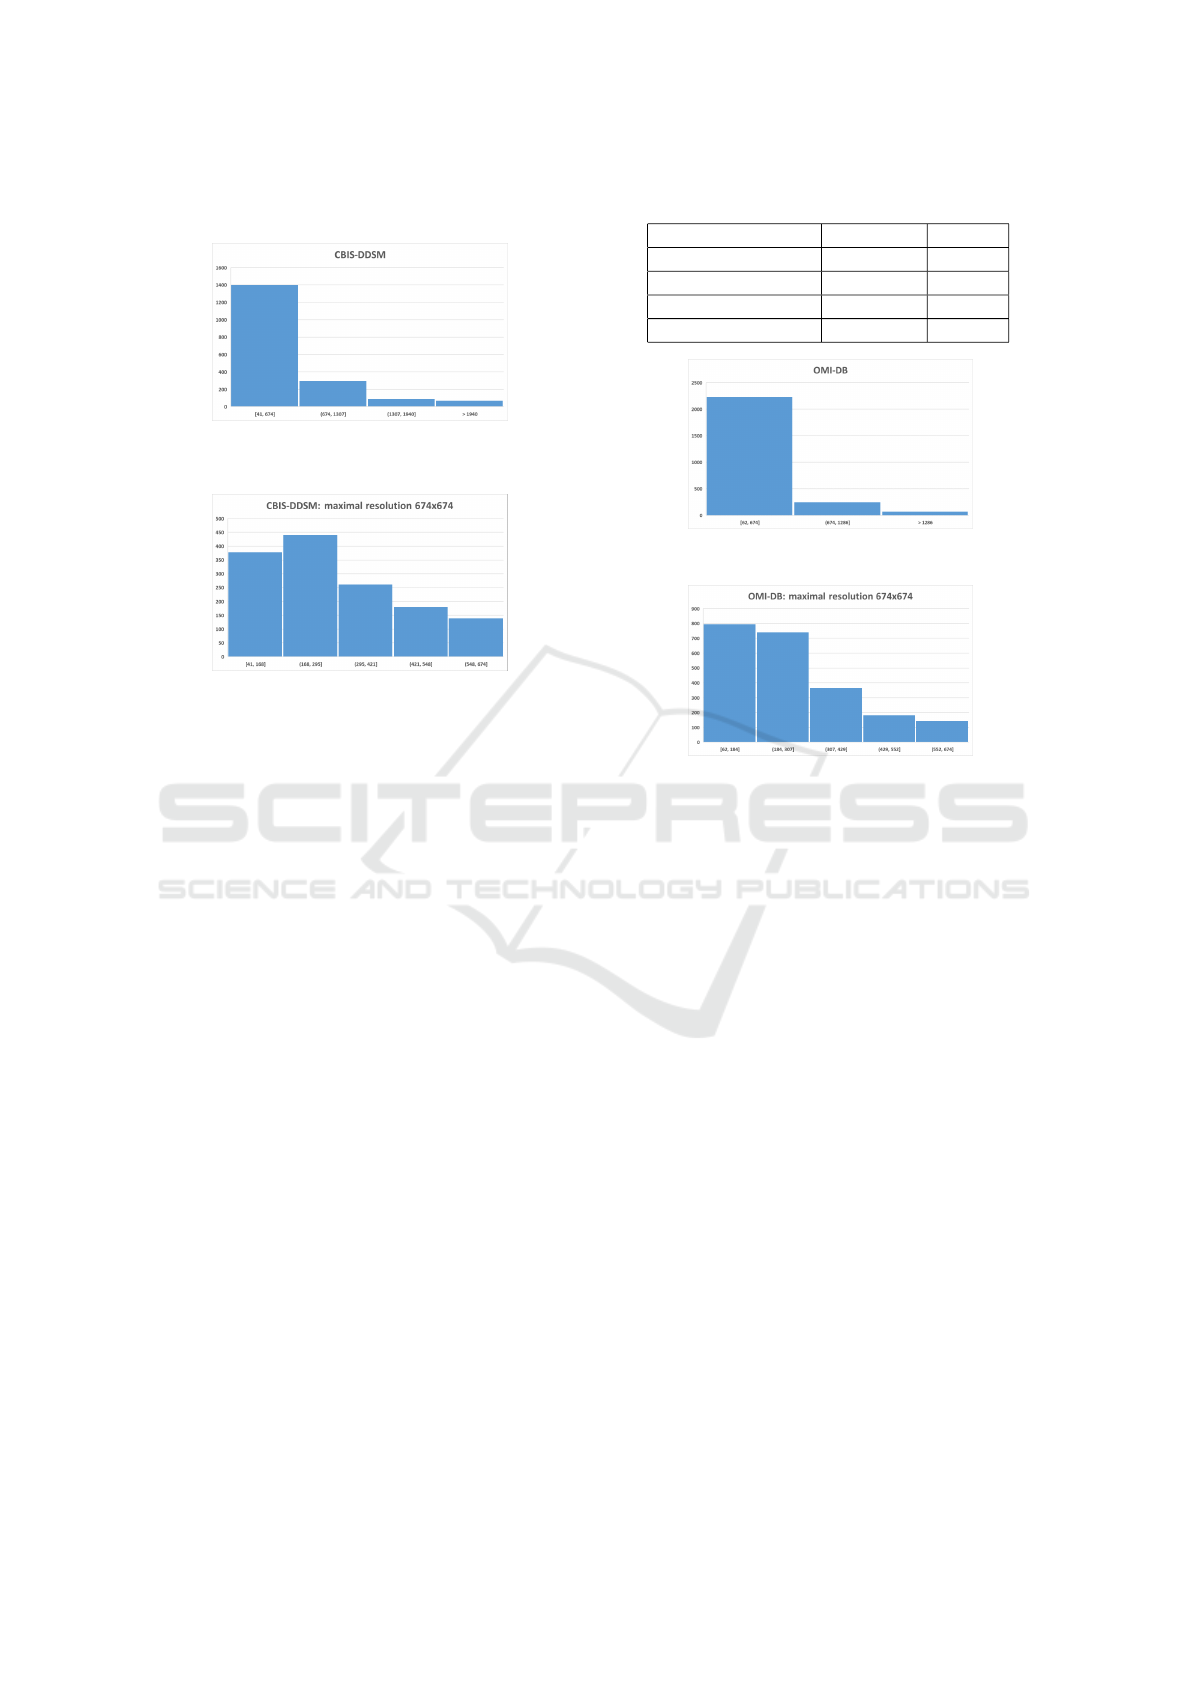
From the obtained dataset, all findings that would
not fit into a square (patch) of size 674x674 pixels due
to their size were removed (Figure 3, 4, 5, 6). The de-
cision to use the resolution of 674x674 pixels as input
for models was based on histograms, aiming to re-
move as few findings as possible while not exceeding
GPU memory limitations. More details on why not to
resize patches and why not to use entire images are in
Section 3.1.
Figure 2: Patch creation from whole mammogram.
For images with dimensions smaller than
674x674, the surrounding area from the mammogram
was added (Figure 2). If possible, the patches were
centered on the lesion. In the case of findings at
the edges of the mammogram, the patch was shifted
more towards the inside of the mammogram. Before
BIOINFORMATICS 2024 - 15th International Conference on Bioinformatics Models, Methods and Algorithms
528
creating patches, mammograms were normalized to
values between 0 and 1.
Figure 3: Resolution distribution of calcification findings in
the CBIS-DDSM.
Figure 4: Resolution distribution of calcification findings,
not higher than 674x674 pixels, in the CBIS-DDSM.
The CBIS-DDSM database contained numerous
masks with different resolutions compared to the cor-
responding mammograms. These masks were scaled
to the correct resolution. Additionally, about 30 addi-
tional adjustments were made, involving slight shifts
of masks located next to the finding. If one mammo-
gram had multiple masks and their findings were too
close, the masks were unified. Some findings were re-
moved if the mask did not contain any calcifications.
The OMI-DB database contained several inverted
images, which were corrected using inversion. Im-
ages with lower quality and incorrect gray back-
grounds were discovered and retained in the dataset
(digital mammography should contain a black back-
ground - value 0, or completely white for inverted im-
ages).
After data processing, 2947 training data (OMI-
DB: 1786, CBIS-DDSM: 1161) and 684 validation
data (OMI-DB: 443, CBIS-DDSM: 241) were ob-
tained. For CBIS-DDSM data, their official distri-
bution into training/testing sets was used. In both
databases, the classes were imbalanced (Table 1). The
data between the training and validation sets were in-
dependent, and thus, the same patient could not be
in both the validation and training sets. Methods like
k-fold cross-validation were not used due to the time-
consuming nature of experiments on high-resolution
images.
Table 1: Amount of data in specified classes.
Dataset Malignant Benign
OMI-DB train 1329 457
OMI-DB val. 327 116
CBIS-DDSM train 309 852
CBIS-DDSM val. 74 167
Figure 5: Resolution distribution of calcification findings in
the OMI-DB.
Figure 6: Resolution distribution of calcification findings,
not higher than 674x674 pixels, in the OMI-DB.
3 EXPERIMENTAL STUDIES
The study focused on four types of experiments. Ini-
tially, it was essential to explore how the downsiz-
ing of patches would impact the accuracy of the mod-
els. The goal of the second experiment was to find
a suitable convolutional architecture for classifying
patches. The last two experiments took advantage
of access to the two databases with mammograms
obtained using different technologies. Firstly, we
observed how models performed with images from
a different technology. Subsequently, we analyzed
patches for which predictions were consistently incor-
rect across all models.
3.1 Image Downscaling
In convolutional neural networks (CNNs), it is com-
mon to downscale input images for various bene-
fits, such as faster training and reduced GPU mem-
ory requirements. The typical input resolution
used is 224x224 pixels. However, mammography
images have very high resolutions, often exceed-
ing 4000x4000 pixels. Shrinking mammograms to
224x224 would result in significant information loss.
Deep Learning in Breast Calcifications Classification: Analysis of Cross-Database Knowledge Transferability
529

While reducing to half or quarter size may seem like
a solution, training models on entire images for clas-
sification tasks (e.g., presence or absence of cancer)
would not yield reasonable accuracy due to limited
data, image complexity, and information loss.
Therefore, this study focused on classifying
patches from mammograms containing calcifications.
Specifically, it dealt with findings of calcifications
that fit into patches with a resolution of 674x674 pix-
els. Using patches helps models understand what is
essential and where to focus. A model trained on such
patches could later be transformed to process the en-
tire input, possibly through an end-to-end approach
introduced in (Shen et al., 2019).
The patches in our study had high resolution, pos-
ing hardware demands. An experiment was con-
ducted to assess the impact of reducing patch resolu-
tion to 224x224 pixels. Table 2 shows relative differ-
ences in accuracy between models trained on patches
with resolutions of 674x674 and 224x224 pixels. The
ResNet50 architecture was used, and each hyperpa-
rameter setting underwent three training runs to im-
prove statistical sampling. On average, there was
a relative accuracy decrease of 1.51% with reduced
patch resolutions.
It was observed that downsizing, whether the en-
tire image or patches, is not suitable as it leads to the
loss of crucial details. Similar behavior has been seen
in other experiments with other architectures as well.
Several studies, including (Geras et al., 2017), have
addressed the inadequacy of downsizing mammogra-
phy images.
3.2 Convolutional Architectures
In general, the most significant contributors to the
overall accuracy of models are the training data, the
chosen architecture, and the proper setting of the
learning rate. Therefore, the next series of exper-
iments focused on trying different well-known ar-
chitectures with varying learning rate values. Ar-
chitectures tested included VGG, Inception, ResNet,
DenseNet, and EfficientNet.
3.2.1 Architectures Description
• Year 2014 - VGG (Visual Geometry Group) (Si-
monyan and Zisserman, 2015): Known for its
simplicity, which can be a significant advantage
for implementing various methods (such as model
interpretation methods). It was the first deeper ar-
chitecture (up to 19 layers). More prone to over-
fitting, computationally expensive.
• Year 2015 - Inception (GoogLeNet) (Szegedy
et al., 2014): Uses inception modules with mul-
tiple filter sizes (1x1, 3x3, 5x5) in parallel. Aims
to capture different scales of information simulta-
neously. Increased computational complexity.
• Year 2016 - ResNet (Residual Network) (He et al.,
2015): Introduced skip connections, enabling the
creation of very deep networks (up to 152 lay-
ers) at the cost of greater model complexity. Until
this point, the major issue with deep CNN net-
works was the vanishing/exploding gradient prob-
lem (Glorot and Bengio, 2010). Adding more lay-
ers improved performance.
• Year 2017 - DenseNet (Densely Connected Con-
volutional Network) (Huang et al., 2016): In-
troduces dense connectivity where each layer re-
ceives inputs from all preceding layers. Reduces
vanishing gradient problems and promotes feature
reuse. Higher memory consumption due to dense
connectivity. Computationally more intensive.
• Year 2019 - EfficientNet (Tan and Le, 2019):
Employs a compound scaling method to balance
model width, depth, and resolution. Achieves bet-
ter performance with fewer parameters. Improved
efficiency in terms of accuracy and computational
cost.
3.2.2 Architectures Experiments
Most architectures have several versions that differ in
the number of trainable parameters. All versions (pro-
vided in the PyTorch (Paszke et al., 2019) library) that
fit into the GPU memory capacity (RTX 4080 16GB)
with a set mini-batch of 8 were tried. For DenseNet,
only version 121 was used, and for EfficientNet, ver-
sions B0 to B2 were tested. Inception had only one
implementation, V3.
Pre-trained weights on the ImageNet dataset were
used for each architecture. The use of pre-trained
weights resulted in faster training and better final ac-
curacy. The following learning rate values were tested
with the Adam optimizer: 1e-2, 1e-3, 1e-4, 1e-5, 1e-
6, 1e-7. The early stopping technique was also em-
ployed. The top 3 models for each architecture are
shown in Tables 3, 4, 5, 6, 7.
From the results, it was observed that for our
combined dataset from CBIS-DDSM and OMI-DB
databases, it is most suitable to use learning rate val-
ues ranging from 1e-5 to 1e-6. Smaller values resulted
in significant accuracy oscillations during training,
while larger values considerably extended the train-
ing duration and couldn’t achieve as high accuracy as
the mentioned values.
Surprisingly, all architectures performed very sim-
ilarly. The top 8 models (Table 8) included all ar-
BIOINFORMATICS 2024 - 15th International Conference on Bioinformatics Models, Methods and Algorithms
530
Table 2: Accuracy comparison of patches with different resolution.
Patch Resolution 674x674 Patch Resolution 224x224 Difference
LR Avg. Val. Acc. Best Val. Acc. Avg. Val. Acc. Best Val. Acc.
1e-6 75,4% 76,0% -2,79% -3,03%
1e-5 74,9% 75,4% -2,00% -1,72%
1e-3 72,5% 72,8% -0,97% -0,82%
1e-4 72,3% 72,8% -0,28% -0,41%
Table 3: Top 3 models - ResNet architecture.
Model LR Val. Acc. Train Acc.
ResNet101 1e-6 77,2% 81,3%
ResNet50 1e-6 75,9% 79,9%
ResNet152 1e-6 75,7% 90,9%
Table 4: Top 3 models - Inception architecture.
Model LR Val. Acc. Train Acc.
Inception-V3 1e-4 75,4% 80,8%
Inception-V3 1e-5 75,1% 78,4%
Inception-V3 1e-6 73,8% 78,0%
chitectures except Inception-V3. The average accu-
racy of the top 8 was 76.2%. It is important to note
that due to the small amount of training data, the fi-
nal accuracy of the same model may vary by up to +-
1.5% after different training runs. In our experiment,
the ResNet101 architecture proved to be the best with
77,2% validation accuracy.
3.3 Cross-Dataset Generalization Study
The main focus of this experiment was to train three
models, each on a different dataset:
• CBIS-DDSM model – trained on CBIS-DDSM
training data.
• OMI-DB model – trained on OMI-DB training
data.
• Combined model – trained on data from both
databases.
The goal was to observe how these models per-
form on validation sets from CBIS-DDSM, OMI-DB,
and both databases combined. The experiment aimed
to answer whether a model trained on digitalized
screen films (CBIS-DDSM) could be transferable to
data from modern digital mammography (OMI-DB)
without any fine-tuning, and vice versa. Additionally,
it sought to determine if combining databases would
lead to better accuracies.
The ResNet101 architecture was used with learn-
ing rate, which proved to be the best in previous ex-
periments with architectures. Different class weights
Table 5: Top 3 models - VGG architecture.
Model LR Val. Acc. Train Acc.
VGG-16-BN 1e-6 75,7% 83,4%
VGG-19-BN 1e-6 75,7% 81,5%
VGG-13 1e-6 75,6% 83,4%
Table 6: Top 3 models - EfficientNet architecture.
Model LR Val. Acc. Train Acc.
EfficientNet-B1 1e-5 75,9% 78,7%
EfficientNet-B2 1e-5 75,4% 89,5%
EfficientNet-B0 1e-5 75,3% 82,1%
during training were applied due to the high imbal-
ance in the datasets. The settings were as follows:
• CBIS-DDSM model [Benign - 0.266, Malign -
0.734]
• OMI-DB model [Benign - 0.744, Malign - 0.256]
• Combined model [Benign - 0.556, Malign -
0.444]
Training occurred for 40 epochs, with models be-
ing saved and relevant statistics computed after each
epoch.
For the CBIS-DDSM model, the experiment re-
sults are presented in Table 9. Table shows only
epochs where the accuracy on individual validation
sets was the highest. At first glance, it may seem that
the model performed better on the OMI-DB valida-
tion set than on its own. However, in that epoch, the
model assigned 97.7% of OMI-DB data to the malig-
nant class, resulting in an extremely low specificity
of 2.58%. On its own data, the database achieved
more reasonable results shown in Figure 7. Gener-
ally, the model tended to classify more towards the
benign class.
The OMI-DB model had a similar outcome to the
CBIS-DDSM model. According to Table 10, the best
achieved accuracy for CBIS-DDSM data was only
47.7%, which is practically unusable. As expected,
on its own validation data, the model performed bet-
ter (Figure 8), but it still leaned towards predicting the
malignant class.
The use of a combined training set significantly
contributed to improving accuracy (Table 11). Nat-
ural class balancing also played a role. The confu-
Deep Learning in Breast Calcifications Classification: Analysis of Cross-Database Knowledge Transferability
531
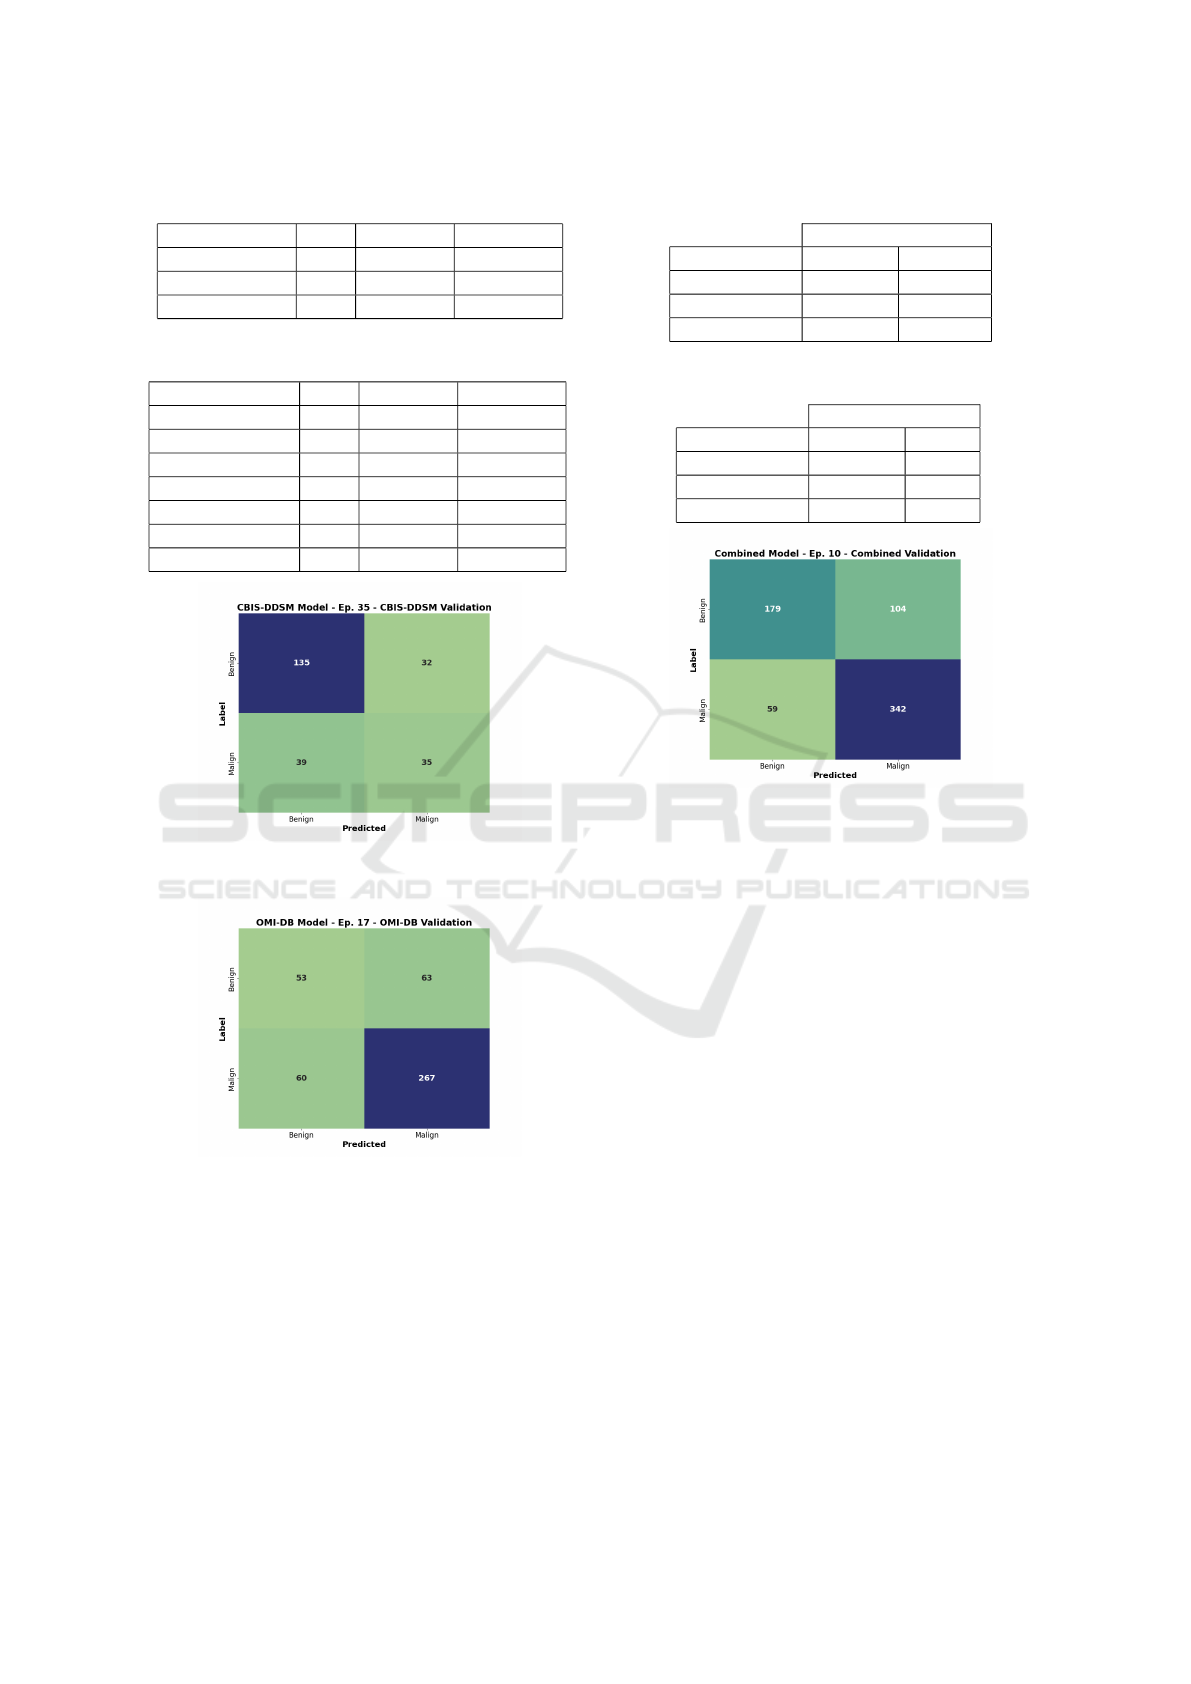
Table 7: Top 3 models - DenseNet architecture.
Model LR Val. Acc. Train Acc.
DenseNet-121 1e-6 76,5% 85,5%
DenseNet-121 1e-5 76,3% 83,1%
DenseNet-121 1e-4 74,0% 87,1%
Table 8: Top 8 models - all architectures.
Model LR Val. Acc. Train Acc.
ResNet101 1e-6 77,2% 81,3%
DenseNet-121 1e-6 76,5% 85,5%
DenseNet-121 1e-5 76,3% 83,1%
EfficientNet-B1 1e-5 75,9% 78,7%
ResNet50 1e-6 75,9% 79,9%
ResNet152 1e-6 75,7% 90,9%
VGG-16-BN 1e-6 75,7% 83,4%
Figure 7: Confusion matrix of the CBIS-DDSM model and
its validation set.
Figure 8: Confusion matrix of the OMI-DB model and its
validation set.
sion matrix of the combined validation sets (Figure 9)
shows that the model no longer strongly prefers either
the benign or malignant class.
From the observed experiments, it can be con-
firmed that models trained on separate databases
struggle to generalize well to data acquired using
different technologies. The creation of a combined
dataset led to an overall improvement in accuracy.
Table 9: Validation accuracies on the CBIS-DDSM model.
CBIS-DDSM Model
Validation Best Acc Epoch
CBIS-DDSM 70,5% 35
OMI-DB 72,9% 20
Combined 70,8% 26
Table 10: Validation accuracies on the OMI-DB model.
OMI-DB Model
Validation Best Acc Epoch
CBIS-DDSM 47,7% 16
OMI-DB 72,2% 17
Combined 61,1% 19
Figure 9: Confusion matrix of the Combined model and its
validation set.
3.4 Intersection of Incorrect Predictions
The last part of the study focused on incorrect pre-
dictions using models from the previous experiment
(CBIS-DDSM, OMI-DB, and Combined Model). For
each validation set, the epoch with the highest accu-
racy was chosen. It was revealed that models often
struggled with predictions on the same data, despite
the CBIS-DDSM model preferring predictions into
the benign class and the OMI-DB model into the ma-
lignant class.
The CBIS-DDSM validation set contained 17
patches with incorrect predictions across all three
models. On average, this constituted 22.6% of data
with incorrect predictions (false positives + false neg-
atives). OMI-DB had as many as 59 such patches,
averaging 50.9% of data with incorrect predictions.
For a deeper analysis of problematic data, the in-
terpretation method Grad-Cam (Gildenblat and con-
tributors, 2021) was used to visualize important re-
gions in the input patch that contributed most to the
final decision. In the medical field, explaining models
is essential, ensuring that the model genuinely makes
decisions based on what is important.
The analysis revealed that most CBIS-DDSM
BIOINFORMATICS 2024 - 15th International Conference on Bioinformatics Models, Methods and Algorithms
532
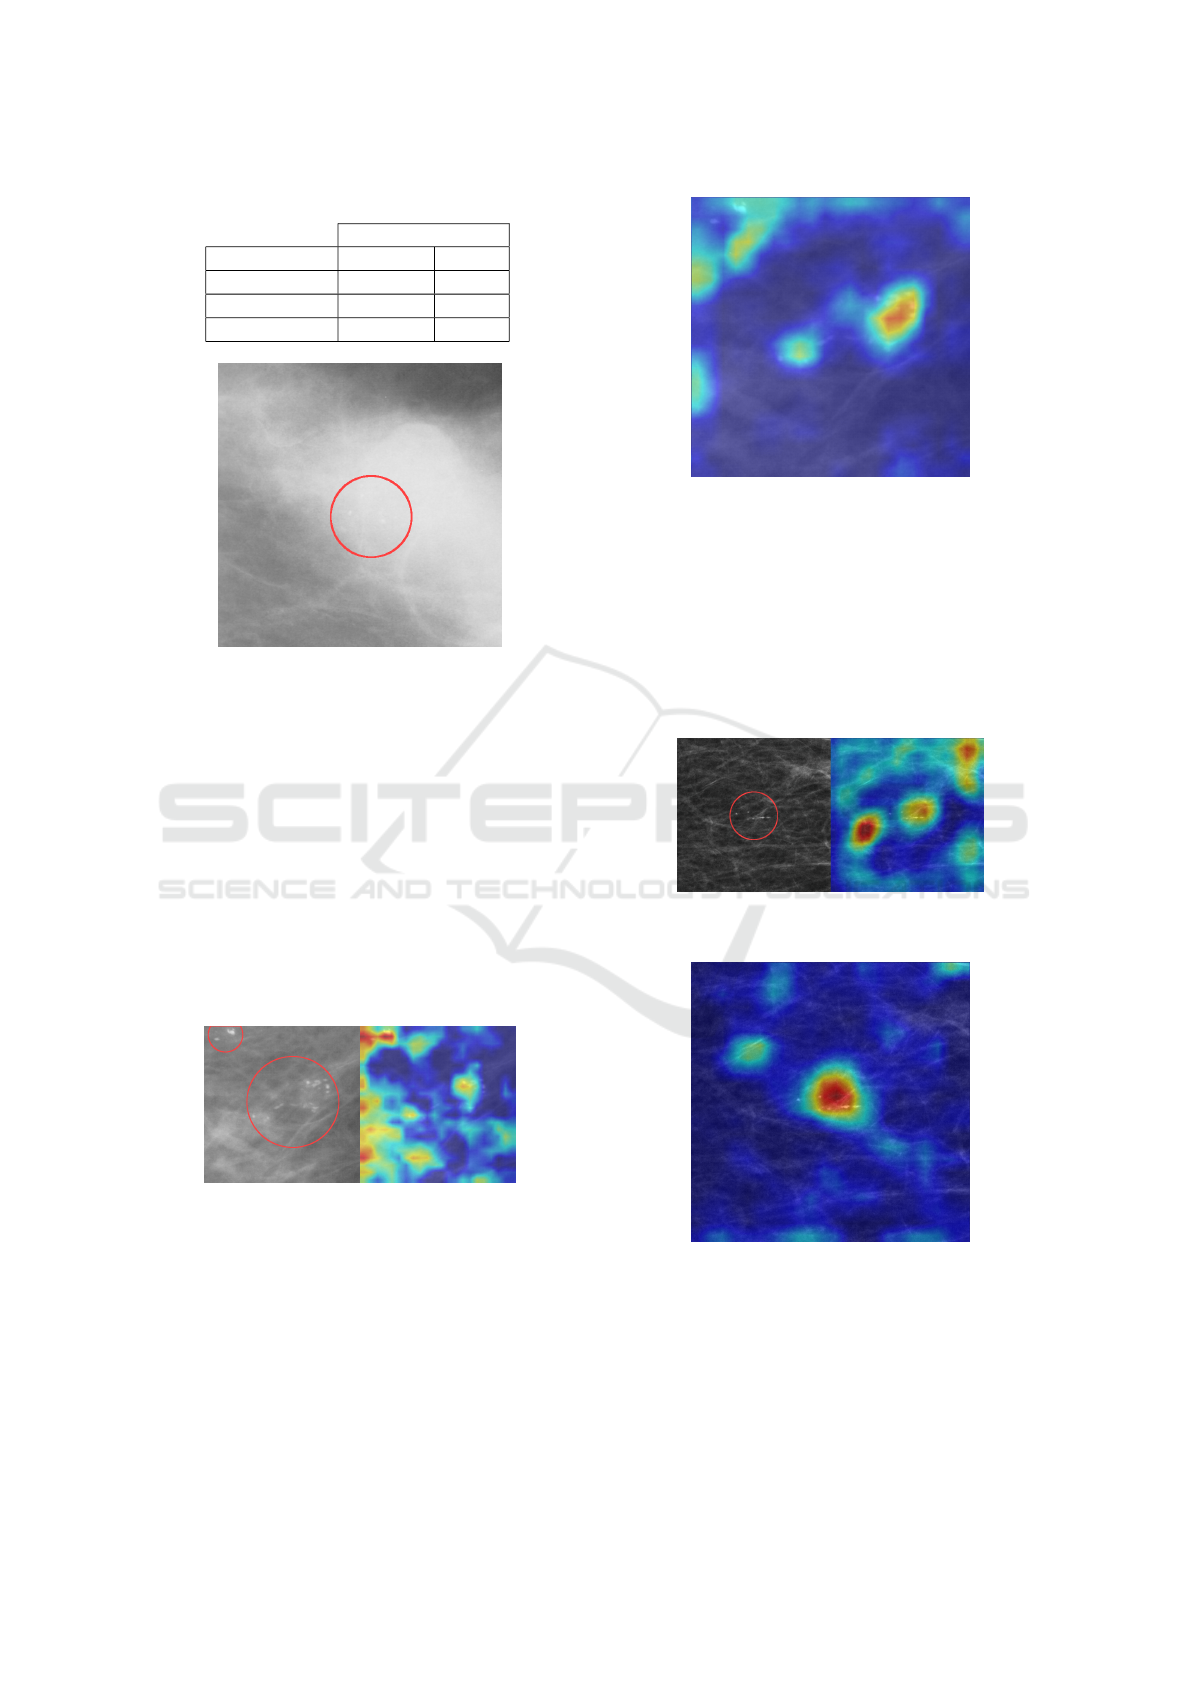
Table 11: Validation accuracies on the Combined model.
Combined Model
Validation Best Acc Epoch
CBIS-DDSM 76,8% 10
OMI-DB 76,1% 9
Combined 76,2% 10
Figure 10: Patch with dense tissue.
patches were of lower quality (less sharp images)
and contained dense fibroglandular tissue, potentially
complicating the detection of small abnormalities
(Figure 10). The OMI-DB model performed the
worst, often failing to correctly detect clusters of mi-
crocalcifications. Even when it managed to identify
a crucial area in the patch, the result was influenced
by a large amount of irrelevant tissue (Figure 11). In
comparison, the Combined model performed better,
marking the significant area more accurately (Figure
12). However, the result for both models was an in-
correct malignant prediction. Both Combined and
CBIS-DDSM models also had trouble detecting the
crucial area in some patches.
Figure 11: Incorrect prediction of CBIS-DDSM patch with
OMI-DB model.
On OMI-DB patches, the models performed sig-
nificantly better. In almost all cases, the models man-
aged to identify important clusters of microcalcifica-
tions. The CBIS-DDSM model had the least accurate
detection, giving importance to areas with only fatty
or fibroglandular tissue without visible abnormalities.
For comparison, the CBIS-DDSM model (Figure 13)
and the Combined model (Figure 14) were examined.
Figure 12: Incorrect prediction of CBIS-DDSM patch with
Combined model.
Almost all 59 patches belonged to the benign class,
but the models classified them as malignant. This fact
was discussed with breast radiologists, clarifying that
it is very challenging or even impossible to determine
the correct class for patches with which the models
struggled using mammography alone. In such cases,
a biopsy is necessary for the most accurate determina-
tion of whether the finding contains cancerous tissue.
Figure 13: Incorrect prediction of OMI-DB patch with
CBIS-DDSM model.
Figure 14: Incorrect prediction of OMI-DB patch with
Combined model.
This part of the study demonstrated that using
a combined dataset during training positively con-
tributes to more accurate detection of important areas
in patches. However, it is essential to note that the pri-
mary purpose of the models is not detection but rather
the classification of patches.
Deep Learning in Breast Calcifications Classification: Analysis of Cross-Database Knowledge Transferability
533

4 CONCLUSIONS
The first goal of the study was to investigate the im-
pact of different architectures on the resulting accu-
racy of the models. The best-performing architecture
was ResNet101, but other architectures achieved very
comparable accuracies.
The second goal aimed to explore the transferabil-
ity of knowledge from a model trained on digitalized
films (indirect digital mammography) to direct digital
mammography images and vice versa. It was con-
firmed that models are not transferable to data ob-
tained using different technology. Combining these
training data into a unified dataset significantly con-
tributed to the overall improvement of model accu-
racy. Such a model achieved an accuracy of 76.2
The final part involved examining patches with
incorrect predictions, specifically focusing on those
where the prediction was incorrect across all tested
models. The results were discussed with radiologists,
confirming that many patches incorrectly classified as
malignant pose a significant challenge even for med-
ical professionals and cannot be classified without a
tissue biopsy.
During the experiments, it was observed that the
decision-making in some patches involved the area
around the finding, which did not contain abnormali-
ties. This behavior could potentially be addressed, for
example, by adding a third class containing patches
from healthy tissue. Adding such a class will be the
subject of our next study.
There is a relatively wide scope for improving re-
sults, including better hyperparameter optimization,
adding augmented data, or incorporating regulariza-
tion methods. However, the primary intent of this
work was to explore the questions outlined in the
stated goals.
It is important to note that the created models may
be biased, as all training/validation data used had un-
dergone a biopsy. This means they represent findings
where doctors were uncertain whether the abnormal-
ity was benign or malignant.
ACKNOWLEDGEMENTS
This research was supported by the Ministry of Ed-
ucation, Science, Research and Sport of the Slovak
Republic under the contract No. VEGA 1/0525/23.
REFERENCES
Allred, D. (2010). Ductal carcinoma in situ: Terminology,
classification, and natural history. Journal of the Na-
tional Cancer Institute. Monographs, 2010:134–8.
Chhatwal, J., Alagoz, O., and Burnside, E. S. (2010). Opti-
mal breast biopsy decision-making based on mammo-
graphic features and demographic factors. Operations
research, 58(6):1577–1591.
Geras, K. J., Wolfson, S., Kim, S. G., Moy, L., and Cho,
K. (2017). High-resolution breast cancer screening
with multi-view deep convolutional neural networks.
ArXiv, abs/1703.07047.
Gildenblat, J. and contributors (2021). Pytorch li-
brary for cam methods. https://github.com/jacobgil/
pytorch-grad-cam.
Glorot, X. and Bengio, Y. (2010). Understanding the dif-
ficulty of training deep feedforward neural networks.
Journal of Machine Learning Research - Proceedings
Track, 9:249–256.
Grimm, L. J., Rahbar, H., Abdelmalak, M., Hall, A. H., and
Ryser, M. D. (2022). Ductal carcinoma in situ: State-
of-the-art review. Radiology, 302(2):246–255. PMID:
34931856.
Halling-Brown, M. D., Warren, L. M., Ward, D., Lewis,
E., Mackenzie, A., Wallis, M. G., Wilkinson, L. S.,
Given-Wilson, R. M., McAvinchey, R., and Young,
K. C. (2021). Optimam mammography image
database: A large-scale resource of mammography
images and clinical data. Radiology: Artificial Intelli-
gence, 3(1):e200103. PMID: 33937853.
He, K., Zhang, X., Ren, S., and Sun, J. (2015). Deep
residual learning for image recognition. CoRR,
abs/1512.03385.
Huang, G., Liu, Z., and Weinberger, K. Q. (2016).
Densely connected convolutional networks. CoRR,
abs/1608.06993.
Lee, R., Gimenez, F., Hoogi, A., Miyake, K., Gorovoy, M.,
and Rubin, D. (2017). A curated mammography data
set for use in computer-aided detection and diagnosis
research. Scientific Data, 4:170–177.
Paszke, A., Gross, S., Massa, F., Lerer, A., Bradbury, J.,
Chanan, G., Killeen, T., Lin, Z., Gimelshein, N.,
Antiga, L., Desmaison, A., Kopf, A., Yang, E., De-
Vito, Z., Raison, M., Tejani, A., Chilamkurthy, S.,
Steiner, B., Fang, L., Bai, J., and Chintala, S. (2019).
Pytorch: An imperative style, high-performance deep
learning library. In Advances in Neural Information
Processing Systems 32, pages 8024–8035. Curran As-
sociates, Inc.
Shen, L., Margolies, L., Rothstein, J., Fluder, E., McBride,
R., and Sieh, W. (2019). Deep learning to improve
breast cancer detection on screening mammography.
Scientific Reports, 9:1–12.
Simonyan, K. and Zisserman, A. (2015). Very deep convo-
lutional networks for large-scale image recognition.
Sung, H., Ferlay, J., Siegel, R. L., Laversanne, M., Soerjo-
mataram, I., Jemal, A., and Bray, F. (2021). Global
cancer statistics 2020: Globocan estimates of in-
cidence and mortality worldwide for 36 cancers in
BIOINFORMATICS 2024 - 15th International Conference on Bioinformatics Models, Methods and Algorithms
534

185 countries. CA: a cancer journal for clinicians,
71(3):209—249.
Szegedy, C., Liu, W., Jia, Y., Sermanet, P., Reed, S. E.,
Anguelov, D., Erhan, D., Vanhoucke, V., and Rabi-
novich, A. (2014). Going deeper with convolutions.
CoRR, abs/1409.4842.
Tan, M. and Le, Q. V. (2019). Efficientnet: Rethink-
ing model scaling for convolutional neural networks.
CoRR, abs/1905.11946.
Deep Learning in Breast Calcifications Classification: Analysis of Cross-Database Knowledge Transferability
535
