
Optimization and Learning Rate Influence on Breast Cancer Image
Classification
Gleidson Vinicius Gomes Barbosa
1 a
, Larissa Ferreira Rodrigues Moreira
1, 2 b
,
Pedro Moises de Sousa
1 c
, Rodrigo Moreira
1 d
and Andr
´
e Ricardo Backes
3 e
1
Institute of Exacts and Technological Sciences, Federal University of Vic¸osa, Rio Parana
´
ıba-MG, Brazil
2
Faculty of Computing (FACOM), Federal University of Uberl
ˆ
andia, Uberl
ˆ
andia-MG, Brazil
3
Department of Computing, Federal University of S
˜
ao Carlos, S
˜
ao Carlos-SP, Brazil
Keywords:
Breast Cancer, CNN, Explainable, Influence of Factors, Classification.
Abstract:
Breast cancer is a prevalent and challenging pathology, with significant mortality rates, affecting both women
and men. Despite advancements in technology, such as Computer-Aided Diagnosis (CAD) and awareness
campaigns, timely and accurate diagnosis remains a crucial issue. This study investigates the performance
of Convolutional Neural Networks (CNNs) in predicting and supporting breast cancer diagnosis, considering
BreakHis and Biglycan datasets. Through a factorial partial method, we measured the impact of optimization
and learning rate factors on the prediction model accuracy. By measuring each factor’s level of influence on
the validation accuracy response variable, this paper brings valuable insights into the relevance analyses and
CNN behavior. Furthermore, the study sheds light on the explainability of Artificial Intelligence (AI) through
factorial partial performance evaluation design. Among the results, we determine which and how much the
hyperparameters tunning influenced the performance of the models. The findings contribute to image-based
medical diagnosis field, fostering the integration of computational and machine learning approaches to en-
hance breast cancer diagnosis and treatment.
1 INTRODUCTION
Although the cancer mortality rate is declining (Ben-
hammou et al., 2020), it represents the greatest barrier
to increasing life expectancy (Sahu et al., 2023), es-
pecially for women, where breast cancer accounts for
30% of the incidence (Clement et al., 2022). Breast
cancer is a pathology caused by the uncontrolled
spread of abnormal cells in the breast (dysplasia),
causing tumors that can invade other organs (Ben-
hammou et al., 2020). Although rare, breast cancer
can also occur in men with about 1% of cases (Alqah-
tani et al., 2022).
Despite the advancement of technology concern-
ing the treatment and diagnosis of breast cancer and
annual incentives with campaigns to carry out exams,
this pathology remains a major problem in our soci-
a
https://orcid.org/0009-0000-2159-335X
b
https://orcid.org/0000-0001-8947-9182
c
https://orcid.org/0000-0003-4563-0033
d
https://orcid.org/0000-0002-9328-8618
e
https://orcid.org/0000-0002-7486-4253
ety, being the most prevalent type of cancer in women
and and second in men (Batra et al., 2020)(Sahu et al.,
2023). Conventional exams require the careful anal-
ysis by a pathologist, consequently resulting in long
waiting periods from the exam to scheduling the next
appointment to present the diagnosis, considering all
procedures performed by the Brazilian Unified Health
System (SUS). Time is crucial for the patient as there
is a continuous proliferation of abnormal cells (INCA,
2021).
Furthermore, the analysis of images by the pathol-
ogist is prone to error due to eye fatigue, human error,
and device-dependent influences, which hinders such
diagnoses. Therefore, pathologists rely on Computer-
Aided Diagnosis (CAD) to assist in the task of identi-
fying and classifying problematic tissues using com-
putational resources in this task (Benhammou et al.,
2020)(Yu et al., 2023)(Sahu et al., 2023).
To achieve this, in addition to improving CAD
methods, it is important to evolve machine learn-
ing techniques to increase the accuracy rate of such
diagnoses (Backes, 2022)(Rodrigues Moreira et al.,
2023)(Gautam, 2023). Therefore, this paper proposes
792
Barbosa, G., Moreira, L., Moises de Sousa, P., Moreira, R. and Backes, A.
Optimization and Learning Rate Influence on Breast Cancer Image Classification.
DOI: 10.5220/0012507100003660
Paper published under CC license (CC BY-NC-ND 4.0)
In Proceedings of the 19th International Joint Conference on Computer Vision, Imaging and Computer Graphics Theory and Applications (VISIGRAPP 2024) - Volume 3: VISAPP, pages
792-799
ISBN: 978-989-758-679-8; ISSN: 2184-4321
Proceedings Copyright © 2024 by SCITEPRESS – Science and Technology Publications, Lda.

to evaluate the performance of computational tech-
niques for predicting and supporting the diagnosis
of breast cancer using two relevant datasets. To ac-
complish this task, we employed the partial facto-
rial method and carried out experiments to measure
the impact of two factors (optimization and learning
rate) and their levels (0.001 and 0.0001) on the val-
idation accuracy response variable. This method en-
ables us to identify which factor is more relevant to
the validation accuracy variable, shedding light on is-
sues of interpretability of Convolutional Neural Net-
work (CNN) models and their behavior, as well as in-
dicating which factors are more promising in terms of
hyperparameter optimization techniques.
The main contribution of this paper is the mea-
surement of the impact of each factor, optimization
and learning rate, individually and in combination, on
the training accuracy result of the models. In addi-
tion, the use of different datasets, such as BreakHis
and Biglycan, contributes to a greater generalization
of the results, as we are not restricted to just one
type of image or context. Also, this study aims to
shed light on explaining Artificial Intelligence (AI)
through factorial partial performance evaluation. Fi-
nally, this study contributes to the area of image-based
medical diagnosis, using computational and machine-
learning approaches.
The remaining sections of this paper are organized
as follows: Section 2 provides an overview of related
works in the literature that are similar to the proposed
approach. Section 3 presents the proposed method for
evaluating CNNs. In Section 4, we present and dis-
cuss the results achieved in this work. Finally, Sec-
tion 5 concludes the discussion and offers some final
remarks.
2 RELATED WORK
Several efforts have been directed toward develop-
ing computational methods based on Artificial Intelli-
gence (AI) to support breast cancer diagnosis, demon-
strating the potential of deep learning with Convo-
lutional Neural Networks (CNNs) to identify breast
cancer in different stages using histopathological im-
ages (Gautam, 2023)(Springenberg et al., 2023).
(Zerouaoui and Idri, 2022) used a fusion of
seven CNNs (DenseNet 201, Inception V3, Inception
ResNet V2, MobileNet V2, ResNet 50, VGG16, and
VGG19) as feature extractors and performed classi-
fication with four different classifiers (Decision Tree,
Support Vector Machine, K-Nearest Neighbors, and
Multilayer Perceptron).
(Abbasniya et al., 2022) employed IRv2-CXL
method for binary classification of the BreakHis
dataset. This method combines the Inception-ResNet-
v2 architecture with an ensemble of CatBoost, XG-
Boost, and LightGBM algorithms. However, the gen-
eralizability of the findings obtained with IRv2-CXL
hasn’t been evaluated in other datasets.
(Macedo et al., 2022) evaluated five CNNs trained
on the BreakHis dataset to learn to distinguish be-
tween benign and malignant tumor nuclei. They sub-
sequently tested these CNNs on a different dataset
to classify and interpret tumor nuclei, quantifying
the number of tumor nuclei cells in the segmented
heat map generated by Grad-CAM after classifica-
tion. However, they did not investigate the impact of
parameters on classification and interpretation behav-
iors, limiting the depth of their analysis.
(Maleki et al., 2023) proposed an approach
based on transfer learning for feature extraction from
histopathological images in the BreakHis dataset.
They used the extracted features as input for the ex-
treme gradient boosting (XGBoost) classifier. The
study evaluated different combinations of classifiers
and pre-trained networks to enhance the classification
performance.
(Majumdar et al., 2023) introduced a novel en-
semble method based on rank fusion using the
Gamma function. It combines the confidence
scores of three transfer learning-based CNN mod-
els (GoogleNet, VGG11, and MobileNetV3). They
specifically designed the ensemble model to classify
breast histopathology images into two classes.
(Silva Neto, 2022) proposed a new dataset consist-
ing of photomicrographs of the immunohistochemi-
cal expression of Biglycan (BGN) in breast tissue, in-
cluding both cancerous and non-cancerous samples.
Additionally, the study developed a CNN model in-
spired by LeNet-5 and evaluated its performance for
classification. However, the author did not incor-
porate transfer learning and data augmentation tech-
niques to address the limited number of images in the
dataset.
Previous studies have focused on breast cancer
classification using CNNs, but overlooked optimiza-
tion and learning rate influence. To address this is-
sue, we propose a novel approach that evaluates CNN
performance, emphasizing interpretability, behavior,
and key factors for hyperparameter optimization us-
ing partial factorial design.
3 PROPOSED APPROACH
We propose a comparative method to verify the in-
fluence of the optimizer and Learning Rate (LR) fac-
Optimization and Learning Rate Influence on Breast Cancer Image Classification
793

tors on the accuracy of different CNNs. Figure 1 il-
lustrates the proposed method, which is divided into
three (3) phases, as described as follows.
1 First Phase: consists of training and validat-
ing six (6) different CNNs using the BreakHis (Span-
hol et al., 2016) dataset, varying the optimizer param-
eters, and LR. The BreakHis breast cancer dataset
consists of 7,909 microscopic images of breast tumor
tissue from 82 patients, divided into benign (2,480 im-
ages) and malignant (5,429 images) tumors, with 700
× 460 pixels size. At the end of this phase, we veri-
fied which CNN performs better in the binary classi-
fication task.
2 Second Phase: another dataset was consid-
ered, Biglycan (da Silva Neto et al., 2023), which is
also from the context of breast cancer. The Bigly-
can breast cancer dataset consists of photomicro-
graphs depicting the immunohistochemical expres-
sion of Biglycan (BGN) in breast tissue, both with
and without cancer. The dataset comprises a total of
336 images with 128 × 128 pixels size and contains
two (2) categories: malignant (203) and benign (133).
In this phase, the goal is to verify which CNN per-
forms better in the classification task using Biglycan
dataset.
For both phases ( 1 and 2 ), we considered the
variations of the optimizer parameters – Adam and
Stochastic Gradient Descent (SGD) – and LR accord-
ing to Table 1, leading to seventy-two (72) differ-
ent training types of CNNs. Also, the datasets were
randomly partitioned into 80% for training and 20%
for testing. Finally, we resized all images to 224 ×
224 pixels size and conducted the experiments using
Python (version 3.8) and Pytorch 2.0 framework.
Table 1: Experiment Combinations for each CNN.
AlexNet EfficientNet ResNet-50 ShuffleNet SqueezeNet VGG-16
Learning
Rate
0.01 0.01 0.01 0.01 0.01 0.01
0.001 0.001 0.001 0.001 0.001 0.001
0.0001 0.0001 0.0001 0.0001 0.0001 0.0001
Optimizer
SGD SGD SGD SGD SGD SGD
Adam Adam Adam Adam Adam Adam
Dataset
BreakHis BreakHis BreakHis BreakHis BreakHis BreakHis
Biglycan Biglycan Biglycan Biglycan Biglycan Biglycan
3 Third Phase: consists of evaluating, using
the partial factorial technique, based on the sum of
squares, which factor impacts the most on the vali-
dation accuracy response variable. For this, we re-
duced the experimental space from 72 to eight differ-
ent types of experiments. We selected the CNN with
the best classification performance for each dataset
and submitted it to a performance validation using the
partial factorial design.
We based our reduced experimental design on a
partial factorial with two factors and two levels la-
beled as (-1) and (1) according to Table 2. The
first factor in our study is the Optimizer, followed by
the LR. The Optimizer factor comprises two levels:
Adam and SGD. The LR factor includes the follow-
ing levels: 0.001 and 0.0001.
Table 2: Detailing of factors and levels with their Labels.
Levels
Factors
Optimizer - A SGD (-1) Adam (1)
Learning Rate (LR) - B 0.001 (-1) 0.0001 (1)
Through the partial factorial method, we com-
bined the factors and levels by providing an experi-
mental combination according to Table 3. Thus, with
a regression model, we carried out four experiments,
using the combinations of each factor and level and
measuring their influence on the Response Variable
(y).
Table 3: Experiments Combinations.
Experiment
Learning
Rate (LR)
Optimizer
Val.
Accuracy
#1 -1 (0.001) -1 (SGD) y
1
#2 1 (0.0001) -1 (SGD) y
2
#3 -1 (0.001) 1 (Adam) y
3
#4 1 (0.0001) 1 (Adam) y
4
The goal of the third phase is to conduct a perfor-
mance evaluation by doing four experiments for each
dataset, following the combination in Table 3. Ini-
tially, we consider SGD as the level of the optimiza-
tion function factor, which is an iterative method for
optimizing an objective function with differentiable
or sub-differentiable smoothness properties. It can be
considered a stochastic approximation of gradient de-
scent optimization, as it replaces the actual gradient
with an estimate of it. Especially in high-dimensional
optimization problems, this reduces the high compu-
tational cost, thus achieving faster iterations in ex-
change for a lower convergence rate. SGD is repre-
sented by Equation 1.
w
t+1
= w
t
−η
t
∇E(w
t
, b
t
) (1)
Where w
t
is the vector of parameters estimated in the
t iteration, η
t
is the learning rate, and ∇E(w
t
, b
t
) is the
gradient of the objective function concerning the pa-
rameters. The goal of the performance evaluation in
phase three (3) is to measure the percentage influence
of the η
t
(component of Equation 1) on the validation
accuracy.
The other level of the optimization function factor
that we experimented with in our performance eval-
VISAPP 2024 - 19th International Conference on Computer Vision Theory and Applications
794

Open-Source
Datasets
}
BreakHis
Biglycan
Training and Evaluating
six (6) CNNs
Feeds Setup
For each
Dataset
Performance
Evaluation
}
Influence of
Factors
Better CNNs
7909
336
}
Factors:
• Optimizer
• Learning Rate
Output
Malignant
Benign
Figure 1: Proposed method.
uation is Adam, represented by Equation 2. Adam
maintains an individual adaptive learning rate for each
parameter of the model based on first-order moment
estimates (gradient) and second-order moment esti-
mates (moment). Additionally, it adjusts the learning
rate adaptively for each parameter, allowing larger up-
dates for common parameters and smaller updates for
less common parameters.
θ
0
= θ −α
ˆm
√
ˆv + ε
(2)
Where θ is the updated parameter, θ
0
is the new
parameter value, α is the interactive learning rate,
ˆm represents the first-order momentum, ˆv represents
the second-order momentum, and ε is the smoothing
term. Therefore, with the performance evaluation de-
sign in phase three (3) of our method, it will be possi-
ble to verify the percentage influence of the α (a com-
ponent of Equation 2) on the optimization function
and, consequently, on the validation accuracy.
The Partial Factorial Method. To evaluate in-
fluence’s level of each factor, we used the Sum of
Squares. The regression model for the partial facto-
rial design (2
2
) is represented by Equation 3.
y = q
0
+ q
A
x
A
+ q
B
x
B
+ q
AB
x
AB
(3)
The individual coefficients of each regression
component can be obtained by breaking down Equa-
tion 3. The q
0
value, commonly referred to as the
intercept term, signifies the baseline value of the de-
pendent variable when all the other factors within the
model are held at zero. By substituting the follow-
ing four observations into the regression model, we
can obtain the values of q
0
, q
A
, q
B
, and q
AB
according
to the equations below: q
0
=
1
4
×(y
1
+ y
2
+ y
3
+ y
4
),
q
A
=
1
4
×(−y
1
+ y
2
−y
3
+ y
4
), q
B
=
1
4
×(−y
1
−y
2
+
y
3
+ y
4
), and q
AB
=
1
4
×(y
1
−y
2
−y
3
+ y
4
).
Using the values of q
0
, q
A
, q
B
, and q
AB
, we can
calculate the sum of squares, which represents the to-
tal variation in the response variable (y), as well as the
variations attributed to the influence of factor A, fac-
tor B, and the interaction between A and B. The total
variance of y, known as the Total Sum of Squares, is
determined by Equation 4.
SST = 2
2
q
2
A
+ 2
2
q
2
B
+ 2
2
q
2
AB
(4)
The Sum of Squares due to the influence of A is
SS
A
= 2
2
·q
2
A
. The influence of A is given by
SS
A
SST
.
Similarly, the Sum of Squares due to the influence of
B is SS
B
= 2
2
·q
2
B
, and the influence of Factor B as
SS
B
SST
. Lastly, we obtain the Sum of Squares due to the
influence of Factors A and B together as SS
AB
= 2
2
·
q
2
AB
, and the influence of Factors A and B combined
as
SS
AB
SST
.
4 RESULTS AND DISCUSSION
Initially, the six different CNNs:
AlexNet (Krizhevsky et al., 2012), Efficient-
Net (Tan and Le, 2020), ResNet-50 (He et al., 2016),
ShuffleNet (Ma et al., 2018), SqueezeNet (Han et al.,
2016), and VGG-16 (Simonyan and Zisserman,
2014)) were trained on each set of breast cancer
images (BreakHis and Biglycan), considering train-
ing with data augmentation based on horizontal
and vertical flips, and random rotation (-10
◦
and
10
◦
). Thus, according to Table 4, we recorded the
best accuracy scores for each CNN, considering
the combinations from Table 3. As indicated in
Optimization and Learning Rate Influence on Breast Cancer Image Classification
795

Table 4, EfficientNet CNN performed the best result
on the BreakHis dataset, achieving an accuracy of
98.86%. Additionally, we report the best alpha (α)
and the best optimizer, which in this case is Adam.
Moving to the right side of Table 4, we find that
the ShuffleNet performed the best on the Biglycan
dataset, achieving an accuracy of 97.06% based on
the validation accuracy.
Figure 2 presents loss and accuracy graphs to en-
rich our understanding of the generalization capacity
of the better CNNs on the evaluated datasets. For the
BreakHis, it is worth noting that CNN EfficientNet
has a gradual learning process over epochs. Nonethe-
less, for the dataset Biglycan and ShuffleNet, it is sug-
gestive that up until the 20
th
epoch, there is a pro-
gressive and suggestive learning pattern. However,
in the subsequent epochs, the optimization function
behaves inconsistently, resulting in irregular weights
adjustment of the CNN throughout the epochs.
We selected the best CNN for each dataset based
on the accuracies reported in Table 4. Therefore, we
evaluated the influence of the optimizer and learning
rate (LR) factors on the accuracies of these CNNs.
The first set of experiments aimed to ensure that
the CNNs were able to generalize on both datasets,
BreakHis and Biglycan. The accuracy achieved on the
BreakHis dataset is comparable to the state-of-the-art.
However, Biglycan presented greater challenges for
the CNNs due to its limited number of images. The
second set of experiments involved combining differ-
ent configurations and testing these combinations in a
partial factorial design.
Table 5 presents the validation accuracies for
different combinations of optimizers and learning
rates (LR). For the BreakHis dataset, the CNN that
achieved the highest performance (98.86%) was Effi-
cientNet, using the Adam optimizer and LR of 0.001.
Meanwhile, the best CNN for the Biglycan dataset
was ShuffleNet, with an accuracy of 97.07% and us-
ing Adam optimizer and LR of 0.001. Tables 6 and 7
report the results of the second set of experiments in
phase three (3) of our method.
Table 6 reports the percentage of influence of
each factor (q
A
, q
B
, and q
AB
) on the response vari-
able, validation accuracy. The results obtained for the
BreakHis dataset (Table 6) allow us to infer that the
influence of Factor A, i.e., the optimizer alone, rep-
resents an impact of approximately 21.41% on the
response variable, validation accuracy. On the other
hand, Factor B (learning rate – LR) isolated repre-
sents an impact of approximately 23.60% on the re-
sponse variable, validation accuracy. Lastly, we ob-
served that the influence of Factors A and B (Opti-
mization Function and Learning Rate) simultaneously
has a predominant impact of approximately 55.00%
on the response variable, validation accuracy.
We sought to understand whether this behavior
of the optimizer and learning rate factors’ influence
(q
A
, q
B
, and q
AB
) carries over to other problems and
datasets. Therefore, we carried out a performance
evaluation using the Biglycan dataset and reported our
findings in Table 7. We found that the influence of
the optimizer and learning rate factors changes across
problem classes and datasets. This perception is sup-
ported by the fact that the simultaneous influence of
Factors A and B (Optimizer and LR) is negligible, ac-
counting for approximately 1.79%. Meanwhile, Fac-
tor A (Optimizer) solely exerted a predominant influ-
ence of approximately 96.41% on the response vari-
able, validation accuracy, for this dataset. On the
other hand, Factor B (LR) alone had a negligible in-
fluence of approximately 1.79%.
Among the numerical findings suggested by our
experiments, it is possible to recognize that formal
analyses of factor influence using the partial factorial
method can help guide optimization efforts toward
factors that truely impact validation accuracy. Hy-
perparameter optimizers are recommended for fine-
tuning CNNs, and the insights from our experiments
can inspire new criteria for hyperparameter optimiza-
tion, directing the tuning toward the search spaces of
factors that have a predominant influence over others.
Finally, our best results achieved for each dataset
were compared with other state-of-the-art approaches
in the literature, as presented in Table 8. Our findings
indicate that our best score exceeds the performance
of the best state-of-the-art technique reported in pre-
vious studies.
5 CONCLUSION
This paper evaluated the extent to which two factors
(optimization function and learning rate) influence the
response variable and validation accuracy. To accom-
plish this, we proposed a three-fold method, where the
initial two (2) phases involved training and validat-
ing six different CNNs using various parameter com-
binations and the two datasets, BreakHis and Bigly-
can. Subsequently, in the third phase, we selected two
(2) CNNs that outperformed the others in the classi-
fication task and conducted a performance evaluation
based on the sum of squares.
We found that the CNNs EfficientNet and Shuf-
fleNet empirically outperformed the others in the clas-
sification task on the BreakHis and Biglycan datasets,
achieving accuracies of 98.86% and 97.06%, both re-
spectively. Additionally, our paper introduces an in-
VISAPP 2024 - 19th International Conference on Computer Vision Theory and Applications
796
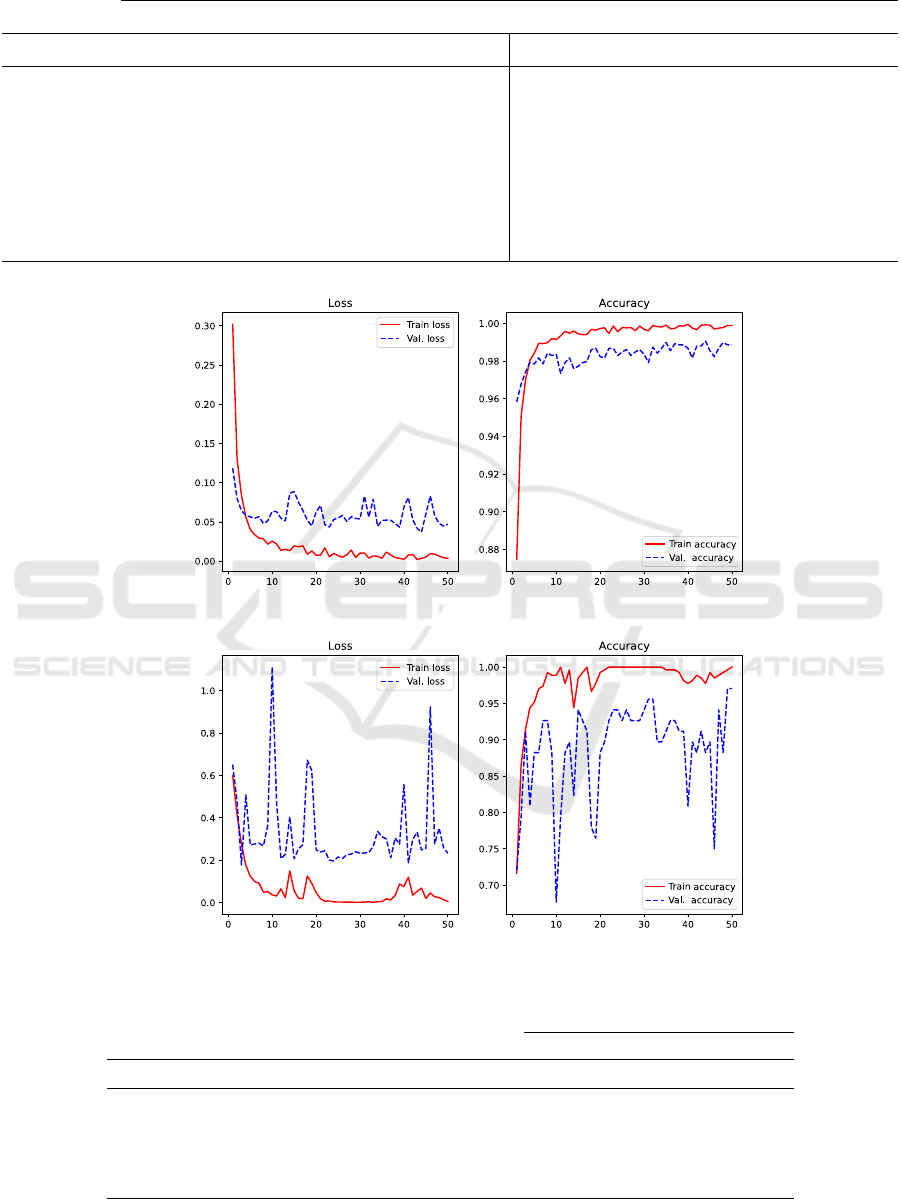
Table 4: Overall CNNs Higher Performance.
Breakhis Biglycan
CNN alfa (α) Acc. Train Acc. Val. Optimizer alfa (α) Acc. Train Acc. Val. Optimizer
AlexNet 0.0001 99.87% 97.35% SGD 0.0001 100% 91.18% Adam
EfficientNet 0.0001 99.89% 98.86% Adam 0.0001 100% 94.12% Adam
ResNet-50 0.01 99.98% 98.80% SGD 0.01 100% 95.59% SGD
ShuffleNet 0.01 99.25% 98.29% SGD 0.001 100% 97.06% Adam
SqueezeNet 0.0001 95.84% 96.84% Adam 0.0001 100% 94.12% Adam
VGG-16 0.001 100% 98.55% SGD 0.001 100% 95.59% SGD
(a)
Epochs Epochs
(b)
Epochs Epochs
Figure 2: Generalization behavior through Loss and Accuracy Functions: (a) BreakHis; (b) Byglycan.
Table 5: Accuracies of the four (4) combinations of experiments for each dataset.
Factors Response Variable: Val. Acc.
Optimizer - A Learning Rate (LR) - B AB BreakHis Biglycan
SGD (-1) 0.001 (-1) 1 98.74% 60.29%
Adam (1) 0.001 (-1) -1 92.48% 97.06%
SGD (-1) 0.0001 (1) -1 97.41% 60.29%
Adam (1) 0.0001 (1) 1 98.86% 88.24%
Optimization and Learning Rate Influence on Breast Cancer Image Classification
797

Table 6: Breakhis: Estimation of The Influence of Factors,
A, B, and AB Jointly.
Parameters
Estimated
Variance
Variance (%)
Val. Acc. Val. Acc.
q
0
0.9687
q
A
(Optimizer) -0.0120 21.41%
q
B
(LR) 0.0126 23.60%
q
AB
(Optimizer + LR) 0.0192 55.00%
Table 7: Biglycan: Estimation of The Influence of Factors,
A, B, and AB Jointly.
Parameters
Estimated
Variance
Variance (%)
Val. Acc. Val. Acc.
q
0
0,7647
q
A
(Optimizer) 0.1618 96.41%
q
B
(LR) -0.0220 1.79%
q
AB
(Optimizer + LR) -0.0225 1.79%
Table 8: Short Comparison with literature.
Dataset Method Accuracy (%)
BreakHis
(Zerouaoui and Idri, 2022) 92.56
(Abbasniya et al., 2022) 96.46
(Maleki et al., 2023) 91.9
(Majumdar et al., 2023) 98.05
Our approach 98.86
Biglycan (Silva Neto, 2022) 93
Our approach 97.06
novative approach by conducting a performance eval-
uation based on the sum of squares to estimate the
influence of the optimizer and learning rate on val-
idation accuracy. Using this method, we were able
to determine that the combined influence of the opti-
mizer and learning rate accounted for approximately
55.00% of the validation accuracy for the BreakHis
dataset. Meanwhile, the optimizer factor alone had
a predominant influence on validation accuracy, ac-
counting for approximately 96.41% in the Biglycan
dataset.
In addition to the reported quantitative results, our
method provides insights and sheds light on a rele-
vant issue in the context of optimization methods by
indicating the percentage of the relevance of a vari-
able in the optimization process and search within fi-
nite spaces. This empowers new efforts in exhaustive
searches for variables that effectively impact the ob-
jective function.
In future work, we plan to evaluate the influence
of other factors such as batch size and the internal
structure of the CNN, as well as assess patterns of
influence across different datasets. In addition, we in-
tend to expand the experiments by considering mul-
ticlass classification and expand the gathered insights
and conclusions into more general and practically us-
able heuristics.
ACKNOWLEDGMENTS
This study was financed in part by the Coordenac¸
˜
ao
de Aperfeic¸oamento de Pessoal de N
´
ıvel Superior
– Brasil (CAPES) – Finance Code 001. Andr
´
e R.
Backes gratefully acknowledges the financial support
of CNPq (Grant #307100/2021-9).
REFERENCES
Abbasniya, M. R., Sheikholeslamzadeh, S. A., Nasiri,
H., and Emami, S. (2022). Classification of Breast
Tumors Based on Histopathology Images Using
Deep Features and Ensemble of Gradient Boosting
Methods. Computers and Electrical Engineering,
103:108382.
Alqahtani, Y., Mandawkar, U., Sharma, A., Hasan,
M. N. S., Kulkarni, M. H., and Sugumar, R.
(2022). Breast Cancer Pathological Image Clas-
sification Based on the Multiscale CNN Squeeze
Model. Computational Intelligence and Neuro-
science, 2022:7075408.
Backes, A. R. (2022). Pap-smear image classification by
using a fusion of texture features. In 2022 35th SIB-
GRAPI Conference on Graphics, Patterns and Images
(SIBGRAPI), volume 1, pages 139–144.
Batra, K., Sekhar, S., and Radha, R. (2020). Breast can-
cer detection using cnn on mammogram images. In
Smys, S., Tavares, J. M. R. S., Balas, V. E., and
Iliyasu, A. M., editors, Computational Vision and Bio-
Inspired Computing, pages 708–716, Cham. Springer
International Publishing.
Benhammou, Y., Achchab, B., Herrera, F., and Tabik, S.
(2020). Breakhis based breast cancer automatic di-
agnosis using deep learning: Taxonomy, survey and
insights. Neurocomputing, 375:9–24.
Clement, D., Agu, E., Obayemi, J., Adeshina, S., and
Soboyejo, W. (2022). Breast cancer tumor classifi-
cation using a bag of deep multi-resolution convolu-
tional features. Informatics, 9(4).
da Silva Neto, P. C., Kunst, R., Barbosa, J. L. V., Lein-
decker, A. P. T., and Savaris, R. F. (2023). Breast can-
cer dataset with biomarker biglycan. Data in Brief,
47:108978.
Gautam, A. (2023). Recent advancements of deep learn-
ing in detecting breast cancer: a survey. Multimedia
Systems, 29(3):917–943.
Han, S., Liu, X., Mao, H., Pu, J., Pedram, A., Horowitz,
M. A., and Dally, W. J. (2016). EIE: Efficient Infer-
VISAPP 2024 - 19th International Conference on Computer Vision Theory and Applications
798

ence Engine on Compressed Deep Neural Network.
SIGARCH Comput. Archit. News, 44(3):243–254.
He, K., Zhang, X., Ren, S., and Sun, J. (2016). Deep Resid-
ual Learning for Image Recognition. In 2016 IEEE
Conference on Computer Vision and Pattern Recogni-
tion (CVPR), pages 770–778.
INCA, I. N. d. C. (2021). Detecc¸
˜
ao Precoce do C
ˆ
ancer,
volume 1. Minist
´
erio da Sa
´
ude.
Krizhevsky, A., Sutskever, I., and Hinton, G. E. (2012). Im-
ageNet Classification with Deep Convolutional Neu-
ral Networks. In Pereira, F., Burges, C. J. C., Bottou,
L., and Weinberger, K. Q., editors, Advances in Neu-
ral Information Processing Systems, volume 25, pages
1097–1105. Curran Associates, Inc.
Ma, N., Zhang, X., Zheng, H.-T., and Sun, J. (2018). Shuf-
fleNet V2: Practical Guidelines for Efficient CNN Ar-
chitecture Design. In Proceedings of the European
Conference on Computer Vision (ECCV), pages 116–
131.
Macedo, D. C., John W. S., D. L., Santos, V. D., Tasso
L. O., M., Fernando M. P., N., Arrais, N., Vinuto,
T., and Lucena, J. (2022). Evaluating Interpretabil-
ity in Deep Learning using Breast Cancer Histopatho-
logical Images. In 2022 35th SIBGRAPI Conference
on Graphics, Patterns and Images (SIBGRAPI), vol-
ume 1, pages 276–281.
Majumdar, S., Pramanik, P., and Sarkar, R. (2023). Gamma
function based ensemble of cnn models for breast can-
cer detection in histopathology images. Expert Sys-
tems with Applications, 213:119022.
Maleki, A., Raahemi, M., and Nasiri, H. (2023). Breast can-
cer diagnosis from histopathology images using deep
neural network and XGBoost. Biomedical Signal Pro-
cessing and Control, 86:105152.
Rodrigues Moreira, L. F., Moreira, R., Travenc¸olo, B.
A. N., and Backes, A. R. (2023). An Artificial
Intelligence-as-a-Service Architecture for deep learn-
ing model embodiment on low-cost devices: A case
study of COVID-19 diagnosis. Applied Soft Comput-
ing, 134:110014.
Sahu, Y., Tripathi, A., Gupta, R. K., Gautam, P., Pateriya,
R. K., and Gupta, A. (2023). A CNN-SVM based
computer aided diagnosis of breast Cancer using his-
togram K-means segmentation technique. Multimedia
Tools and Applications, 82(9):14055–14075.
Silva Neto, P. C. d. (2022). BGNDL: Arquitetura de Deep
Learning para diferenciac¸
˜
ao da prote
´
ına Biglycan em
tecido mam
´
ario com e sem c
ˆ
ancer. Master’s thesis,
Universidade do Vale do Rio dos Sinos, Brazil.
Simonyan, K. and Zisserman, A. (2014). Very Deep Con-
volutional Networks for Large-Scale Image Recogni-
tion. CoRR, abs/1409.1556.
Spanhol, F. A., Oliveira, L. S., Petitjean, C., and Heutte,
L. (2016). A Dataset for Breast Cancer Histopatho-
logical Image Classification. IEEE Transactions on
Biomedical Engineering, 63(7):1455–1462.
Springenberg, M., Frommholz, A., Wenzel, M., Weicken,
E., Ma, J., and Strodthoff, N. (2023). From mod-
ern cnns to vision transformers: Assessing the per-
formance, robustness, and classification strategies of
deep learning models in histopathology. Medical Im-
age Analysis, 87:102809.
Tan, M. and Le, Q. V. (2020). EfficientNet: Rethinking
Model Scaling for Convolutional Neural Networks.
Yu, D., Lin, J., Cao, T., Chen, Y., Li, M., and Zhang, X.
(2023). Secs: An effective cnn joint construction strat-
egy for breast cancer histopathological image classifi-
cation. Journal of King Saud University - Computer
and Information Sciences, 35(2):810–820.
Zerouaoui, H. and Idri, A. (2022). Deep hybrid architec-
tures for binary classification of medical breast cancer
images. Biomedical Signal Processing and Control,
71:103226.
Optimization and Learning Rate Influence on Breast Cancer Image Classification
799
