
Dynamic Characteristic of the Pleural Cavity Pressure Sensor
T. Mimra
1
, M. Cerny
1
, C. Guerin
2
and N. Noury
3
1
VSB – Technical University of Ostrava, Czechia
2
University Hospital, Hospices Civils de Lyon, France
3
University of Lyon, Lab INL, France
Keywords: Pleural Cavity Pressure, 3D Printing, Implantable Sensor.
Abstract: We are developing an implantable sensor to measure the interface pressure in the pleural cavity. A 3D printing
process was used to evaluate different shapes and materials for the transducer part. The better compromise
resulted in a disk-shaped, 10 cm diameter, printed with biocompatible TPU (Thermoplastic polyurethane)
filaments with a hardness 92A, offering the best compromise in terms of static sensitivity. We now investigate
the dynamic characteristics of our sensor.
1 INTRODUCTION
The first functional model of breathing was
developed in 1674 by John Mayow (J. R. Partington,
1956), reproducing the inhalation mechanism. It was
made with a balloon inserted into a transparent bigger
one. The inner balloon was opened to ambient
pressure, so that when outer balloon expanded, the
inner balloon was undergoing passive expansion, and
thus air started flowing inside the inner balloon.
Graham (Evarts Ambrose Graham, n. d.; Aboud,
F. C, Vergheze, and A. C., Evarts Ambrose Graham,
2002) was the first to observe the negative pressure
inside the intrapleural cavity - located between the
lungs and chest - and to explain its contribution to
respiratory mechanics. Actually, lungs follow the
periodic movements of the chest thanks to this
existing negative pressure inside the intrapleural
cavity (Ppl). The Ppl is approximately -0.6 cmHg
during inhale and -0.25 cmHg during exhale.
In some conditions, the intrapleural pressure Ppl
is measured to access parameters like the Pressure-
Time Product (PT product), the Work of Breathing
(WOB) or the transpulmonary pressure, which are
essential in selecting ventilation strategy and in
preventing patients from lung overdistention.
The intraesophageal pressure (Pes) is currently
preferred to the direct pleural manometry (Milic-
Emili, et al., 1964). It is uncomfortable to the patient,
who must swallow the balloon with catheter, but is
less dangerous. Still, this method suffers limitations.
In particular it is difficult to control the correct
placement of the balloon at the esophageal site
without imagery guidance. Furthermore, it was
recently demonstrated that the intrapleural and
esophageal pressures, are not correlated in some body
orientations (N. Terzi, S., etal., n.d.; C. Guerin, et. al.,
2021).
Therefore, we investigated the development of an
interface pressure sensor to allow the direct
measurement of Ppl inside the pleural cavity. We
earlier described the design of our intrapleural
pressure sensor (T. Mimra, et al., 2022), the clinical
evaluation of our first prototype (N. Terzi, S., et al.,
n.d.), then the production of a 3D-printed model
(FDM) with various shapes and materials. The better
compromise resulted in a disk shape, 10 cm diameter,
printed with biocompatible TPU (Thermoplastic
polyurethane) filaments with a hardness 92A and
offering the best compromise in terms of static
sensitivity. We now investigate the dynamic
characteristics of our sensor.
2 THE 3D-PRINTED
INTRAPLEURAL PRESSURE
SENSOR
2.1 Balloon Designs
Our sensor is mainly composed of a balloon (Figure 1,
2), to be inserted into the pleural cavity.
Mimra, T., Cerny, M., Guerin, C. and Noury, N.
Dynamic Characteristic of the Pleural Cavity Pressure Sensor.
DOI: 10.5220/0012488700003657
Paper published under CC license (CC BY-NC-ND 4.0)
In Proceedings of the 17th Inter national Joint Conference on Biomedical Engineering Systems and Technologies (BIOSTEC 2024) - Volume 1, pages 181-184
ISBN: 978-989-758-688-0; ISSN: 2184-4305
Proceedings Copyright © 2024 by SCITEPRESS – Science and Technology Publications, Lda.
181
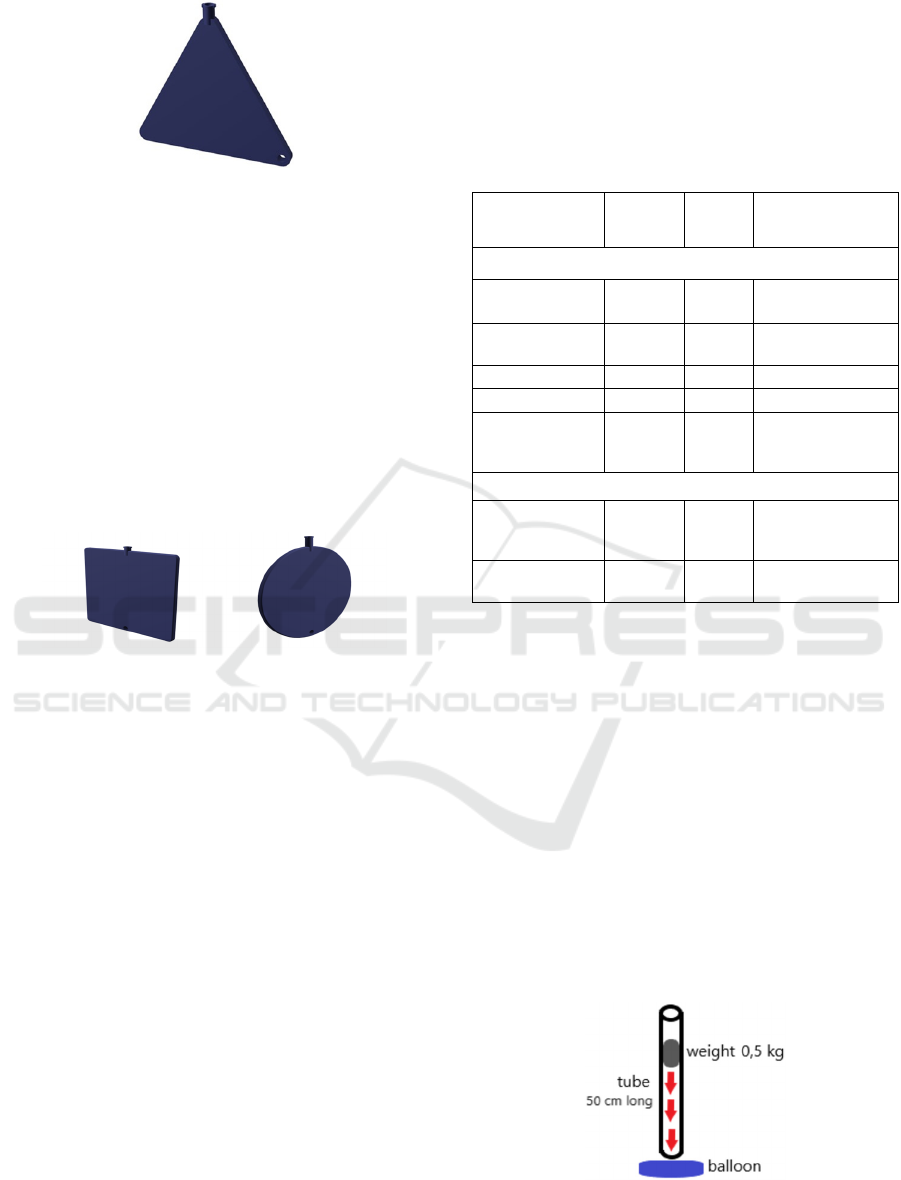
Figure 1: Our first triangle balloon. We notice the Luer
Lock fitting (on top) and the handle (right down).
From the first clinical experimentations, we
understood that we must pay attention to the shape of
the balloon in order to prevent from internal tissue
injuries at insertion and during operations. The
surgeons prefer a form factor thin enough to be
installed inside the pleural cavity but large enough to
be easily manipulated. Therefore, we proposed a
thickness of 5 mm within a 3D frame 10 cm by 10 cm,
which fits in the intrapleural cavity while offering a
maximum mechanical transfer surface and easy
handheld. We envisaged various shapes – square,
triangular and disk – (Figure 1, 2).
Figure 2: The disk balloon (right) has a diameter of 10 cm,
the square balloon (left) has a side of 10 cm.
Furthermore, the material of the balloon must meet
the constraints for biocompatibility (no material
release) and waterproofing. Other operational aspects
concern the mechanical compatibility with the
standard Luer Lock fitting, and the provision of a
handle to facilitate the surgeon task when placing the
balloon into the pleural cavity.
The balloon is currently connected to a
commercial pressure sensor (MLT1199 BP
Transducer, ADinstruments) through a 1-meter long
tubing. The signal of the pressure sensor further feeds
a data-acquisition system (PowerLab 4/26,
ADinstruments), for filtering and digital conversion.
The digital signal is processed with a specific
instrumentation software (LabChart7, AD
Instruments).
2.2 Balloon Materials
Materials selected for printing the balloons must be
biocompatible and flexible enough to conform with
the inner cavity. Materials for 3D FDM printing are
called filaments and resins are used for SLA 3D
printing. The hardness of the flexible filaments is the
shore, ranging from 10 for soft materials up till 100 for
extra hard one. We fabricated 28 balloons with
various shapes and various (7) materials selected for
their biocompatibility (Table 1),
Table 1: Hardeness of filaments used for FDM and resins
for SLA.
Material Marking Shore
Commercial
Name
FDM printing
Thermoplastic
Polyurethane
TPU
92A
Ultimaker TPU 95A
Thermoplastic
Elastomer
TPE 95A Gembird TPE
flexible
Polypropylene PP 32D Ultimaker PP 32D
Polylactic Acid PLA rigid Prusament PLA
PolyEthylene
Terephthalate
Glycol
PETG rigid Prusament PETG
SLA printing
Photopolymer
resin TPU
TPU resin 85 - 90
A
eSUN LCD UV
405nm TPU-Like
Resin
Photopolymer
resin
-Rigid
Resin
rigid
ANYCUBIC 405nm
UV Sensitive Resin
3 TESTS AND RESULTS
In this section, we present the results of our tests for
the 3 shapes of balloons printed in TPU92A
(Thermoplastic polyurethane) and in TPE95A
(Thermoplastic elastomer).
3.1 Percussive Response Tests
The balloon, filled with water, is placed under a tube
guide (diameter 5cm, length 70 cm) in which
a roll-
shaped weight of 500 g is lowered from a height
of 50 cm, thus producing a percussion at impact
on the surface of the balloon (Figure 3).
Figure 3: The experimental set-up for the dynamic
percussive response.
BIODEVICES 2024 - 17th International Conference on Biomedical Electronics and Devices
182
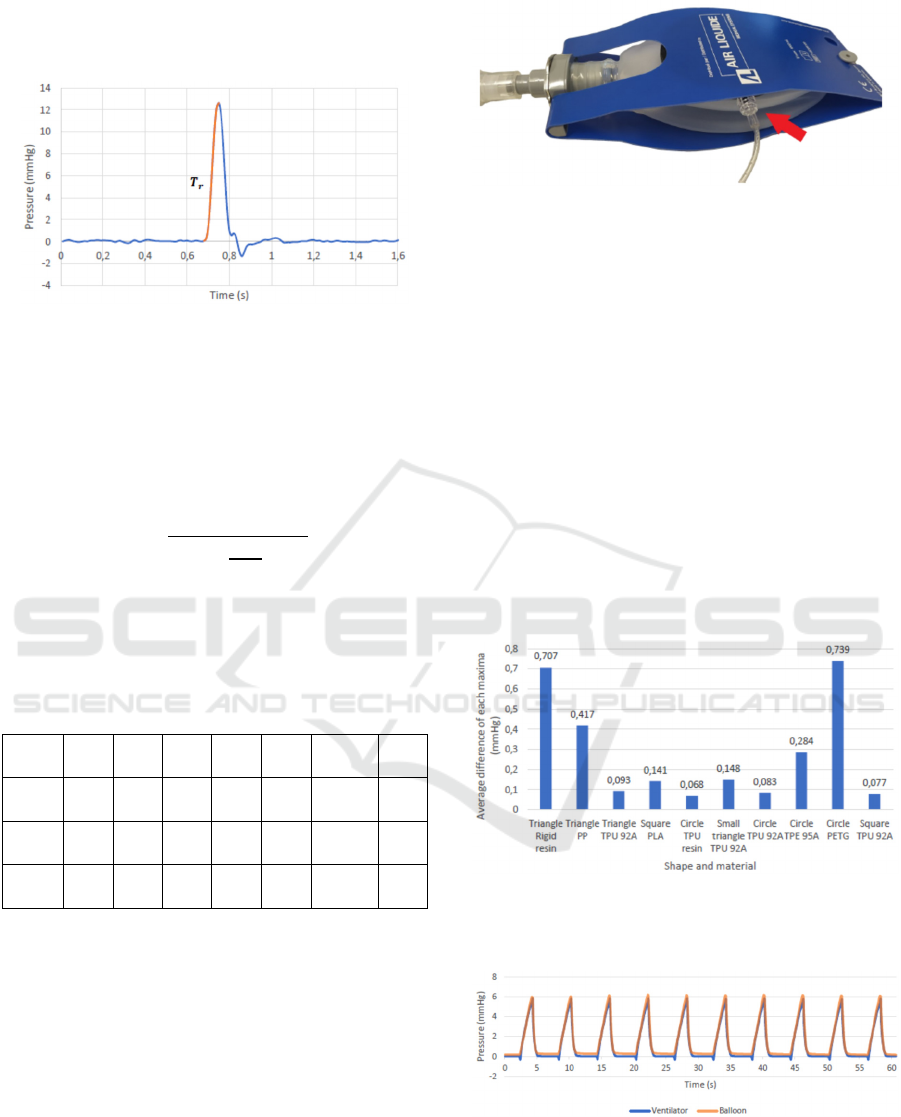
The transient signal output of the pressure sensor
after impact (Figure 4), is recorded in order to
compute the time constant of the sensor.
Figure 4: Typical transient response after a percussion.
Considering the transfer function of the sensor
being of a first-order type, the temporal response time
(Tr) at 63% of the final (end) response, corresponds to
the time constant of the First-Order model, and thus to
the equivalent cut-off frequency (Fr) following
equation:
𝐹
1
2∙𝜋∙
𝑇
100
∙63
The dynamic tests are repeated 10 times for each
device for averaging the time response at 63% and to
derive the mean equivalent cutoff frequency (Table 2).
Table 2: The equivalent cut-off frequency (Hz) of the Ppl
sensor, for various shapes and materials.
PETG PLA PP
Resin
TPE
95A
TPU
92A
TPU
Resin
Triangle
2.3 3.2 6.2 4.3 26.6 60.6 36.2
Square
2.8 2.4 5.0 4.2 28.8 39.8 47.2
Disk
2.2 2.6 3.6 4.5 27.9 44.0 47.2
Any shape printed from TPU92A and TPU resin
offers a satisfying bandwidth. The normal respiration
rate being 0.2 to 0.34 Hz, the sampling frequency
domain will be 34 Hz if considering a convenient
oversampling ratio of 100.
3.2 Frequency Response Tests
In this test, we now evaluate the frequency response
of the Ppl sensor to a periodic respiratory stimulation.
The respiration is simulated with an artificial lung
connected to a medical ventilator (Monnal T50, Air
Liquide; Figure 5).
Figure 5: The measuring balloon is inserted inside the
artificial lung.
Controlled respiration was measured by a flow
sensor (ML 311, ADinstruments), connected to the
ventilator tube, for comparing recorded curve of the
ventilator and curve of the measuring balloon. The
pressure was recorded from the pressure sensor
(MLT1199 BP Transducer, ADinstruments). This test
was performed with following balloons: all measuring
balloons made from TPU 92A, triangle balloon made
from PP and rigid resin, disk balloon made from TPU
resin, PETG and TPE, squared balloon made from
PLA (Figure 6).
The experiment lasted 60 seconds, the number of
breaths which were recorded depended on the set
frequency of the ventilator. Respiration frequency of
the medical ventilator was set to 10 inhales per minute,
which corresponds to 0,16 Hz (Figure 7).
Figure 6: Average difference of each maxima with
respiratory frequency 10 breaths per minute, for different
shape and material.
Figure 7: Respiration curve of the disk balloon made from
TPU resin (best of frequency 10 breaths per minute).
The best measuring balloons at this breathing
rate are the disk balloons made from TPU resin,
Dynamic Characteristic of the Pleural Cavity Pressure Sensor
183

also disk and square balloons from TPU 92A
(Table 3).
Table 3: Correlation between pressure in balloon and
ventilation flow at a breathing frequency 0.16 Hz (9.6/mn).
Correlation Material Shape
0,93 Disk TPU 92A
0,96 Square TPU 92A
0,89 Triangle TPU 92A
0,87 Disk TPE 95A
1,00 Disk TPU resin
0,87 Square PLA
0,86 Triangle PP
0,84 Triangle Rigid resin
0,86 Disk PETG
4 CONCLUSION
The current measurement method of the intrapleural
pressure (Ppl) from the esophageal site overestimates
Ppl. In addition, it is uncomfortable for the patient
whose exposure must be limited to a few minutes.
It therefore sounds a promising idea to investigate
the realization of a sensor which could be implanted
directly in the pleural cavity, for a couple of days or
week, in order to access anytime the true value of the
Ppl and therefore address its long-term variations.
We proposed a device, in the form of a small disk
(10 cm diameter) or a triangle (side 10 cm) printed
with biocompatible TPU92A or TPU resin. It is filled
with air but a fluid filled will also transmit the
pressure. The device exhibits good static and dynamic
characteristics. We demonstrated, on an artificial
lung, that it can track correctly the respiration at
standard frequencies.
Our next task will be to test it under real
conditions (in vivo animals), to confirm its promising
qualities.
Future developments will focus on the integration
of a wireless pressure sensor so as to make the system
autonomous after implantation. A MEMS
microsystem – integrating a pressure sensor, a
microcontroller, and a wireless communication – will
be placed inside the balloon to collect directly the
inside pressure and to transmit it outside the body, for
instance with passive RFID.
Before to be implemented in the thoracic cavity,
the safety and the impact on patient should be
evaluated through a clinical survey.
REFERENCES
J. R. Partington, The Life and Work of John Mayow (1641-
1679), Isis, The University of Chicago Press, 1956, Vol.
47(4), pp. 405-417
"Evarts Ambrose Graham, Empyema, and the Dawn of
Clinical Understanding of Negative Intrapleural
Pressure" DOI: 10.1086/338148.
Aboud, F. C, Vergheze, A. C., Evarts Ambrose Graham,
Empyema, and the Dawn of Clinical Understanding of
Negative Intrapleural Pressure. Clinical Infectious
Diseases [online]. 2002, 34(2), 198−203
Milic-Emili, J., Mead, J., Turner, J. M., and E. M. Glauser.
Improved technique for estimating pleural pressure
from esophageal balloons. Journal of Applied
Physiology, 1964, 19(2), 207−211
N. Terzi, S., N. Noury, E. Turbil, W. Habre, L. Argaud, M.
Cour, B. Louis, and C. Guerin, "Comparison of pleural
and esophageal pressure in supine and prone position in
a porcine model of acute respiratory distress
syndrome", J. Appl. Physiol, June 2020; 128(6): 1617–
1625.
C. Guerin, S. Bayat, N. Noury, M. Cour, L. Argaud, B.
Louis, and N. Terzi, "Regional lung viscoelastic
properties in supine and prone position in a porcine
model of acute respiratory distress syndrome", J Appl
Physiology, July 2021, Vol 131(1): 15-25
T. Mimra, M. Cerny, C. Guerin and N. Noury,
Experimentaly-guided development of a sensor for
pleural cavity pressure sensing, IEEE EMBC, Glasgow.
Annu Int Conf IEEE EMBS; 2022:4245-4248
BIODEVICES 2024 - 17th International Conference on Biomedical Electronics and Devices
184
